How to use filters in the Delta indicator

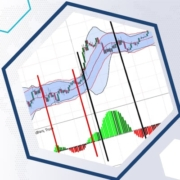
How to use filters in the Delta indicator

Unfortunately, many trading platforms do not contain volume indicators at all. Some of them transfer volumes but only tick ones or without dividing them into buys and sells, which limits traders in receiving important information. The ATAS platform allows analysing both buyer and seller behaviour separately not only in the horizontal projection (in other words, […]

The Coppock Curve indicator. How to apply the Coppock Curve in trading

How to apply the Coppock Curve in trading

Coppock Curve is a momentum indicator. It was developed by Edwin ‘Sedge’ Coppock, who was an economist by education. The original goal of this indicator was to detect long-term opportunities for buying in S&P 500 and Dow Industrials. However, can it be used for other markets / periods and how profitable are the curve signals? […]

How to test your trading system automatically

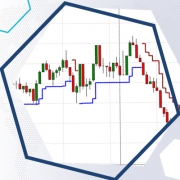
How to test trading system automatically with Super Trend

Analysis of COT indicators in the ATAS platform charts

New indicators! View COT report data directly on charts

Starting from version 5.7.22.2 three indicators for working with COT reports were added to the trading and analytical ATAS platform: COT Open Interest. COT Net Positions. COT Index. See display examples in the GBP futures (6B) chart below.

How to find strong intraday levels and how to trade them?

This article raises the issue of the significance of dynamic trading systems, which independently adapt to the market. How to develop them? We will try to demonstrate it with the use of 2 indicators. The Dynamic Levels indicator will find strong dynamic intraday levels, while the Cluster Search indicator will show traps for sellers and […]

Looking for significant levels with the Graduated Volume

Analysis of COT indicators in the ATAS platform charts

What is a continuous futures contract

What is a continuous futures contract?