5 best instruments for searching for ‘managed money. Examples
A big number of articles about trading is devoted to the subject of how to track actions of the ‘managed money’. We also wrote many times about it in our blog (for example, Catching major players in the act of doing). Despite this fact, the interest in the subject of searching for major players is still high.
In order to provide a reader with as much useful information on this subject as possible, we present a set of 5 professional ATAS instruments, which have been developed to track major players.
Read in this article:
- The idea of searching for a major player.
- The Cluster Search indicator.
- The Smart Tape module.
- The Order Flow indicator.
- The Big Trades indicator.
- The Cumulative Trades chart.
The idea of searching for a major player
As well as it is in any other business, 2 unbreakable principles act in the stock and forward markets:
- the law of demand and supply;
- the strongest survives. It means that professionals stay in the business and amateurs leave it.
Tom Williams, the founder of the VSA strategy, calls professionals ‘strong holders’ and amateurs – ‘weak holders’. Strong holders have a lot of money and they understand price movements better. That is why their actions are very important for the market. Strong holders represent the managed money.
If you understand what the managed money does, you have an opportunity to act in harmony with the market.
ATAS has several instruments, which make it easier to look for big trades. Let’s consider 5 such key instruments in more detail.
The Cluster Search indicator
The indicator name (Cluster Search) itself suggests that it searches for clusters by the set criteria and highlights them in the chart.
Clusters are ‘details’ or ‘interiors’ of every bar. You can expand any bar to clusters and see what number of contracts or lots were traded at each price level.
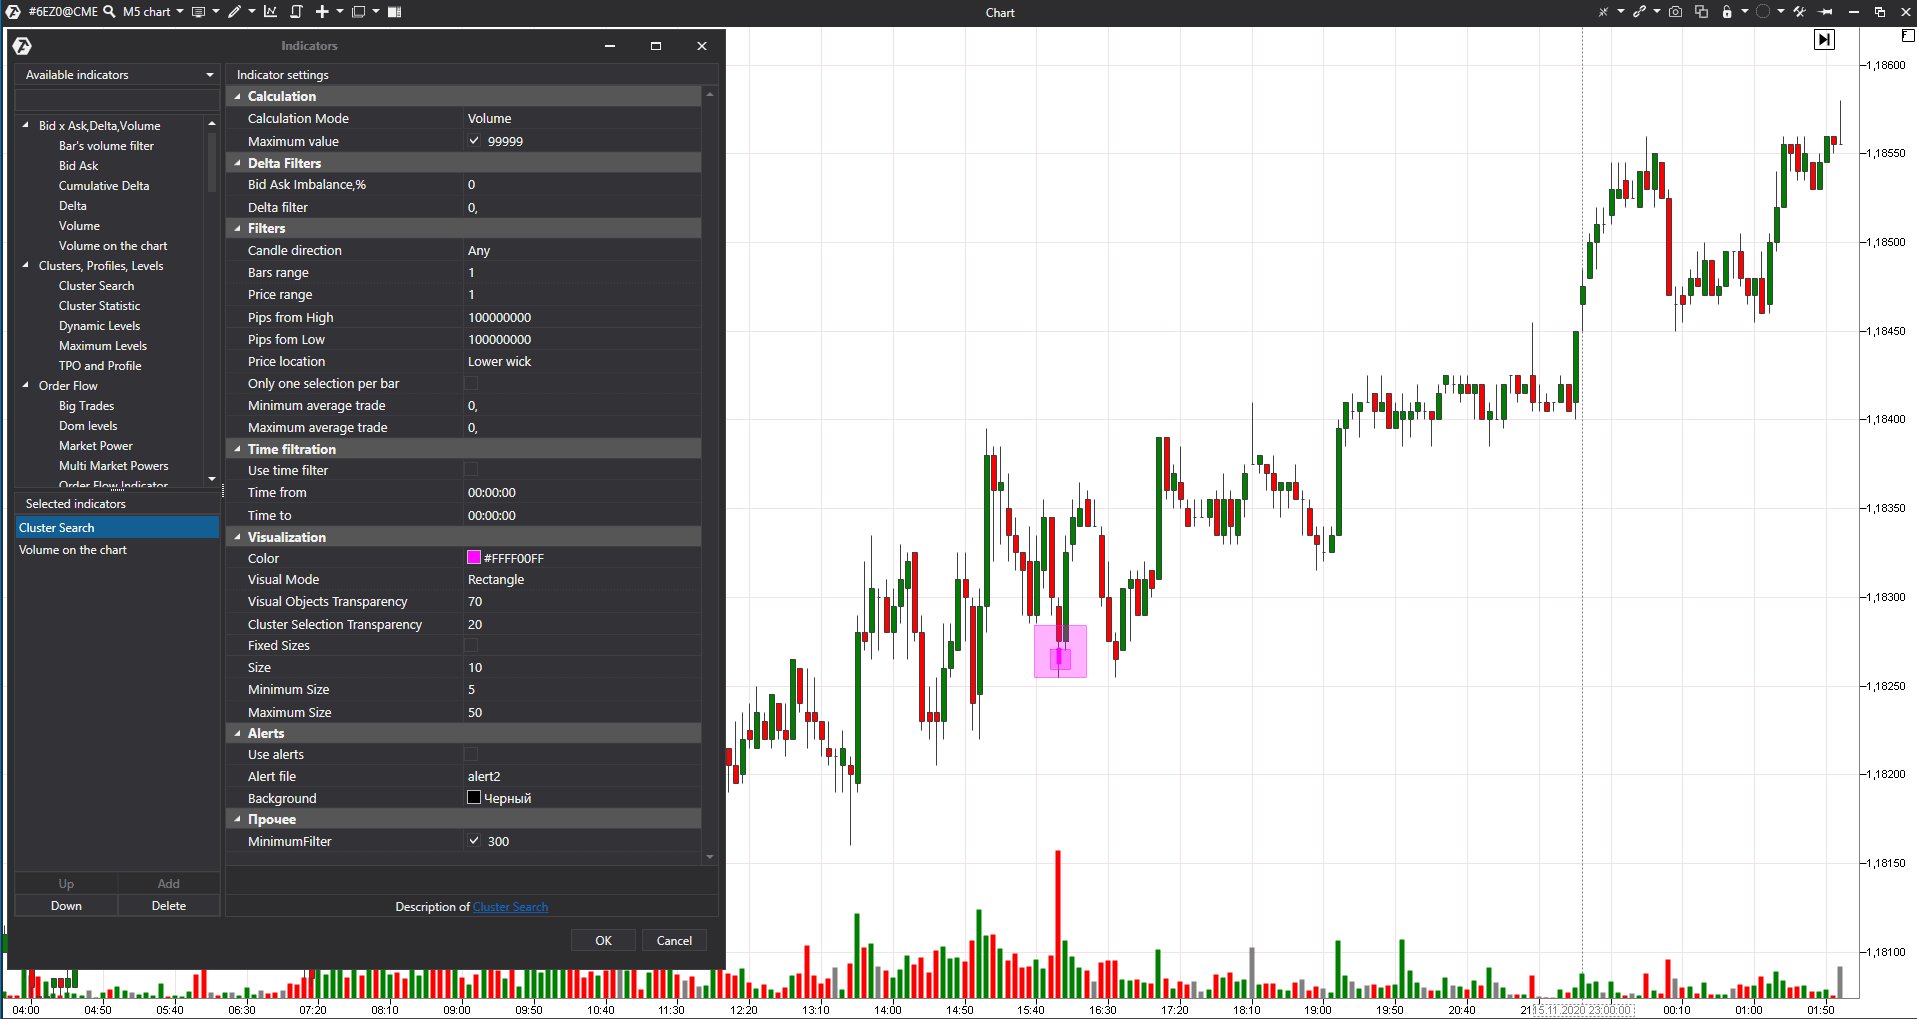
For example, when using this indicator, you may find those clusters in the 5-minute euro futures (6EZ0) chart, where more than 300 contracts were traded in one go at the bottom candlestick shadow. Such levels will be highlighted with lilac squares in the chart. The bigger the square, the bigger number of contracts will be traded.
The indicator settings are very flexible. A trader may select:
- the cluster location in the candle,
- the bullish or bearish candle,
- preponderance of Bid/Ask.
The found clusters could be marked with any colour and shape. Cluster values could be filtered out by Delta, Volume, Bids/Asks, trades and time.
Thus, the Cluster Search indicator will be useful in any trading strategy. The system provides an audio signal, for traders’ convenience, when proper clusters appear. It means that a trader will not miss something important even if he works on another screen.
Useful links for working with the Cluster Search indicator:
- Knowledge Base;
- How to set up the Cluster Search indicator;
- Cluster analysis with the Cluster Search indicator.
Of course, Cluster Search is not a magic wand. Traders will have to adjust and select the best parameters for various instruments and analyse the market context by themselves.
The Smart Tape (Time & Sales)
The next instrument of searching for big trades is the Smart Tape (Time & Sales). This is not an indicator but a separate module, which shows the flow of executed orders.
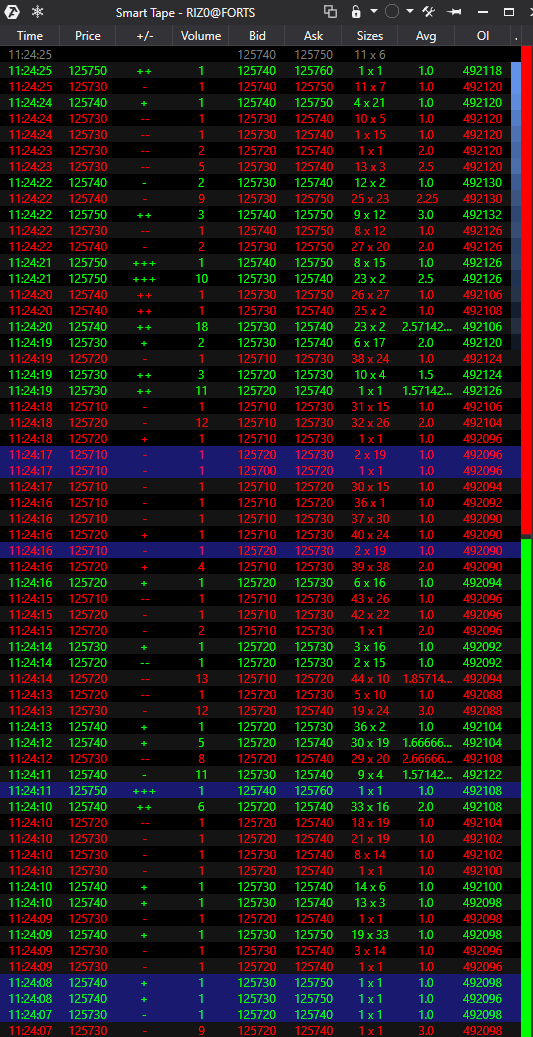
The standard Time & Sales tape shows real market orders in the course of their execution and it moves very fast, that is why it is difficult to analyse it in real time. However, the Smart Tape in ATAS is able to group a big number of small trades, that is why it is easier to perceive this information.
Besides, you can do the following in the ATAS Smart Tape:
- set up filtering out of trades with a certain volume;
- reduce the number of fields;
- see the price reaction in the form of ‘+’ and ‘-’;
- select other settings and conduct trading.
The classical Smart Tape variant is presented in the following picture.
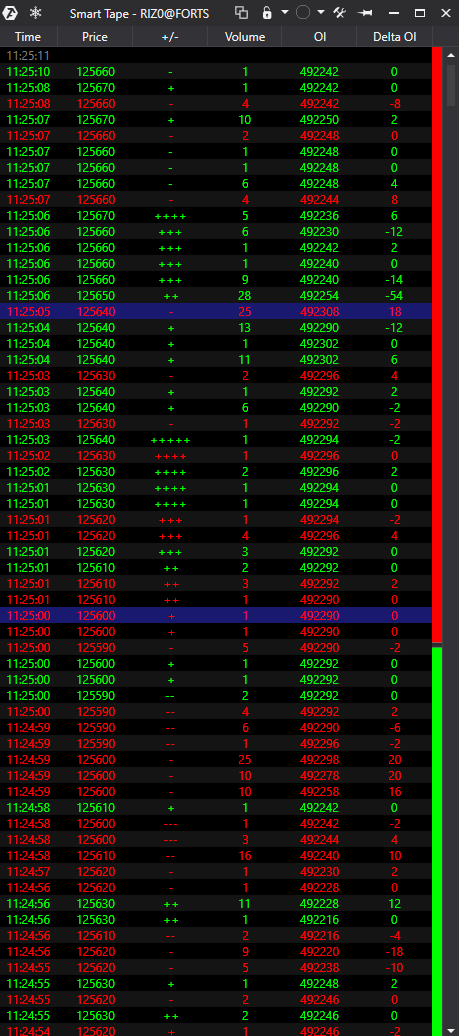
You can also set up your templates with a required number of fields and save them. Templates could be quickly applied to other instruments without wasting time for their setup.
Example. We added the Delta OI field and removed Bid and Ask fields for the RTS index futures (RIZ0) Smart Tape.
In order to see big trades with the help of the Smart Tape, it could be filtered out. For example, if you select the number of contracts 500 and more, the Tape will show trades with more than 500 contracts only. Smaller trades will not be shown – it will slow down the Tape speed and make it simple to search for activity of a major player.
Useful links for working with the Smart Tape:
- Knowledge Base;
- How to read the Smart Tape;
- Smart Tape secrets.
The Order Flow indicator
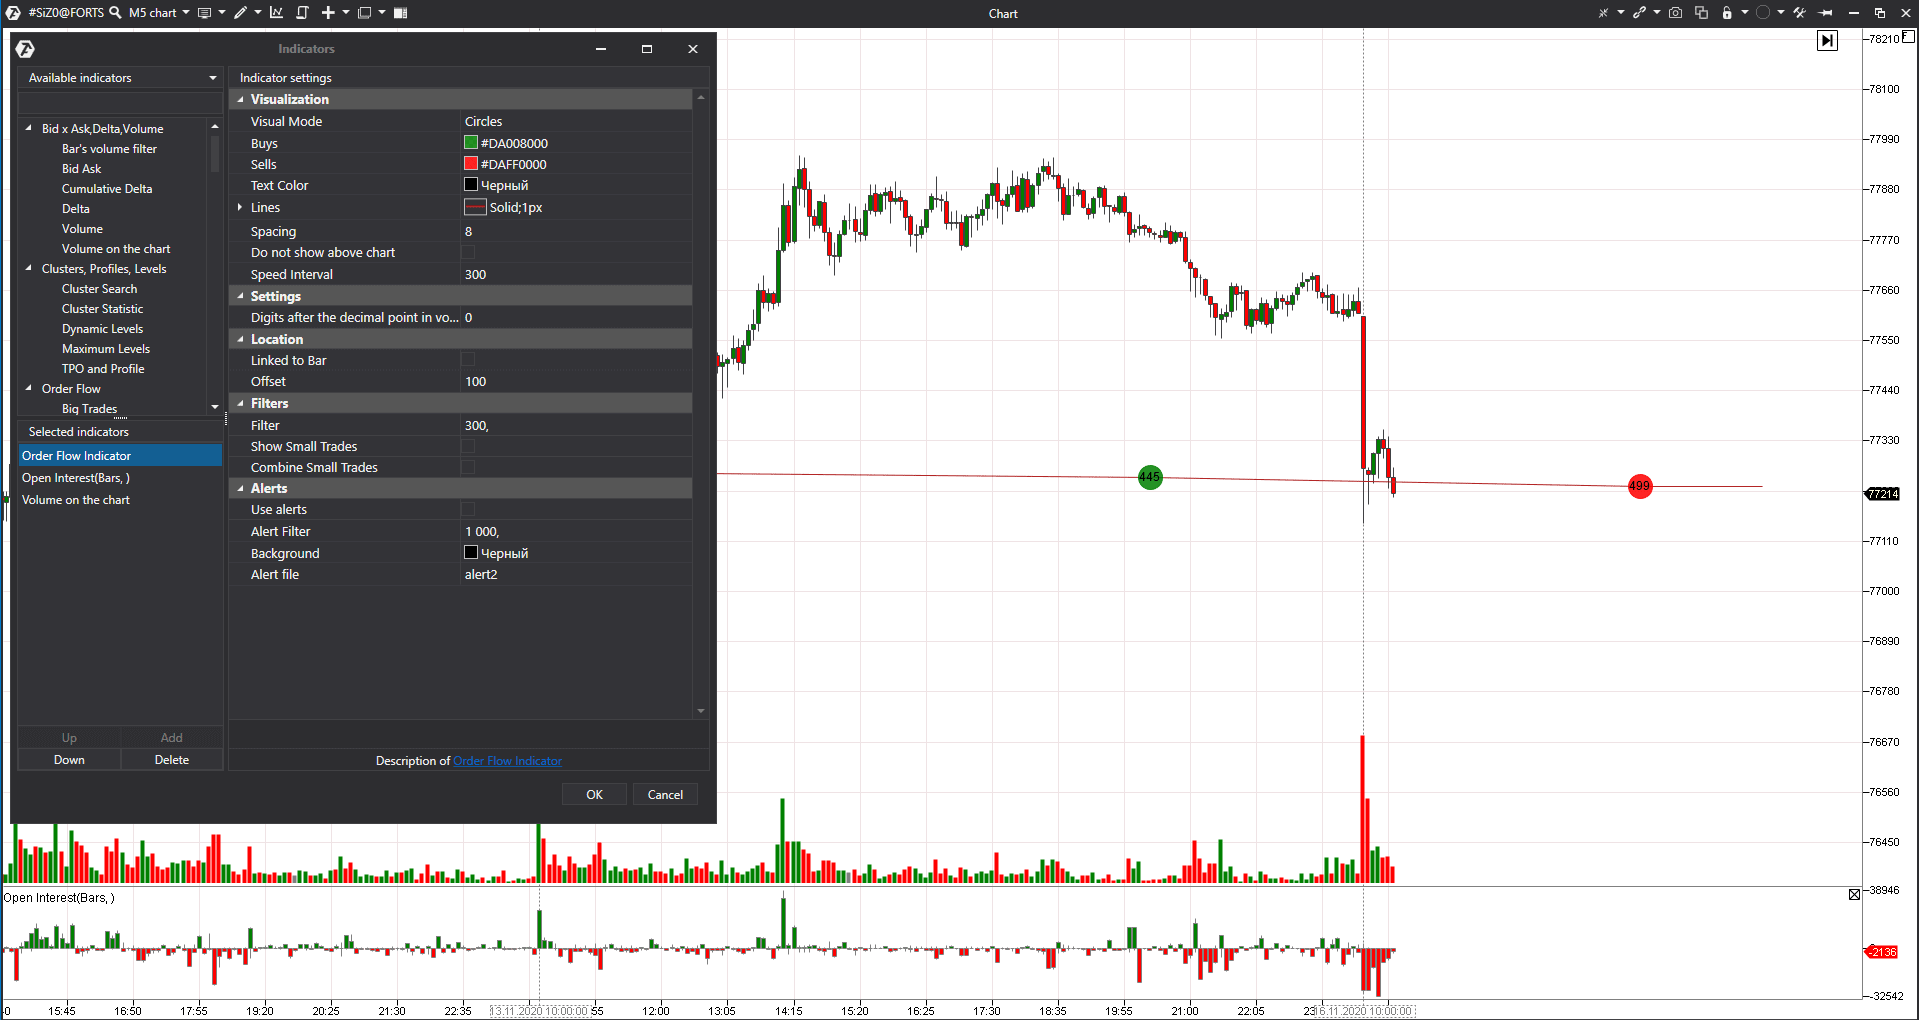
The next instrument the Order Flow indicator – also shows actually executed market orders but directly in the chart. This indicator doesn’t have as many settings as the Cluster Search does, but a trader may change the visual display, turn on the audio signal and filter out trades in different ways.
The indicator could also be set for filtering out big trades. Perhaps, some traders will find this approach more convenient for analysing information, since it is more visually vivid.
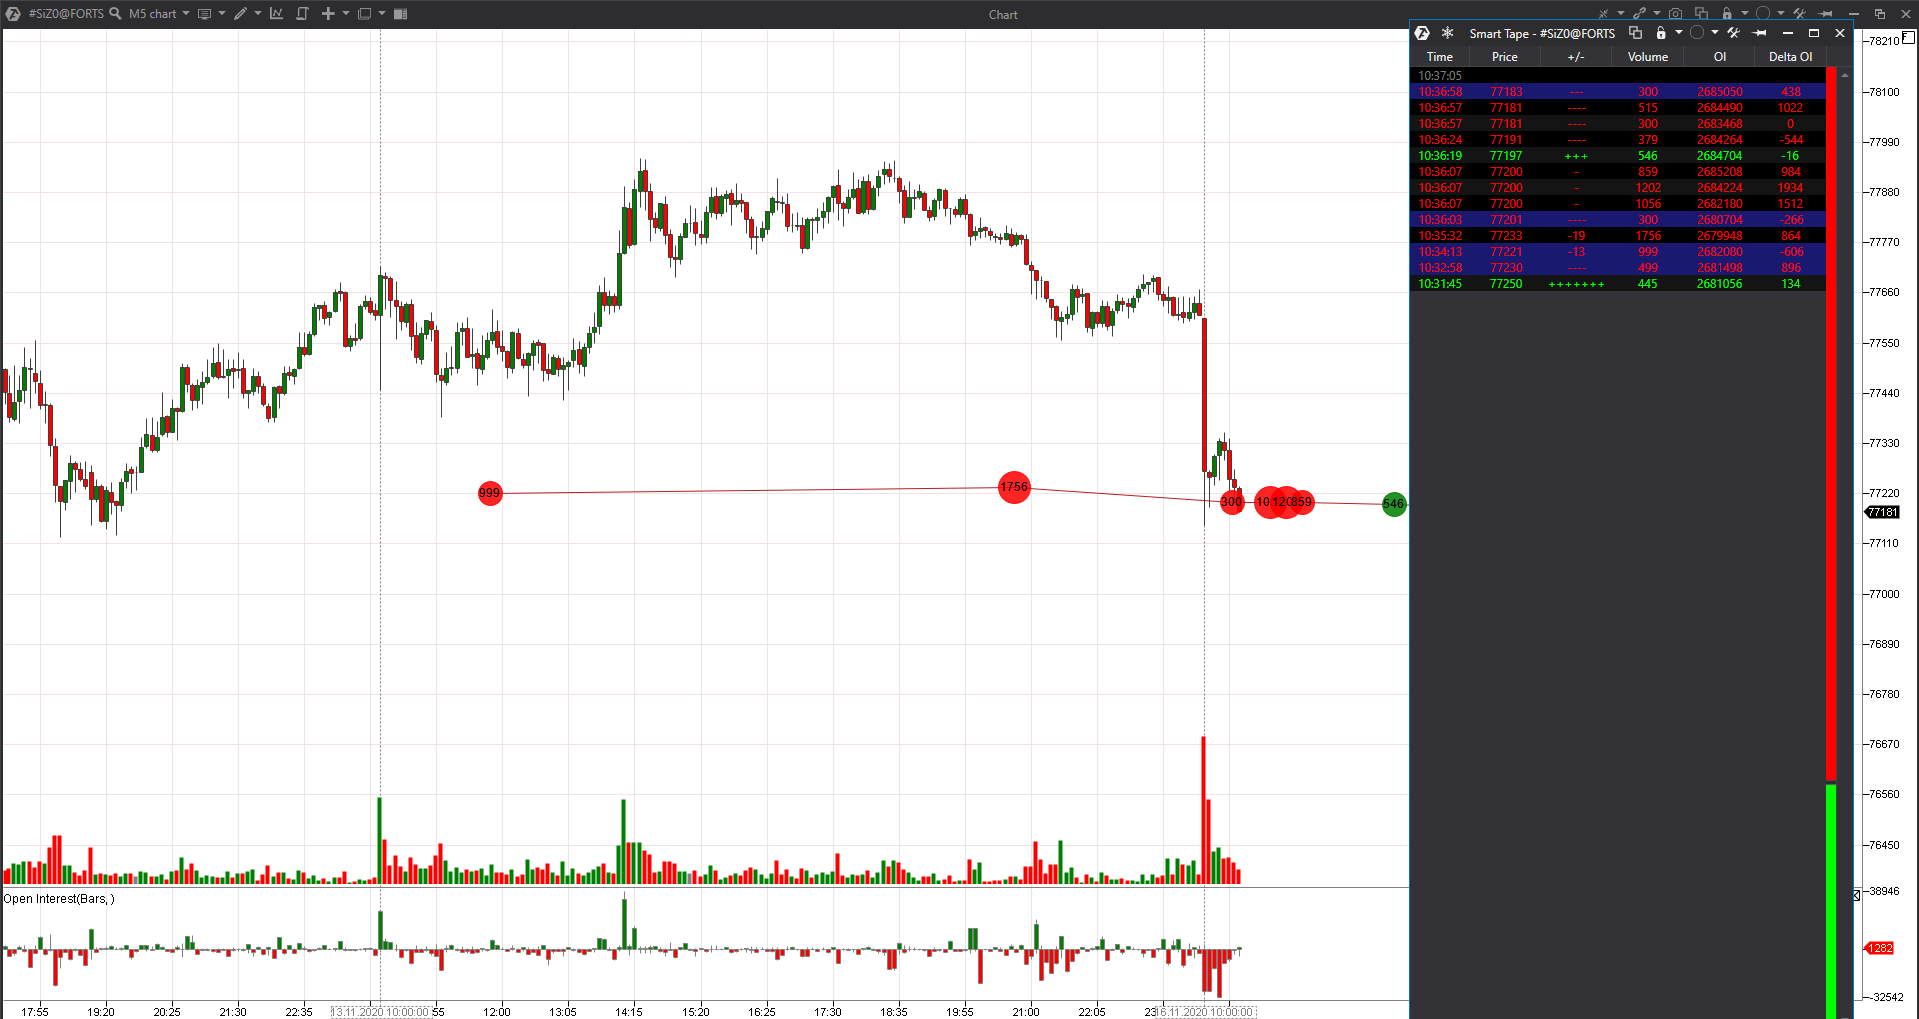
For example, we filtered out the Smart Tape and Order Flow indicator similarly in the 5-minute USD/RUB exchange rate futures (SIZ0) chart in order to see trades with more than 300 contracts. We see the number of contracts and the price level in both cases.
Useful links for working with the Order Flow indicator:
The Cumulative trades chart
It also shows data from the Tape but in the form of clusters, fixed in the chart. It depends on the number of contracts or lots, specified in settings, what clusters are shown.
This chart type could be very interesting due to its clear visualization.
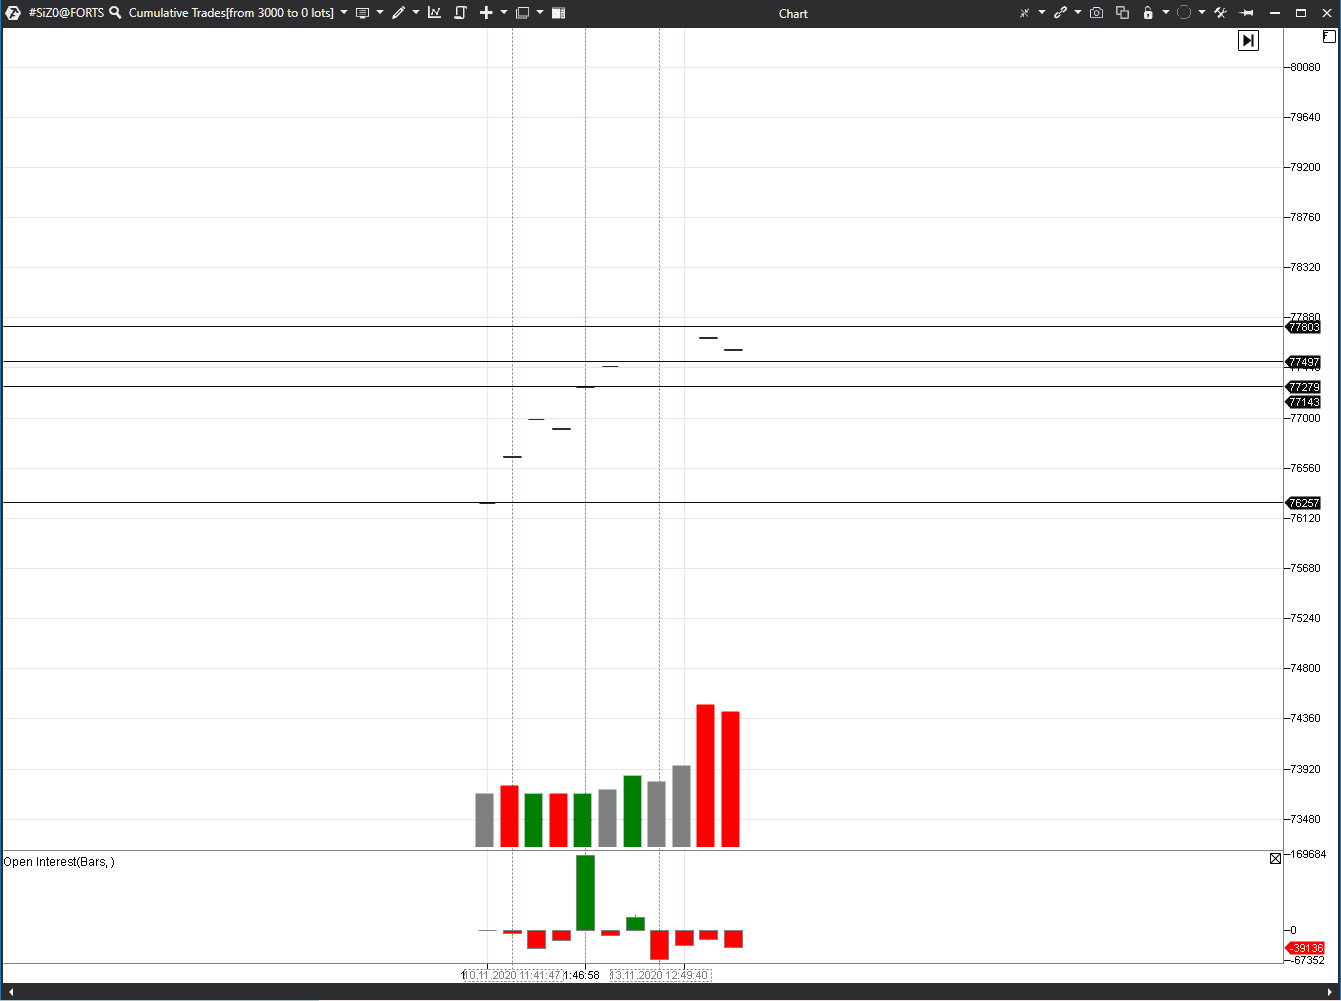
Example. Let’s set up a display of clusters with more than 3,000 contracts, traded in one trade in the USD/RUB exchange rate futures (SIZ0) chart.
There will be very few clusters in the chart with such settings. Let’s mark some big trades with horizontal levels. For example, let’s take the maximum and minimum levels and also 2 levels with the positive Open Interest.
The positive Open Interest is the opening of new contracts, that is an inflow of new money to the market. Levels could be marked in accordance with a different logic depending on the used trading strategy.
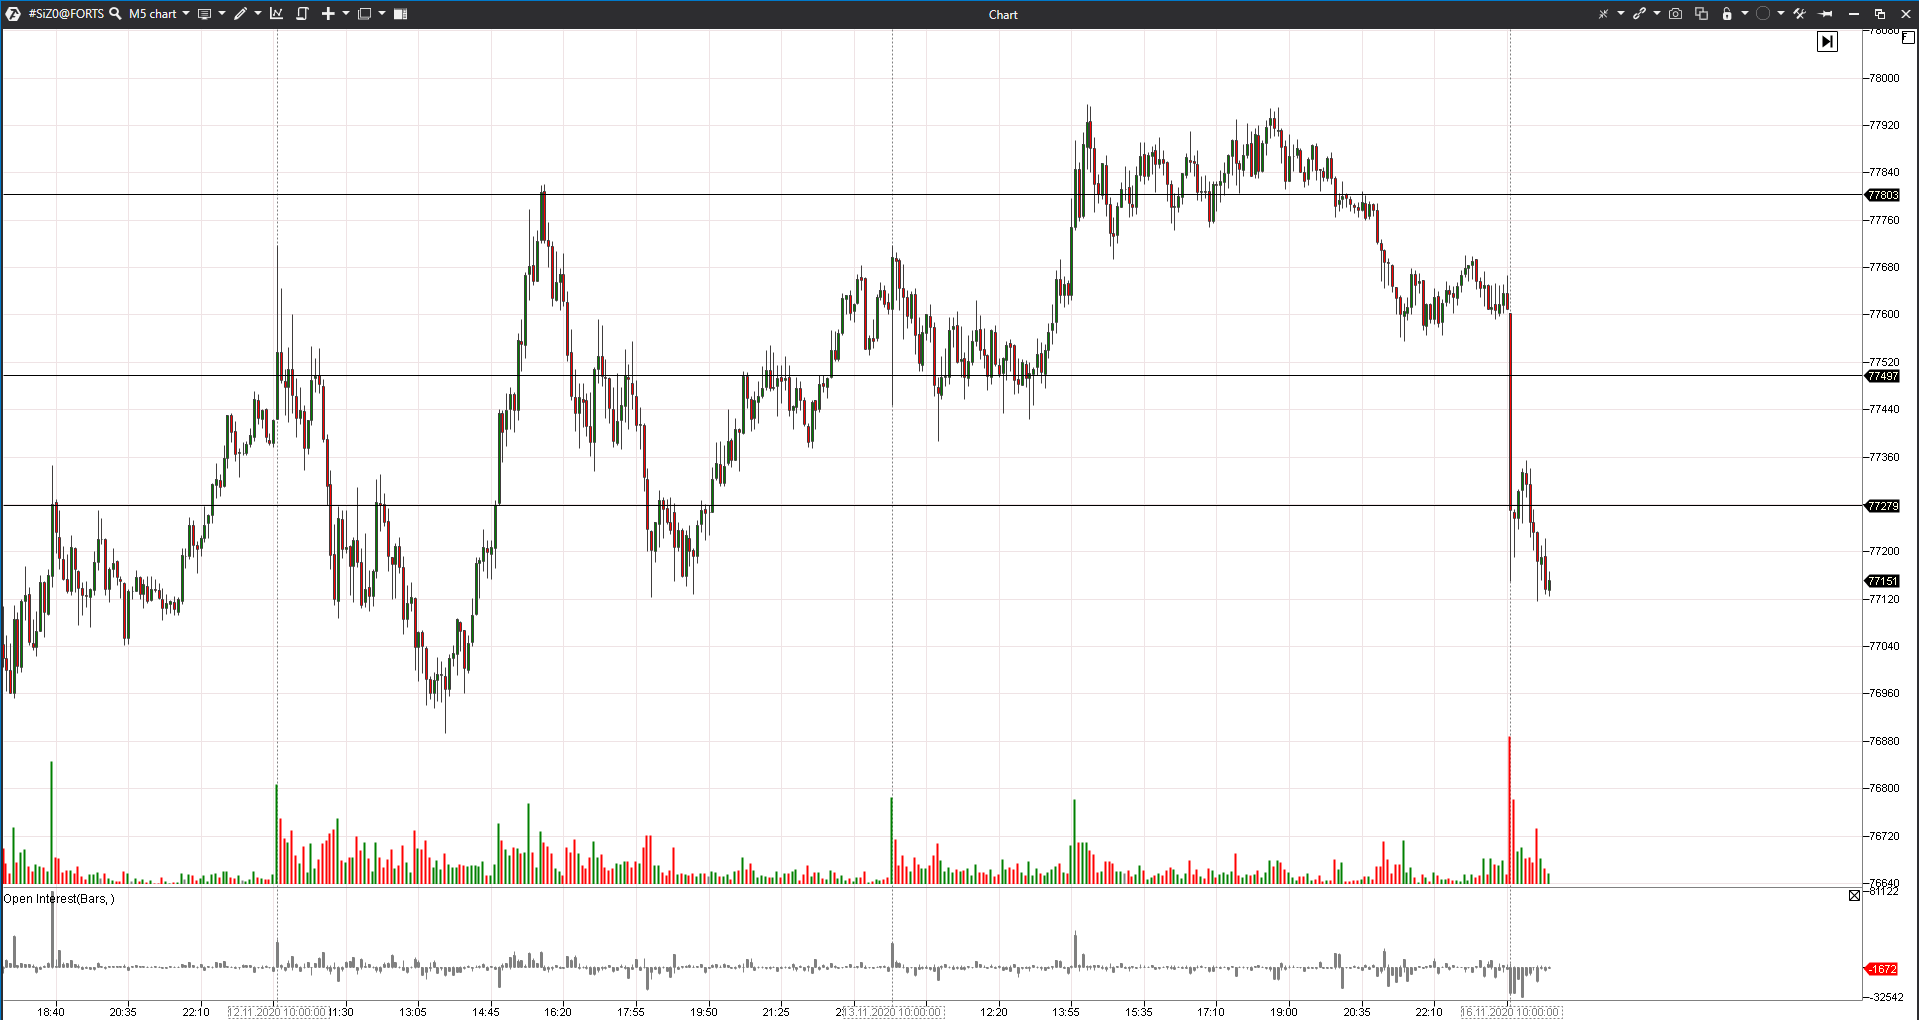
And now we take the 5-minute chart and check whether an intraday trader was able to work with marked levels.
It is seen from the chart that our levels could have been used as the support/resistance levels – the price obviously ‘slowed down’ near them. If the managed money was buying here, perhaps, it ‘protected’ these levels further on.
Useful links for working with the Cumulative Trades chart:
- Chart types in the Knowledge Base;
The Big Trades indicator
The last indicator, which we will discuss in our article, is Big Trades. It also takes information from the Smart Tape and shows it in the chart in the form of bright geometric patterns.
The indicator has the ‘autofilter’ mode, which adjusts the indicator to the instrument. The autofilter helps beginner traders to master the indicator.
More competent and experienced traders can use this indicator for filtering out the volume by the set criteria.
Useful links for working with the Big Trades indicator:
- Indicator description in the Knowledge Base;
- 4 tricks of the Big Trades indicator;
As we already mentioned, indicators are not magic wands, but they help traders to make well-considered decisions when they work in accordance with their trading strategies.
Combination of indicators
Indicators could be combined with any other instruments of cluster and technical analysis.
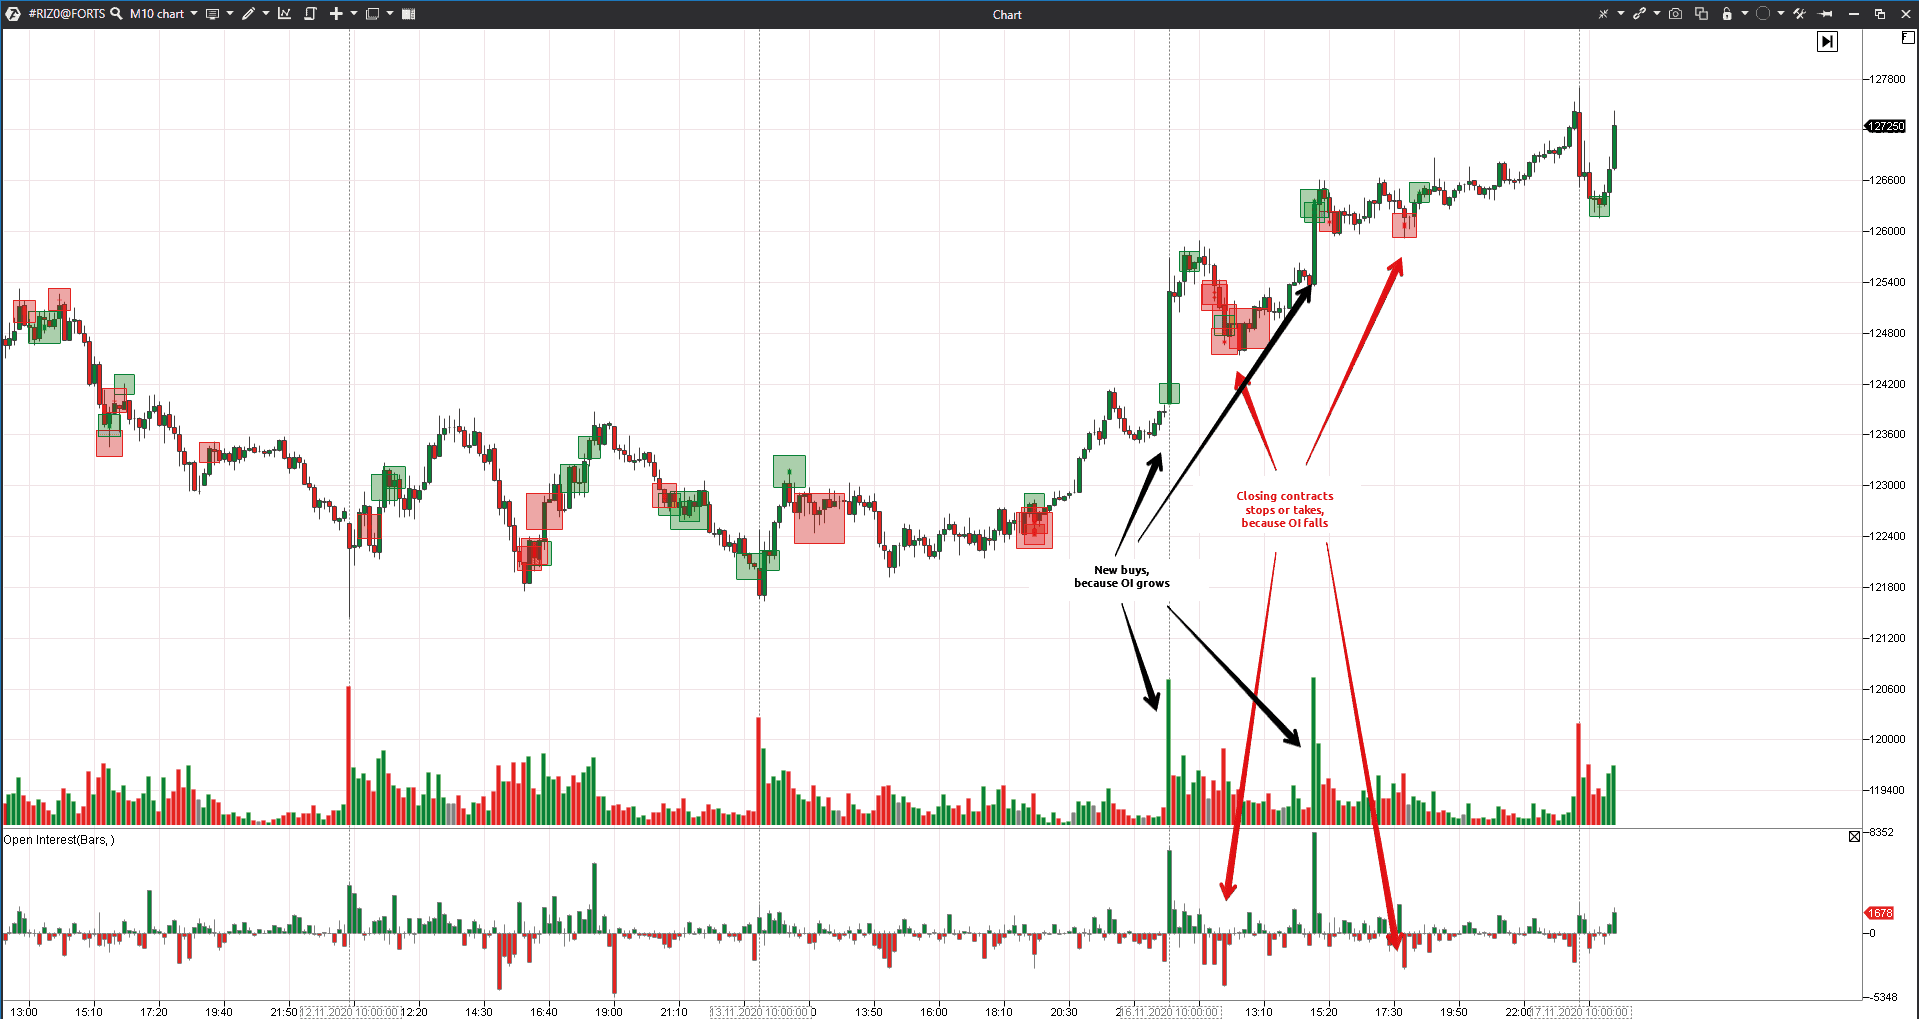
For example, let’s add the Open Interest indicator to the RTS index futures chart.
Only the Moscow Exchange shows these data in real time.
- If OI grows, it means that traders open new contracts and new money comes to the market.
- If OI falls, it means that traders close contracts and leave this market.
Let’s assume that we want to find new buys with the help of the Big Trades indicator. If OI simultaneously grows in these bars, it gives an additional confirmation of the buyers’ strength. If OI falls simultaneously with big sells, it means that buyers register profit or exit by stops with losses.
Useful links for working with the Open Interest indicator:
- Indicator description in the Knowledge Base;
- The OI Analyzer indicator – searching for entries with low risk.
Conclusions
Modern indicators and chart types make the trader’s life easier and reduce the emotional load during trading.
The ATAS platform is an excellent set of instruments for professional trading. ATAS will help you to concentrate on the strategy and global understanding of the market in order to trade more efficiently.
Information in this article cannot be perceived as a call for investing or buying/selling of any asset on the exchange. All situations, discussed in the article, are provided with the purpose of getting acquainted with the functionality and advantages of the ATAS platform.

