
- a self-sufficient trading system;
- a part of more complex trading systems.
In any case, it is important for a beginner trader to get acquainted with the basics of level trading and use this knowledge in daily market analysis.
This article is devoted to trading from significant levels, which are identified with the help of volumes. Read in this article:
- Price levels in the charts.
- Nature of level origination. Influence on the price.
- The Maximum Levels indicator is an assistant in identifying significant levels.
- How to trade volume levels in practice? Examples.
What levels are
Horizontal lines in the charts of exchange prices are called levels.- Levels could prevent the price upward movement. In this case they are called resistance levels.
- And vice versa, if a level as if supports the price and doesn’t allow it to fall, then it is called a support level.
Figuratively speaking, horizontal levels are like storeys in a multi-storeyed building by which the price moves. A level could first be the resistance level, but it often becomes the price support level after it is broken. Such levels are called mirror levels.
Nature of level origination. Influence on the price
So, where do the levels, which could stop the price, originate from?
These are not just hypothetical lines, drawn in the chart. Only actions of major market participants may stop the price.
The price grows because the majority of market participants buy a financial instrument using market orders. Limit orders of sellers are on the opposite side of these market buys. And while there are more market buys than limit sell orders in the order book, the price will grow, moving up from one level to another.
The growth will stop only when there will be more limit orders than market buyers. As a variant, the price will reverse after that and a new horizontal level will appear in the chart.
Horizontal level → Big accumulation of limit orders
Limit orders are more often used in the market by major professional market participants. Consequently, a level is a significant price for a professional. And a private trader, who works by levels, acts in harmony with the major player, increasing his chances of success.
On the other hand, levels are connected with the market participant psychology. If the level stopped the price upward movement, a big number of buyers, who continue holding their positions ‘in the red’, can stay in the market. Open losses always hurt traders and, consequently, they want to get rid of them as soon as possible.
Horizontal level → Losses → Pain of some traders
In such situations, traders do not count on profit. They want to exit the market with minimum losses. That is why, they may push the price back to the level and close loss-making positions at the first opportunity.
As a result, we may see in the market:
- level tests,
- double / triple tops or bottoms.
If you understand the nature of the level origination, it will be easier for you to find them in the price charts and use them for trading.
The Maximum Levels indicator is an assistant in identifying significant levels
One of the problems of trading with the help of levels is a subjectivism of their identification. Some traders draw levels by price highs and lows and others – by closing prices.
Besides, the level location selection is also subjective. Different traders may identify its location in different places, even if the level drawing rules are similar.
You could solve the subjectivism problem if you clearly describe and/or automate the level drawing process.
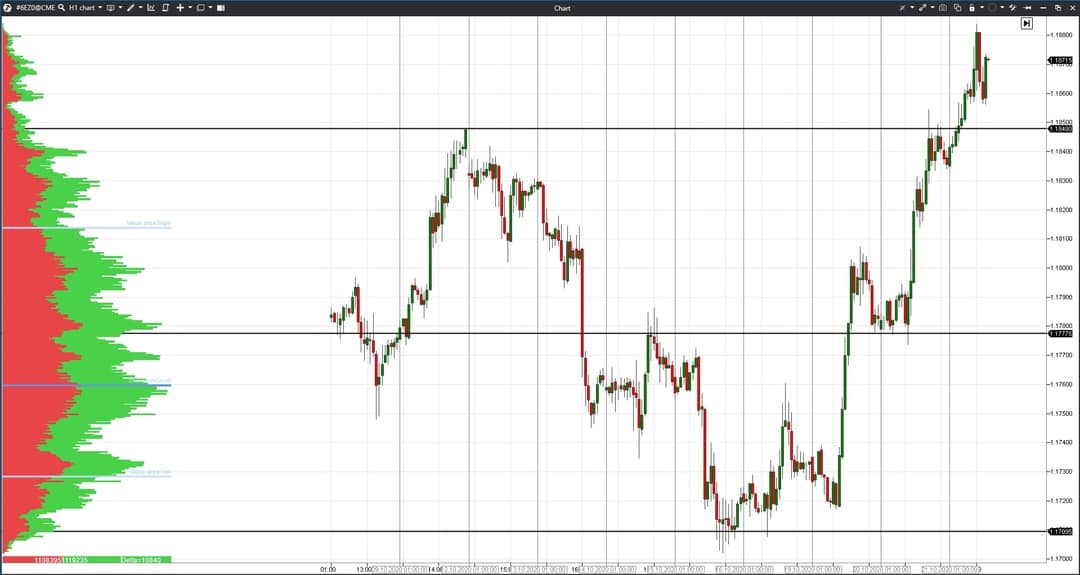
The trading ATAS platform has the Maximum Levels indicator, which shows levels of the maximum volume, which was accumulated for a period of time. And since a level is an accumulation of limit orders, the maximally traded volume just shows the biggest accumulations of orders and trades. Consequently, they are the most significant levels.
We added some Maximum Levels indicators to the euro futures chart (see the picture below).
We have several significant time periods and each of them forms its own significant volume level:
- Current day.
- Previous day.
- Current week.
- Previous week.
- Current month.
- Previous month.
- Contract.
And, in order to see the maximally full-featured picture, it is desirable to set 7 Maximum Levels indicators in the chart with various periods. The longer period you consider, the more important the level, which was formed during this time period, is.
Seven levels, built by the Maximum Levels indicator, could be a supplement in any trading system. Or it is possible to build a self-reliant trading approach on the basis of these levels.
How to trade volume levels in practice
Let’s consider 2 trading approaches, which could be used for building a trading system on the basis of volume levels, created by the Maximum Levels indicator.First, let’s prepare the trading and analytical ATAS platform for trading volume levels:
- Select the H1 time-frame for trading, since it allows to see the price interaction with the volume levels during a day and doesn’t take up much time for trading.
- Set 7 Maximum Levels indicators in the chart with various periods.
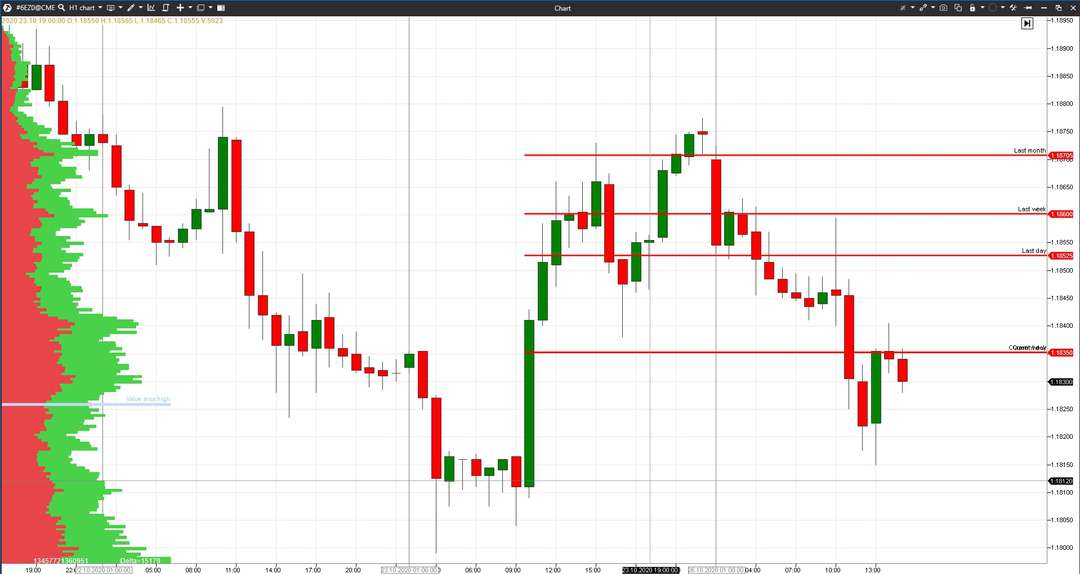
Approach 1. Volume level breakout.
Two candles are sufficient for identifying the volume level breakout: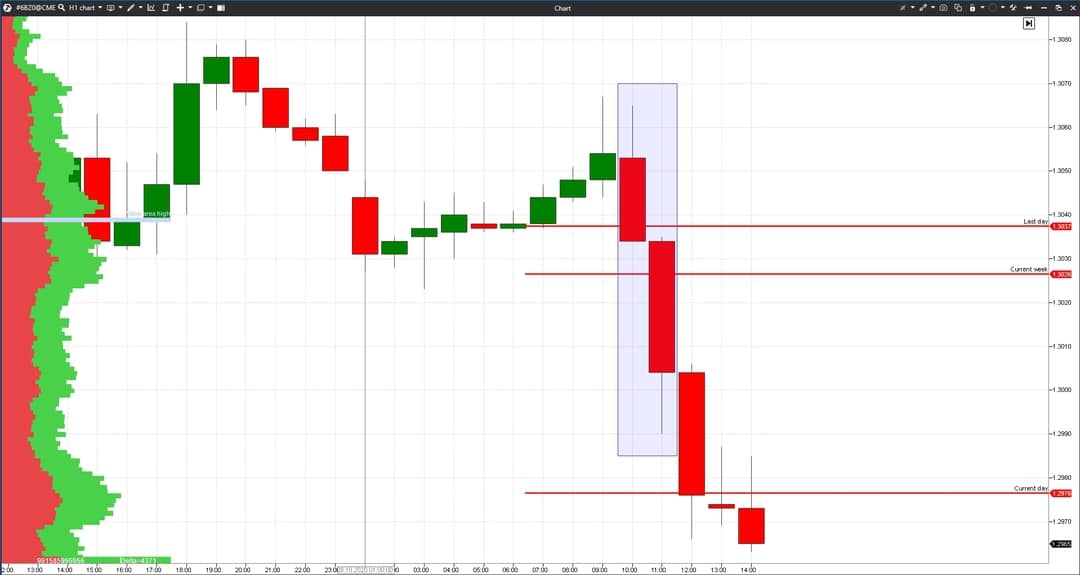
- The first candle should be closed behind the level.
- The second candle should confirm that there was a breakout.
- The price should move in the direction of the breakout.
- The candle should also close below the volume level in the down movement.
- The form of the breaking and confirming candles should be a trend form in the direction of the breakout. In other words, candle bodies should be bigger than candle shadows.
Losses could be limited behind the extreme points of the confirming candle. After that, the trade could be accompanied behind the extreme points of new candles.
Approach 2. Volume level bounce
Two candles are also sufficient for identifying the volume level bounce: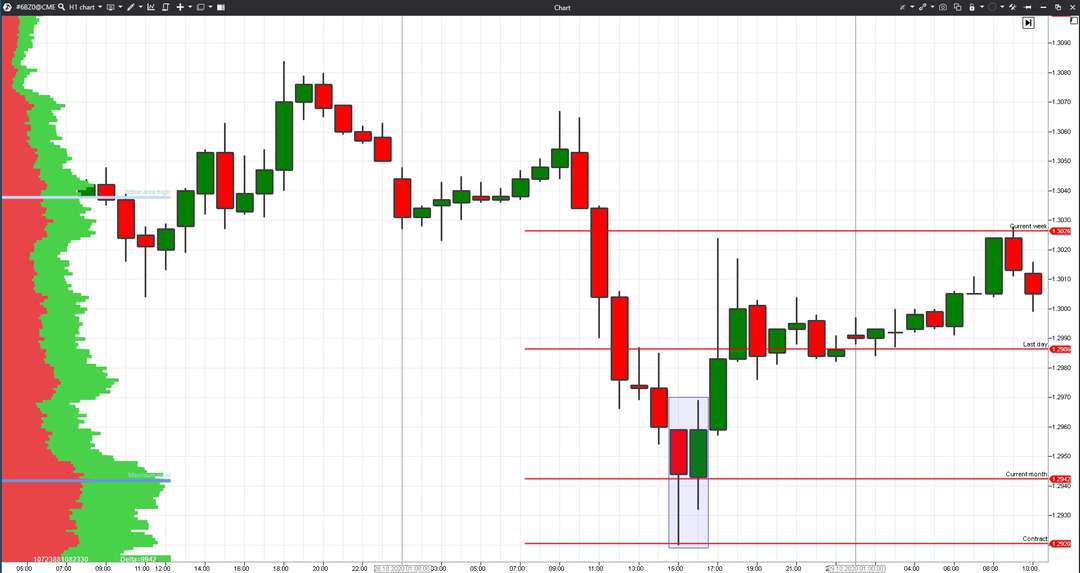
- It is possible to limit losses behind extreme points of the confirming candle after entering in the direction of the reversal.
- Later on, the trade could be accompanied behind the extreme points of new candles.
Such a simple approach to trading could be affordable even for beginner traders. In the course of acquiring experience, it is possible to track several trading instruments, which would increase the number of trading signals. It is better to use the demo account for acquiring experience and collecting statistics for this trading approach.
Conclusions
Levels are one of the key instruments in trading. You cannot ignore them. It is important to remember that:- Levels are formed due to accumulation of limit orders, that is why volume analysis may show levels, which are especially significant for the market.
- Seven Maximum Levels indicators, set for various time periods, will help to find significant levels.
- Two trend candles are sufficient for identification of a level breakout.
- Reversal configuration of Japanese candles is sufficient for identification of a bounce from the level.
Information in this article cannot be perceived as a call for investing or buying/selling of any asset on the exchange. All situations, discussed in the article, are provided with the purpose of getting acquainted with the functionality and advantages of the ATAS platform.


