All Prices module: a step-by-step guide with chart examples.
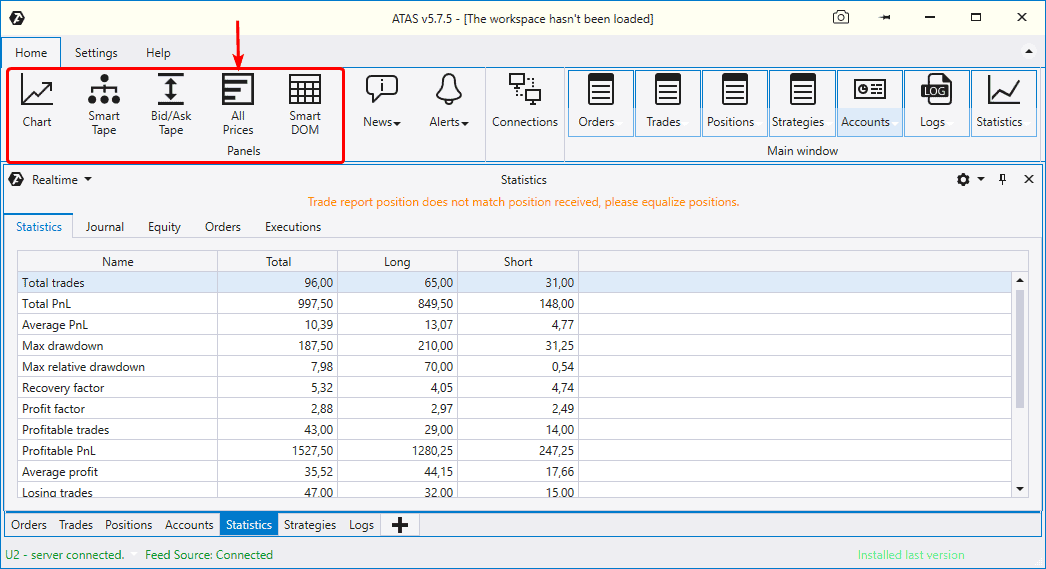
The main window of the trading and analytical ATAS platform has the Home tab, which has 5 buttons for calling the key program modules.
All modules are opened in new windows, besides, you should select an exchange instrument (market) in each case.
- Chart – perhaps, the most frequently pressed button. It opens a multifunctional module for working with charts with a possibility of adding indicators, building footprints and carrying on trading.
- Smart Tape – opens the smart time and sales tape.
- Bid/Ask Tape – opens the Spread Tape.
- All Prices – opens the table of all prices.
- Smart DOM – opens the Smart Order Book (Depth Of Market).
In this article, we will analyse the All Prices module and its practical application.
Interface of the All Prices module. Setting the module
Let’s analyse the module interface and find out what each component means.
Those who like the QUIK terminal will appreciate the way the information is presented. The market data are also presented in the table form in this ATAS module.
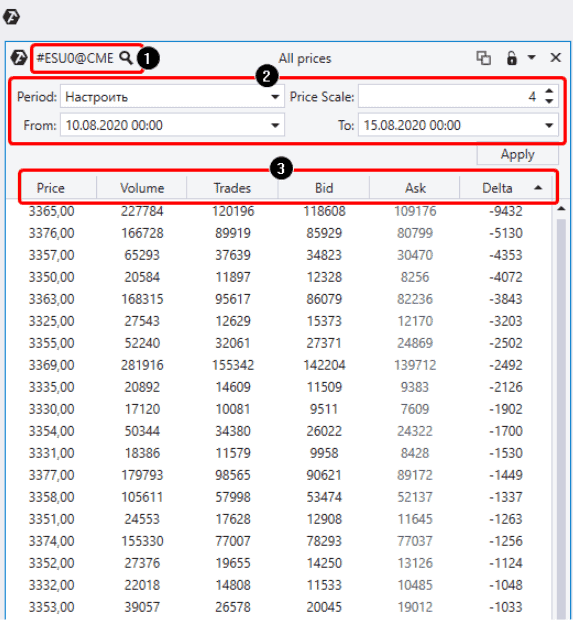
Number 1 – this area shows the data on what instrument are loaded into the module. In our case it is information about the E-mini S&P 500 futures contract.
Number 2 – settings are adjusted here. For example, you can use the time filter to select the starting and final date of the period, the data of which would be loaded into the table. You can select ‘the current day/week/month’, ‘the previous day/week/month’ or the current contract or set any random period. You can also set the Price Scale in order to, for example, reduce the detailed breakdown and join several neighbouring levels into one. In our case, we selected value 4, which means that we joined four levels into 1 area to attach significance to the results.
Number 3 – available columns are shown here. There are six of them:
- Price – level.
- Volume – number of contracts, which were traded at this level during the selected period. The level with the maximum volume will be marked red.
- Trades – a number of trades, executed at this level for the selected period. The level with the maximum number of conducted trades will be marked red.
- Bid – a number of market sells.
- Ask – a number of market buys.
- Delta – the difference between Ask and Bid.
You can sort out the table data by the values of any column. For example, the information is sorted out in our case by the Delta values from smallest to largest. The upper row shows the minimum value – minus 9,432 contracts.
How to use it with a benefit? Let’s analyse it right now.
Building levels by the Delta with the use of the All Prices module
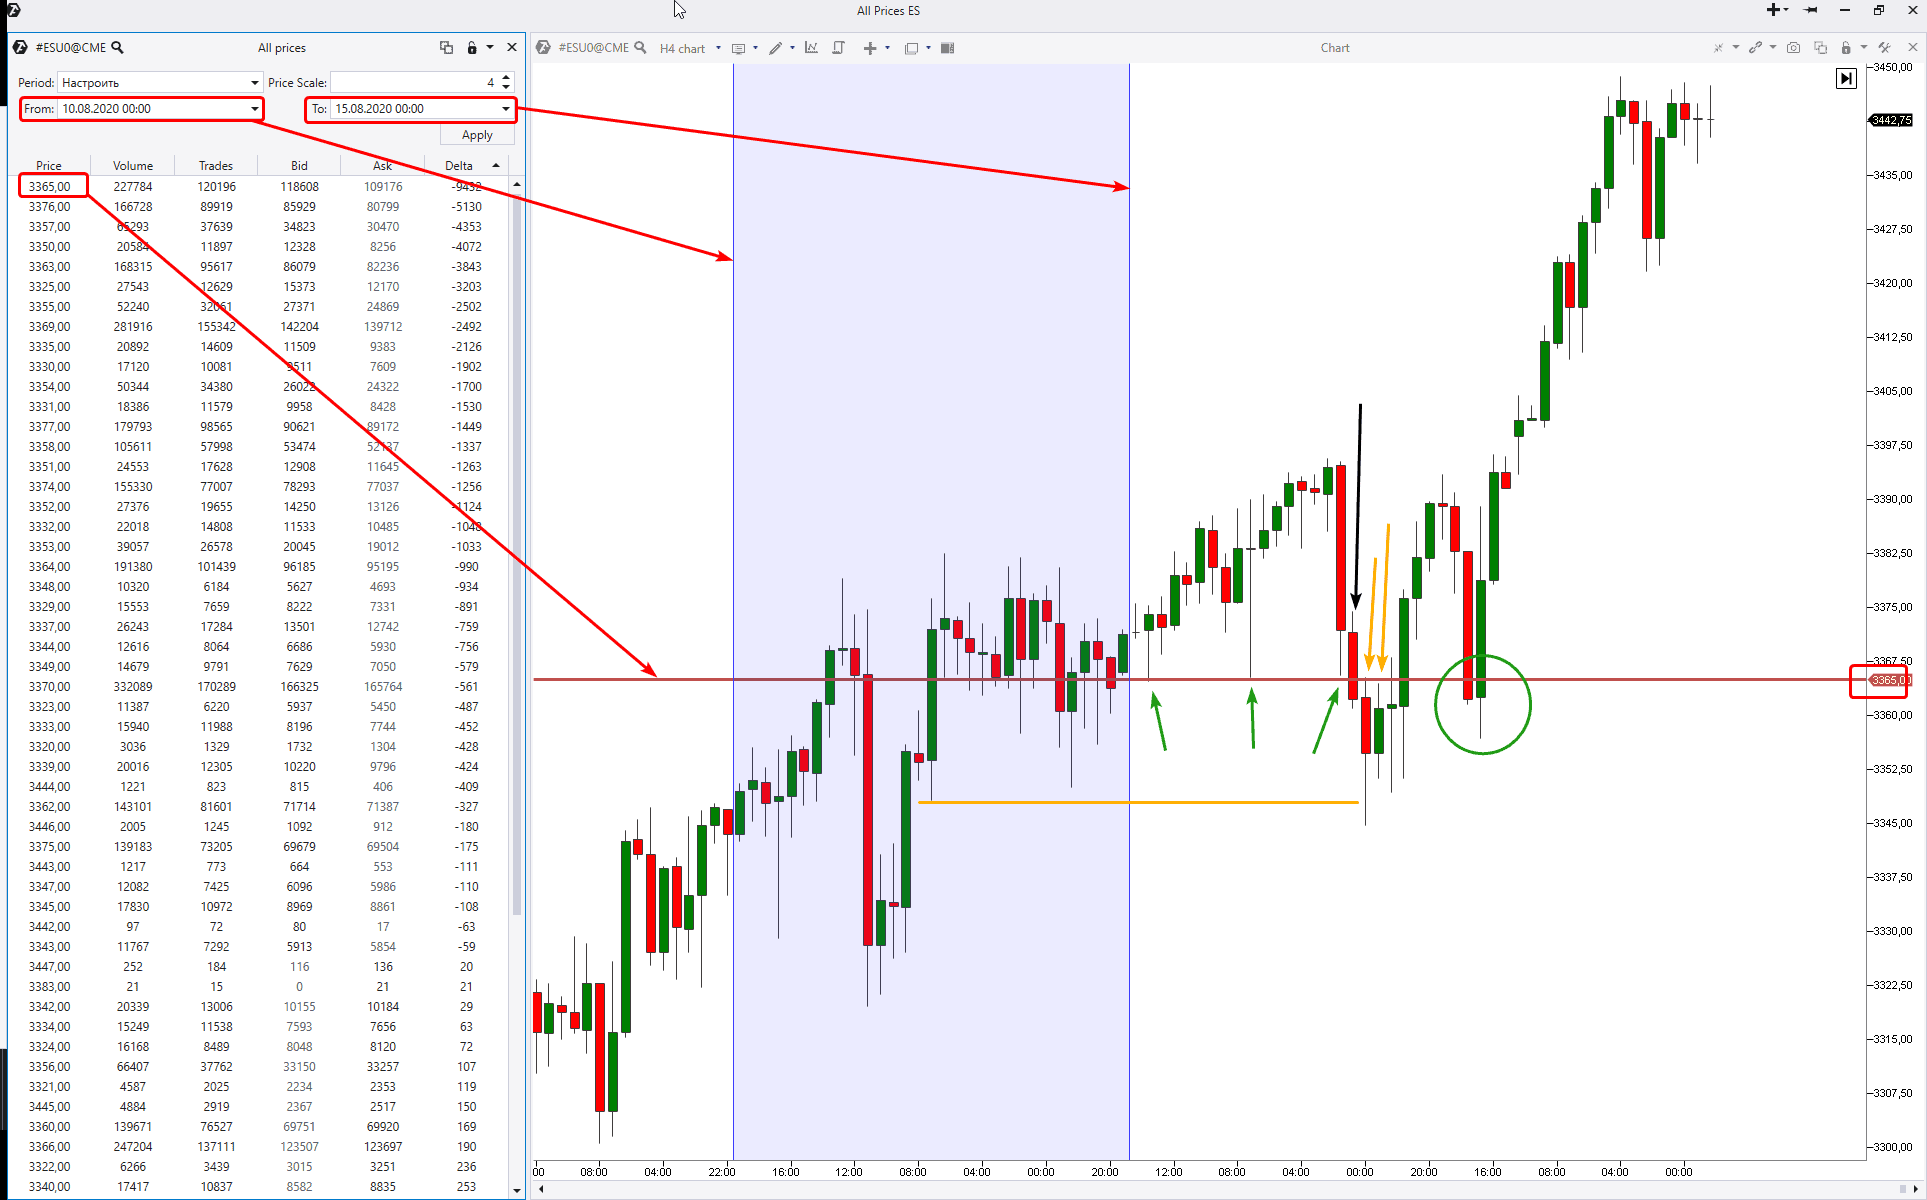
Let’s open the E-mini chart and defer the found level to the next week to see how the price would react to it.
Red arrows show how the All Prices table data relate with the chart. Let’s track the price reaction to the 3365 level during the next week (from August 17 until August 21):
- We had 2 bullish bounces on Monday and Tuesday. The first two green arrows point to them. Besides, the level worked out very clearly.
- On Wednesday, things developed as follows. First, there was one more bounce (the third green arrow points to the candle shadow). Then there was a bearish breakout (black arrow). And, in accordance with the classics of technical analysis, the broken support level started to work as resistance (two yellow arrows point to it).
- Most probably, the goal of the down movement was activation of buyers’ stop losses, hidden under local lows of the previous week’s Wednesday-Friday (yellow line). The market reversed upwards after the goal was achieved.
- On Friday, August 21, we observed one more case of interaction (green circle) of the price and the built 3365 level. However, this interaction is not so clearly expressed. Most probably, the level lost its significance by the end of the week. And the goal of the Friday reduction was, most likely, testing of the trading range maximum volume, which was formed at the week’s low on August 20 (between the yellow arrows and yellow level).
The price sharply went up during the week, which started on Monday, August 24. And if you build levels with an extreme Delta, using the August 17 – August 21 week data, you will have to wait until (and if) the market comes back to them. Then you can switch to a shorter time-frame in order to look for confirmation and the entry point.
One more example
We’ve just built levels by the maximum negative Delta for a period. Let’s do the same for the maximum positive difference between Ask and Bid (what Ask and Bid are).
Let’s consider an example for the gold futures. The data are from the Moscow Exchange.
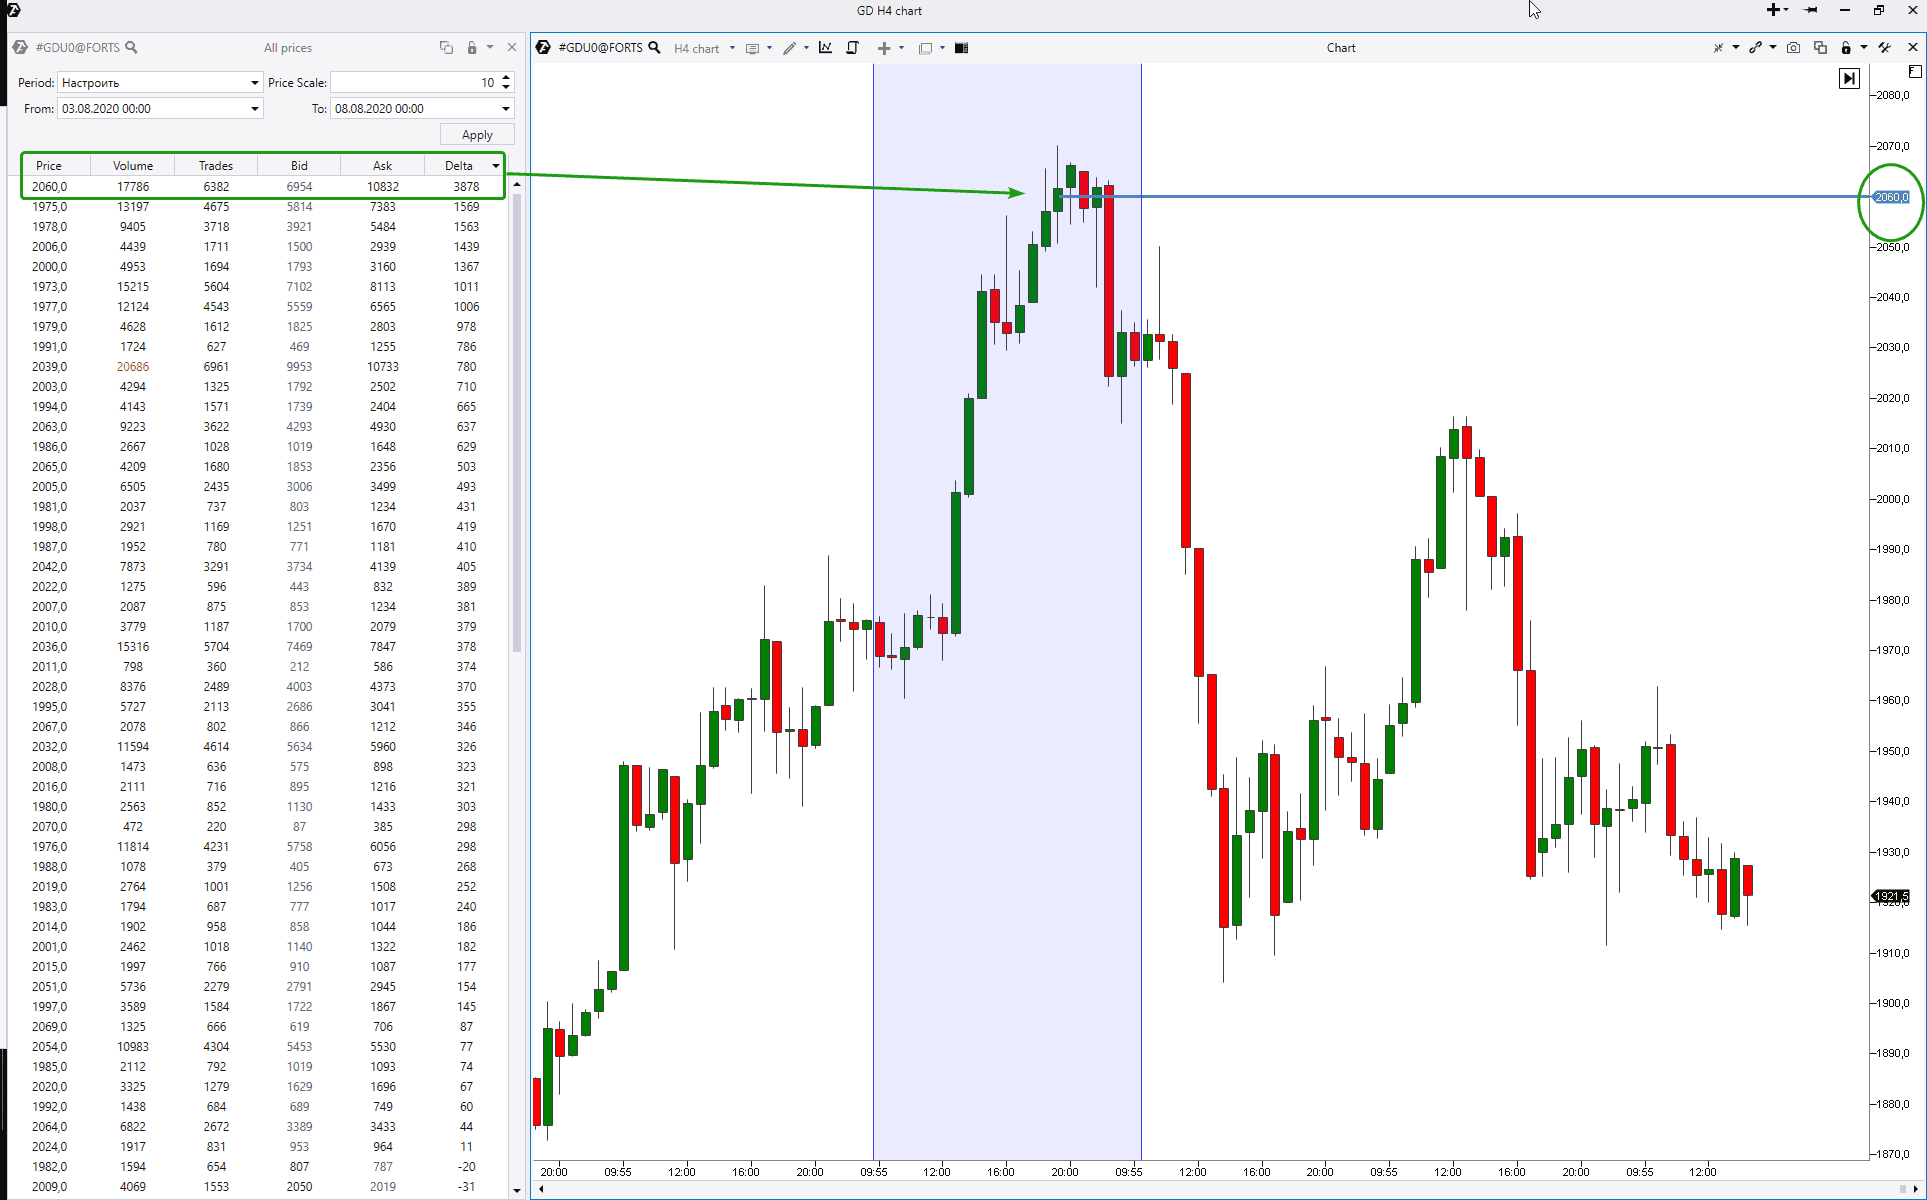
The All Prices table shows data about the course of trades for the period, which is marked in the chart as a violet area (the week from August 3 until August 8). The information is sorted out by the Delta starting from the maximum value. So, what so significant do we see?
Note that the first row has the value of plus 3878 contracts. More than two times bigger than the second row value. It is a very big gap! What does it mean?
Perhaps, serious sellers entered the market after a significant growth of the precious metal price. They posted a ‘rock-solid ceiling’ of limit sell orders at the level of USD 2,060 per ounce. As a consequence, the uptrend ‘bumped into the brick wall’ and the bullish process slowed down and exhausted. Thus, the sellers, meeting the market buy orders, formed a massive short position (closed the long one) before the subsequent reduction.
What lesson can we derive from this example? When you analyse the All Prices table data, you can not only find support and resistance levels, but also identify significant market extreme points.
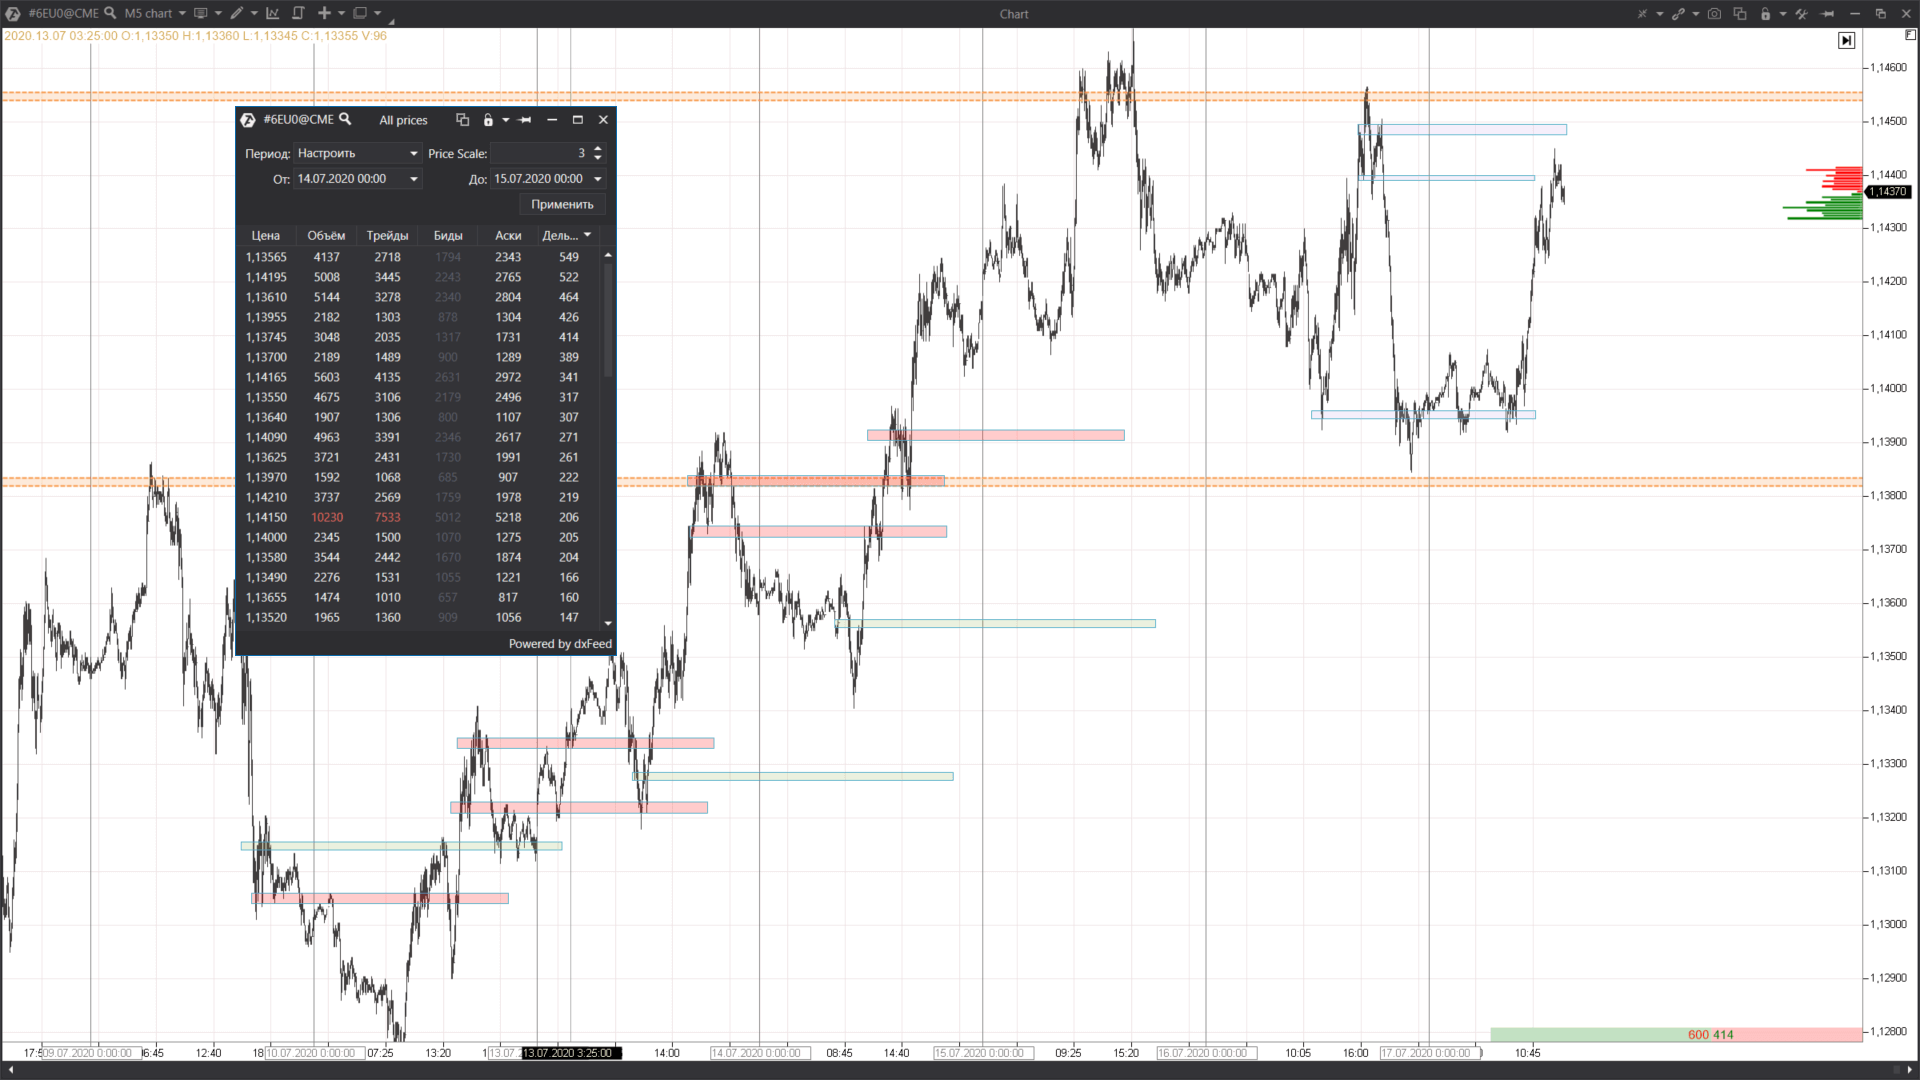
The next example in the EUR futures chart shows building the levels with the extreme Delta for the day period.
The algorithm in this case is as follows:
- you open All Prices for the previous day;
- sort out the data by the Delta;
- defer the levels with the maximum positive and maximum negative Delta one day ahead;
- continue the most significant Delta overbalances in the chart for a longer period than one day;
- focus on the market action during the working day when the price approaches the delayed levels in order (using additional indications on shorter time-frames) to find the optimum entry point.
Conclusions
The described method could be applied in any market available in the ATAS platform.
Of course, you can say that the Market Profile in the Delta mode could do the same. However, let every person use that instrument, which fits him or her better.
If you found the All Prices module interesting, download ATAS and check how the levels, built by the described method, work in the markets you selected.

