Analysis during the 2020 crisis: whether it’s time to buy stocks
Panic sellouts in the stock markets, caused by the global coronavirus outbreak, reduced the prices of the company stocks to the levels where they seem very attractive. “Is it time to buy stocks?” – this question is very urgent at the moment. Let’s try to analyze the situation.
Read in this article:
- What main specific features of fundamental analysis of stocks are during the 2020 crisis.
- How the market flooding with cheap liquidity from central banks would help to recover quotations after the crisis.
- What macroeconomic indicators would be the first to point to recovery of the global economy.
- We would also consider several practical recommendations regarding formation of a reasonable investment portfolio.
A famous quote of the legendary investor and one of the richest men on Earth Warren Buffett:
“We simply attempt to be fearful when others are greedy and to be greedy only when others are fearful”.
The guru of fundamental analysis is confident that a crisis is, perhaps, the best time for buying high quality assets cheap. However, a reasonable approach also assumes that our buys should not be caused by emotions. It’s true, a fast recovery of the market would help investors to get their 30-40% of profitability. However, in the event the process of recovery will take a long period of time, your portfolio may produce losses for several years. So, let’s be patient. Our simple recommendations would help you to approach the stock purchases reasonably.
What the crisis specific features are during the coronavirus pandemic
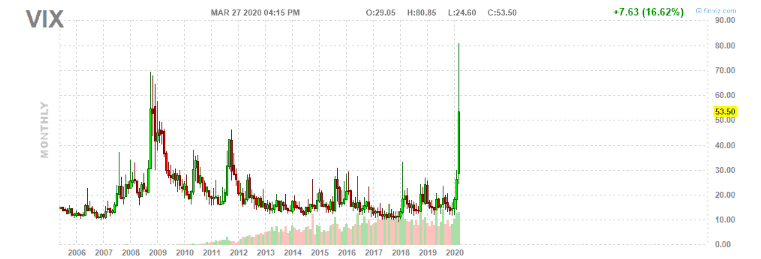
Fear and greed move the financial markets. When people all over the world fear for their own and their relatives’ life and health, it is very difficult not to be emotional when selling or buying stocks. The unprecedented volatility shows how emotional investors could be. The US stock market easily fell and skyrocketed by 10% and more during neighbouring sessions. Such moves were observed only a few times during the whole history. It is not a surprise that the VIX volatility indicator exceeded even the highs of 2008-2009 at its peaks.
When you form a portfolio, it makes sense to take into account several significant features, which make the application of fundamental analysis different during the 2020 crisis:
- A pandemic of the COVID-19 scale was observed for the last time more than 100 years ago. There are no relevant historic data to assess its potential impact on the market.
- The nature of the infection hasn’t yet been studied properly and the algorithm of fighting it is still being developed. It could well be that after the current epidemic dies down the world would face its new waves.
- According to the IMF forecasts, the world economy would experience the strongest fall after 2009. Some experts say that the GDP of the US and other developed countries may crash by 30-50%. The world has never experienced such crashes before.
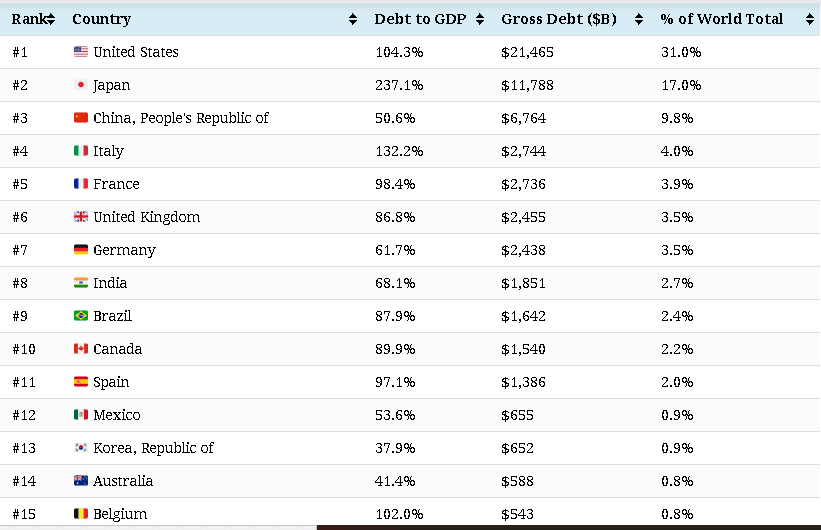
- The global debt level has significantly increased during the past decade, which creates a lot of risks of default of both the least financially stable companies and whole countries. The table below shows the largest debtors in the world.
So, the hurry in formation of an investment portfolio could only bring harm. There is a probability that the stock value would ‘stick’ at the March-April levels during the whole 2020.
Nevertheless, some analysts (from the Goldman Sachs in particular) believe that the S&P 500 index would return back to the pre-crisis levels at the end of 2020 – beginning of 2021. Such a variant of development of events offers prospects of 30-40% profitability from the current levels. Let’s see what are the reasons for the cautious optimism?
Liquidity from FRS: how the crisis is flooded with money
Liquidity is the blood of the financial market. The more capitals, free from obligations, stay in the system, the faster recovery of the asset value could be expected.
Cautious optimism with respect to the stock market is caused by a fast and unprecedented (by scale) reaction of the US FRS and central banks of other developed countries in the fight with the deficit of liquidity.
We already know about the following measures as of the end of March:
- The US FRS decreased the discount rate from 1.5% to zero. An unlimited quantitative easing (QE) program was declared. It means that the ‘printing press’ works at full capacity and the system could receive, according to some estimates, up to USD 5 trillion through the purchase of bonds and other assets.
- ECB announced its QE for EUR 750 billion till the end of 2020.
- The People’s Bank of China reduced reserve requirements to the banks, which freed around CNY 550 billion (more than USD 77 billion).
- The Bank of England, Bank of Japan and other central banks announced their own programs of stimulation.
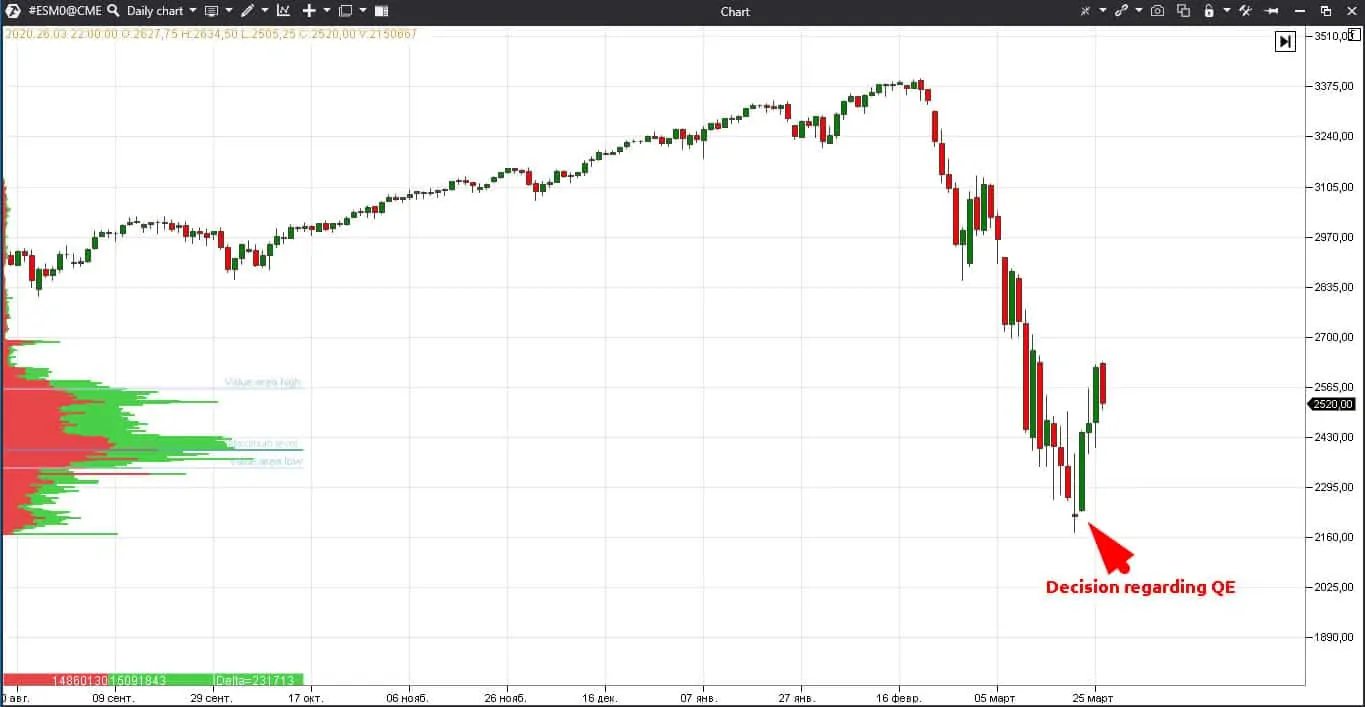
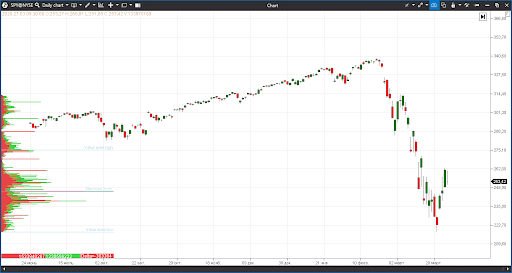
Injection of liquidity already helped the S&P 500 index to slow down (at least temporarily) the fall. We can observe the effect in the index futures chart:
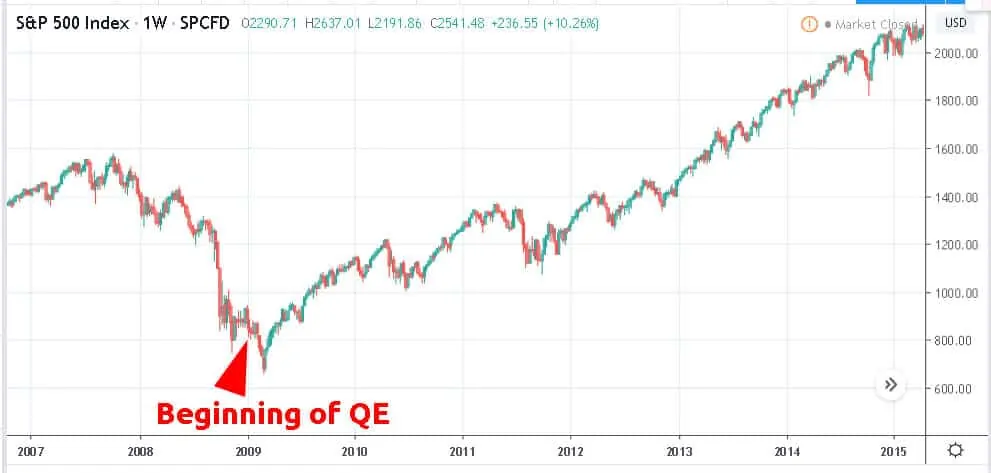
We want to remind you that FRS measures in 2008-2009 for fighting the crisis turned out to be efficient. Stock indices passed the bottom and started to show sustainable rates of growth several weeks after the launch of QE in the volume of USD 600 billion. Also the US economy started to recover. Programs of asset buyouts were prolonged in 2010 and 2012. In total, they lasted from the end of 2008 until the middle of 2014 and the asset buyout on the FRS balance reached USD 4.5 trillion. The S&P 500 index increased by 130% during that time. The growth lasted until February 2020.
The ECB, Bank of England and Bank of Japan undertook similar measures supporting the local markets until 2020. Due to this, the growth of indices in these countries and regions was also impressive.
Why it doesn’t make sense to buy before the global economic recovery
Despite the impressive results of stocks after QE programs in 2008-2014, investors need to remember that the asset buyout is not a guarantee of the market growth. It is just the basis of the foundation but not its only component.
The rate of recovery of the global economy from the crisis consequences will play even a more important role. People will just reduce the consumption activity without reduction of unemployment. Without restoration of the sustainable demand on products and services the financial indicators of the companies would turn out to be disastrous which would lead to new waves of the exchange crash. That is why, fundamental analysis of stocks in 2020 shouldn’t be conducted out of context of the general state of things in the world economy.
What signs would point to the fact that the economy recovers
So, let’s move to the main subject of the article – how to understand that it’s time to buy. The first block, which we would assess, is the macroeconomic statistics.
We should note that the service and non-production industries, as a rule, take about two thirds of the GDP volume of the developed countries. A rich economy rests on three pillars: employment level, consumption activity and investments. And all these three factors are interconnected.
Any investor should have a calendar of macroeconomic statistics publications in a browser tab. Such widgets are available on many financial web-sites. Just search for the ‘calendar of economic statistics’.
As you can see in the above example, you can set filters in the widget, selecting the countries and level of statistics importance. It makes sense to monitor those markets where you plan to invest and the level of importance should be not less than the middle one.
As an example, let’s take the US economy statistics. Very important statistics is published there every Thursday on a quantity of initial jobless claims. The data were shocking on March 26, 2020, since the number of claims grew by 3 million!
This is an unprecedented event in the whole history of the United States, which once again underlines the destructive influence of the coronavirus pandemic on the economy. Expanded statistics is available on the investing.com web-site where you can check the dynamics of changes and make sure once again that the current developments are unprecedented.
You should also pay special attention to the Purchasing Managers’ Index (PMI) at the end of every month. It is an important leading indicator, which shows expectations of the business for the nearest future. The index is formed by means of surveys of opinions of entrepreneurs. PMI below 50 shows a high probability of the industry recession while above 50 – industry growth. The most important indicators for the US market is PMI in the service industry and composite index. As we can see from the data published on March 24, PMI in the service industry crashed from 49.4 to 39.1 points, which is much lower than expectations of economists at the level of 42 points.
The growth of the stock market would not be sustainable until the initial jobless claims and PMI indices start to show a sustainable improvement of the situation. It’s up to you whether to monitor other indicators on the general unemployment level and economic activity or not, since the majority of them are lagging indicators. We are more interested in the data, which show the situation changes in dynamics.
Specific features of formation of a post-crisis portfolio. Three life hacks
So, let’s imagine a situation when the world economy starts to recover after the crisis and it’s time to move to the most responsible part of our work – portfolio formation. We will give you several pieces of advice, which would help you in this activity.
Life hack number one. It is desirable to split the process into several stages. For example, you can form 25% of the portfolio after the first signs of stabilization of the economy, 25% – when the economy starts to recover and gradually buy another 25% in the course of further recovery of the economy. It is also useful to keep about 25% of your portfolio in cash in crisis situations. Of course, if using such an approach you would lose a part of a possible recovering growth, however, long-term success is more important for an investor. The main goal is to preserve the capital and opportunities for its increase will come.
Life hack number two. Buy index ETF instead of individual stocks. You need to spend months and even years of studying the market in order to become a successful investor. Buffett also had to work hard to become a billionaire, however, even his company doesn’t manage to exceed the S&P 500 index results every year. The majority of hedge funds lose to indices even in successful years let alone a crisis.
Due to this, it is useful for beginners to pay attention to ETF, which smooth down the volatility inherent in small portfolios of stocks, and, in the majority of cases, help to improve the financial result.
ETF is the Exchange-Traded Fund. For example, ETF – SPDR S&P 500 includes stocks from the leading American index.
Life hack number three. Use filters. Filters will significantly simplify your work if you decide to select stocks on your own. For example, the stock screener on the finviz.com web-site allows selecting securities by 29 fundamental analysis indicators, including such important ones as the company’s Price/Earnings (P/E) ratio, Earnings Per Share (EPS), Debt/Equity level, dividend yield and many others. Those who prefer technical analysis also can find useful filters here.
In the end, we want to repeat the main rule once again – the main task of an investor is to preserve the capital regardless of the crisis type. Something cheap may become cheaper and something expensive may become more expensive. Investors, who remember the 2008-2009 crisis and further market recovery during several years, learnt this lesson well.
Successful investments to you!
Information in this article cannot be perceived as a call for investing or buying/selling of any asset on the exchange. All situations, discussed in the article, are provided with the purpose of getting acquainted with the functionality and advantages of the ATAS platform.

