The history of emergence of COT reports
Many US farmers grew vegetables in big volumes during World War I in order to feed the army. Nobody of them insured the crop from not being purchased. The army just terminated the contracts when the war was over. Storage capacities were overfilled but farmers were left empty-handed.
That is why, in order to protect farmers, the Congress adopted a law in 1922 on grain futures. This law envisages that the Chicago Board Of Trade (CBOT) should publish reports on a number of open positions in grain futures. Speculative positions in this report were taken into account separately from the producer positions. Traders were against it, since they wanted to stay anonymous, but the law came into force. The monthly reporting became regular. Later, these reports were called Commitments Of Traders (COT) reports.
The practice of report publication was expanded in the course of time. On July 13, 1962, the Commodity Futures Statistics published the first COT report, in which 13 agricultural markets were covered.
COT reports today. Where to take them from?
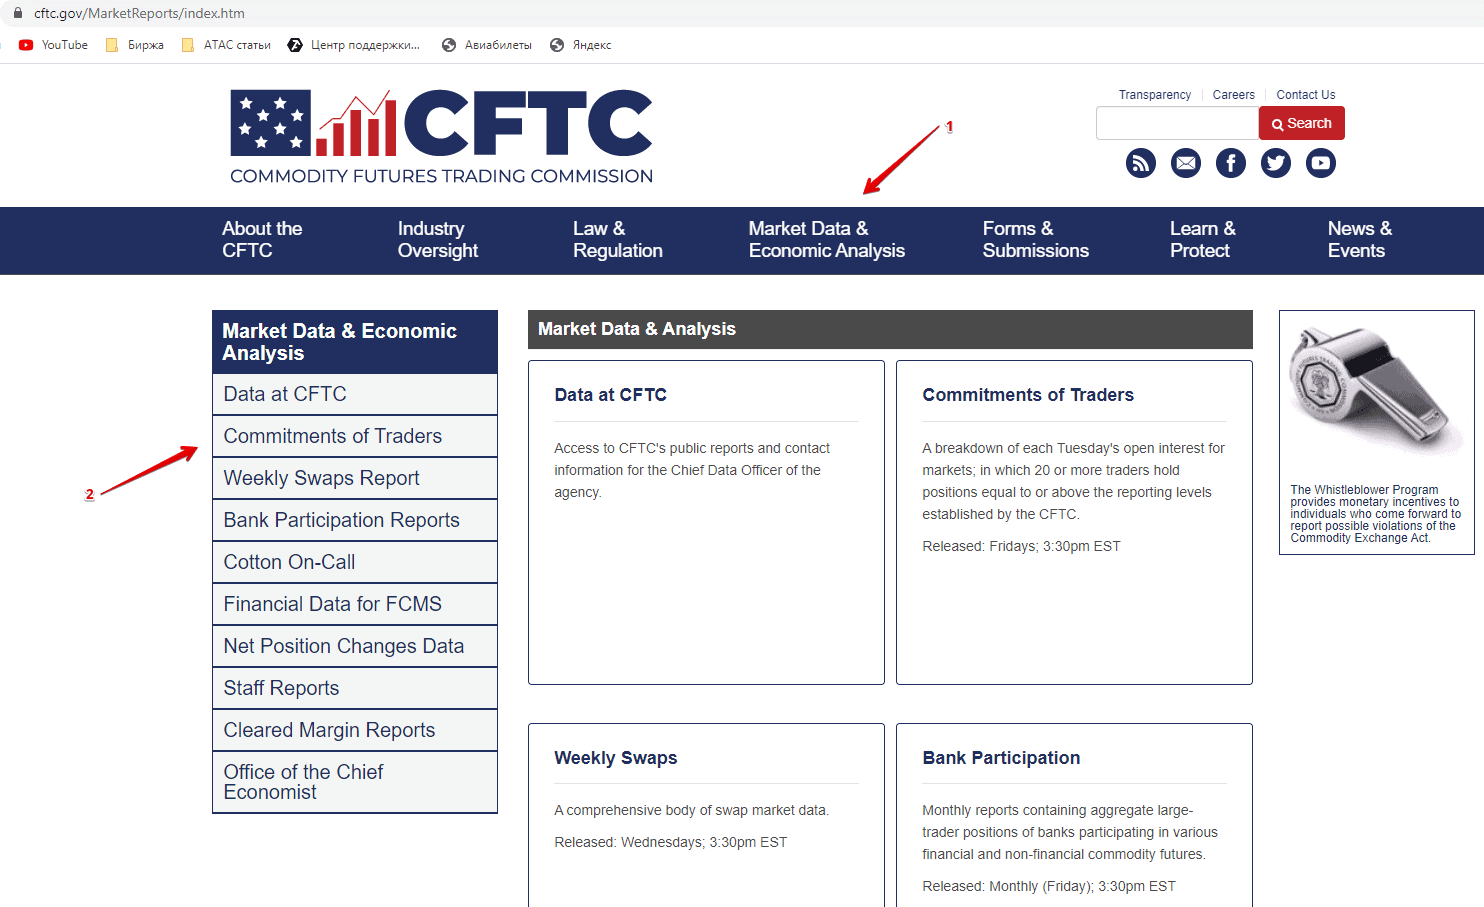
COT reports in their current weekly variant are published by the Commodity Futures Trading Commission (CFTC). The report contains data about Open Interest of several groups of major market players with a breakdown into long and short positions in futures and options contracts. These reports increase transparency of the forward market and level up chances of major and minor players.
Nowadays, these reports are published on Fridays but the data in them are from Tuesdays. See Picture 1.
There are 4 report types and 4 trader types.
We will not speak in detail about report types, because some traders use the final data and do not pay attention to the report type. While traders, who download data from the CFTC web-site for using them in their indicators, have strictly personal preferences. In general, the reports could be:
- complete;
- brief;
- on futures only;
- on futures and options.
We will speak about trader types in more detail. See Picture 2.
The division is the following for commodity futures:
- Major producers are the market participants who produce something and, as a rule, use forward markets for hedging. For example, confection producers will buy sugar if the prices on sugar moves down, because sugar is their primary product. Cheap primary products increase profits when readymade products are sold. Major hedgers, as a rule, work against the main trend. It looks as if they buy all the time when the price moves down and sell all the time when the price moves up. But this is not a strict rule and it works differently for different markets. Let’s note that major producers may also open speculative positions, but they are not obliged to report about their motives – CFTC doesn’t classify such positions.
- Swap dealers are also mainly hedgers, who work with swaps. This could be physical or legal persons, the swap turnover of whom or which is more than USD 8 billion.
- Managed money are major financial organisations, which trade on behalf of their customers. In fact, they are speculants. They trade by long-term trends.
- Other reportables are all other traders who didn’t get into one of the three previous categories. You should remember that if this group is in the report, it means that they also work with big money.
The classification is carried out by the commission staff on the basis of the data provided by traders. The classification may change after some time if a trader changes its main line of business. You can find detailed descriptions of all types of accountable traders on the CFTC web-site.
CFTC divides traders in the financial futures into:
-
- Dealers/intermediaries. These are intermediaries, for example, big banks, which make money on spreads, commission fees and arbitrage. They may play the role of market makers on exchanges. With certain reservations, the Commission refers them to the selling side. The other three groups represent the buying side. It doesn’t mean in reality that dealers only sell – they just play the role of intermediaries.
- Asset managers / Institutional traders. These are pension funds, insurance companies and mutual funds. They invest money for their customers.
- Hedge funds and Leveraged funds.
- Other reportables.
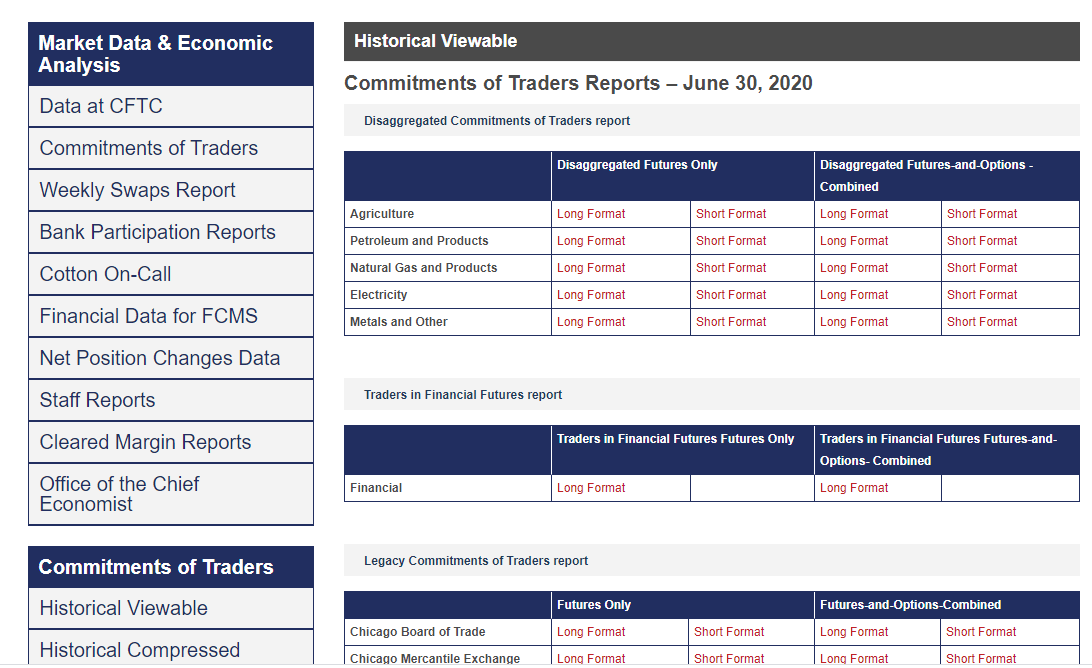
Brief reports show the open interest data of all above mentioned trader groups and changes, compared to the previous period. See Picture 3.
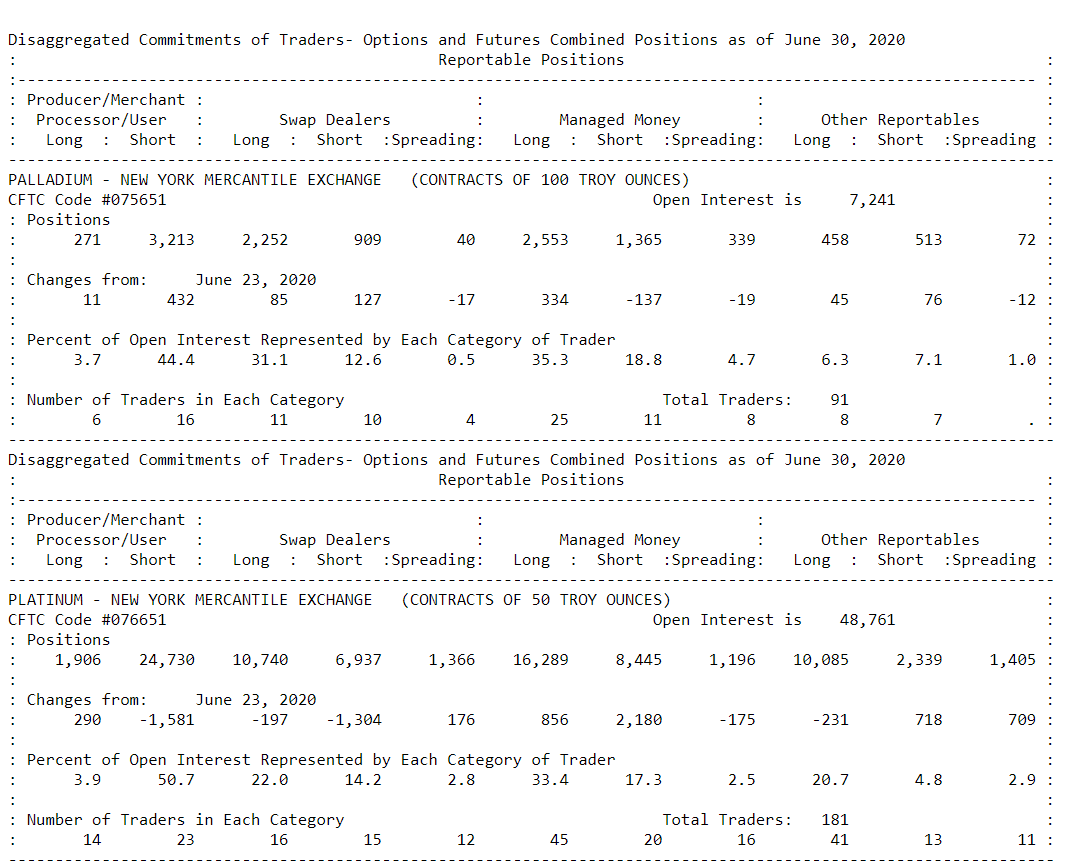
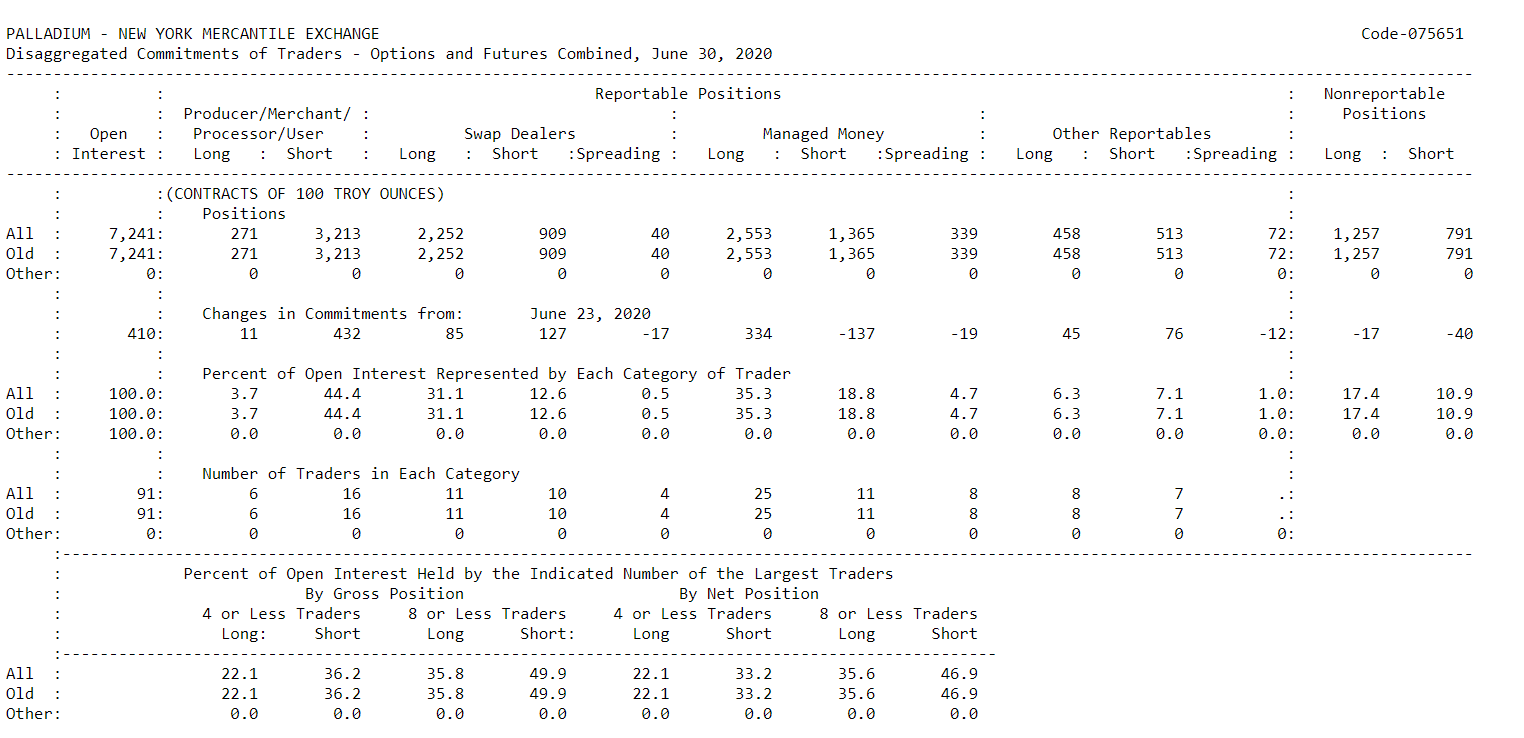
Complete reports separately show long and short positions of all trader groups and also position concentration of the biggest traders. Moreover, it is possible to view reports only by futures or by futures and options. See Picture 4.
Earlier, COT reports divided traders a bit differently. Traders were divided into commercial (producers and swap dealers) and non-commercial (managed money and other traders).
COT archive
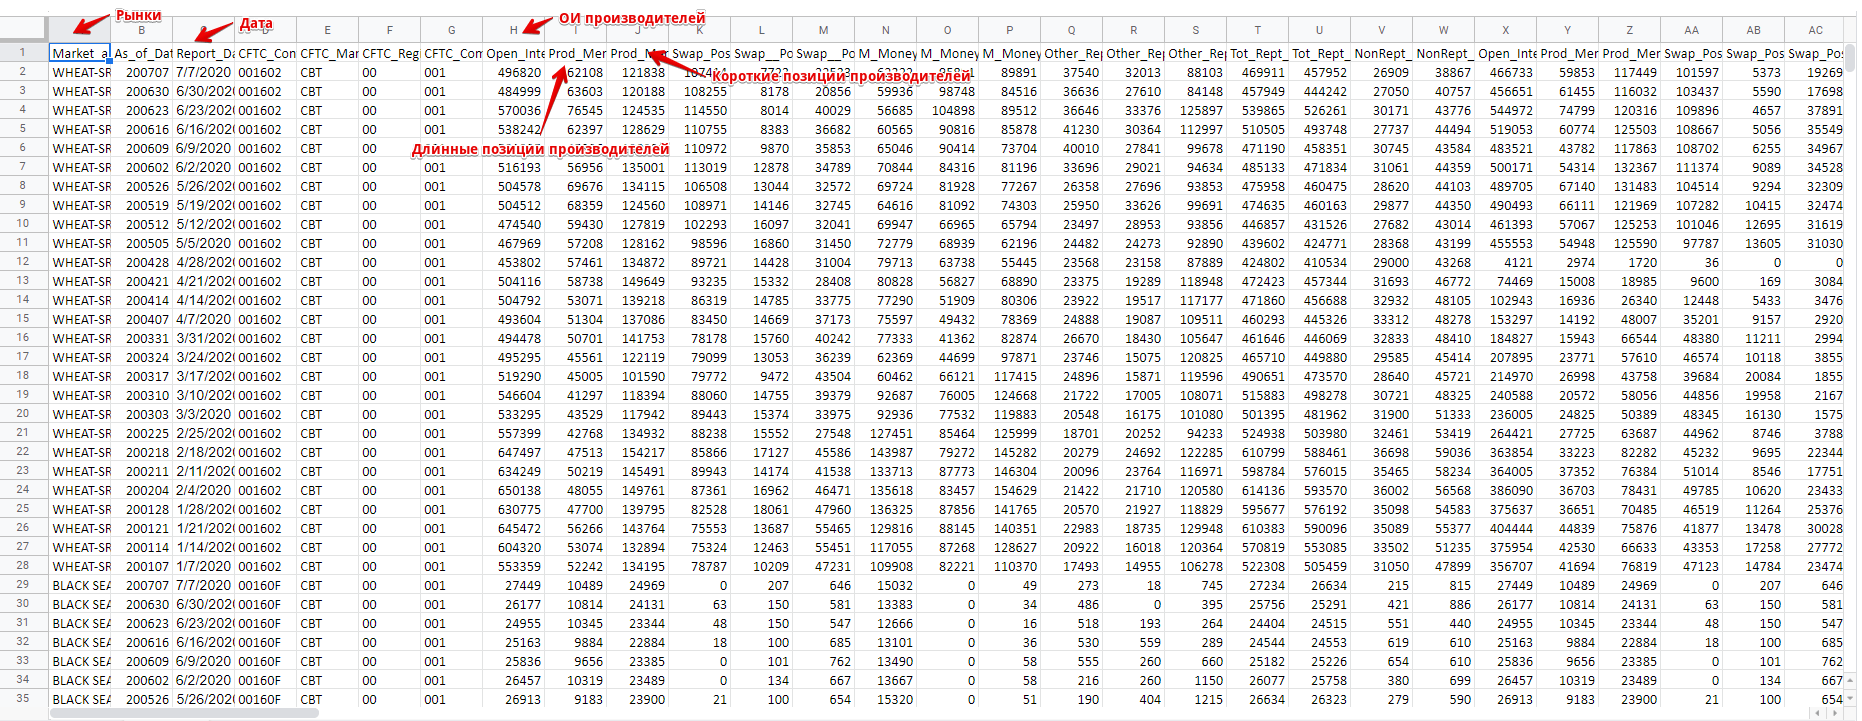
You can also download data from the CFTC web-site in the form of archived Excel files arranged by years.
For example, the complete report of futures and options contracts for the year 2020 looks as follows: See Picture 5.
Why these data are important
The reports show data about the Open Interest of the biggest traders. Open Interest (OI) is the data about open positions, which American exchanges show by the end of every trading session. OI changes ‘the money flow, which flows into the market or flows out of the market’. You can see from the report what exactly major players did – whether they increased long or short positions.
In the very general sense:
- significant OI levels show the market peaks;
- low OI levels show the market bottoms.
You should understand that this is not an absolute rule.
How to analyse COT reports
Let’s assume that we open the report and see that major producers increased the long gold net position. What does it mean? Should we also hurry and buy gold? Or vice versa – should we prepare for the market reversal? And, in general, what does a long net position mean and where does it come from?
You can find answers to these and other questions in the works of two most famous experts in COT data analysis:
- Larry Williams. He wrote the book ‘Trade Stocks and Commodities with the Insiders: Secrets of the COT Report’. He also has a webinar on this topic on his web-site.
- Stephen Briese. He wrote the book ‘The Commitments of Traders Bible. How To Profit from Insider Market Intelligence’. The book was published in 2008 and it contains detailed explanations of how to work with reports in various markets. The Briese web-site provides real-life charts with a customized indicator.
If you want to learn all details about analysis and trade opening on the basis of the trader commitment data, read at least one of these books. We will be able to discuss only the basic things within the framework of this article.
Example of COT report analysis
You can get the final data about open positions of different trader groups in the indicator format from various sources. For example, you can find them on website barchart
Let’s consider an example in the weekly Soybean Meal futures (ZM) chart. See Picture 6.
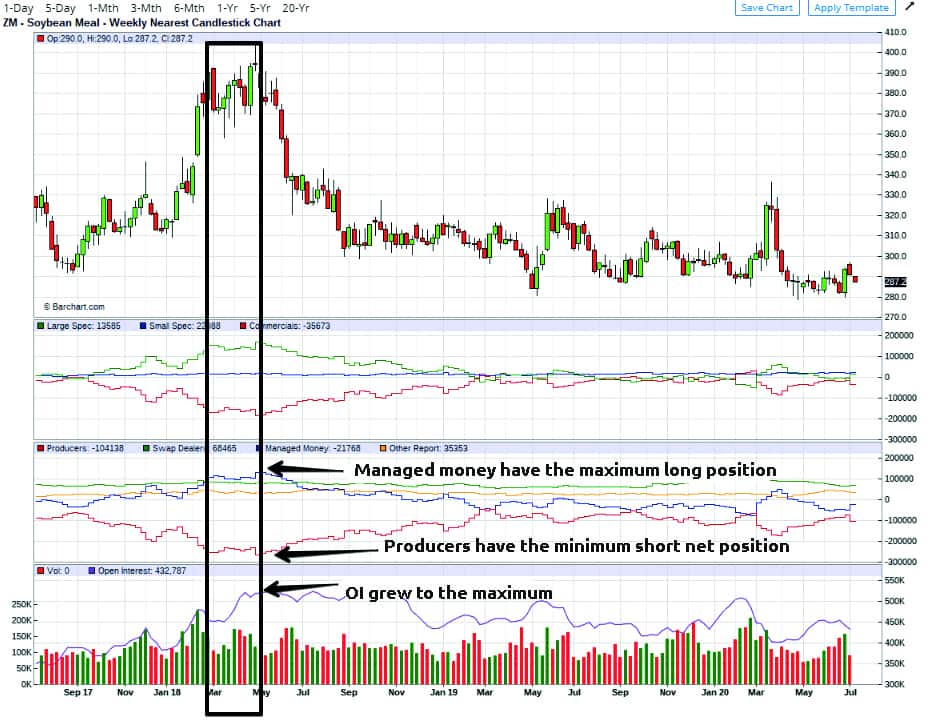
- The violet line over the volume chart is an aggregate Open Interest.
- The upper chart is the outdated COT report.
- Middle chart is the modern COT report.
- The red line is the producer OI and the blue line is the managed money OI.
Principles of Open Interest analysis
Main principles of various trader groups’ Open Interest analysis according to Stephen Briese:
- The red and blue lines move, as a rule, in opposite directions. When the red and blue lines move to opposite sides, there is a probability of the trend change, as a rule, in the producer’s favour. The prices started to fall in our example as soon as the producers’ positions reached the low.
- The managed money (blue line) as a rule buys when the prices grow and sells when the prices fall. Managed money creates trends. It could be compared with train operators who move uptrends and downtrends. The blue line more often moves with the price, however, sometimes correlation is impaired. Quite often the managed money finds itself in a big loss-making position during the market trend reversal.
- Producers (red line) change trends. Producers could be compared with switch operators who determine in what direction the train would move further.
These rules are not a fundamental truth. Even more than that, they better work in the physical markets. Briese, in his book, specified several misapprehensions, which traders face more often on the Internet:
- always follow producers. Producers have a lot of money and they can buy positions, which become cheaper, during several months and even years, that is why you cannot just blindly follow them;
- a long net position is a bullish sign, while a short net position is a bearish sign. Whether a position is long or short makes no much difference. The position change with respect to the previous period is much more important. For example, producers were in a short net gold position as of the end of July 2020 and the same was at the end of May and the end of April. But it doesn’t mean at all that the gold price started to fall;
- always act against minor speculators. We already discussed that everything depends on markets. For example, there are no producers in the bitcoin futures. You may easily lose your deposit in no time if you blindly open trades against the ‘Others’ trader group;
- the report data become outdated before they are published. You will hardly be able to use COT reports for intraday trading. These data could be used for the global picture analysis and long-term trends;
- hedger positions could be compared only on the seasonal basis. This is only partially true because, nowadays, even farmers can grow their products the year round.
Practical application
As we already mentioned above, not the report numbers are important by themselves but their change is, compared to previous numbers.
Williams and Briese use one indicator for data comparison, which is called the COT Index. Here’s a formula, by which any trader may independently calculate the indicator in Excel having downloaded data from the CFTC web-site. See Picture 7.
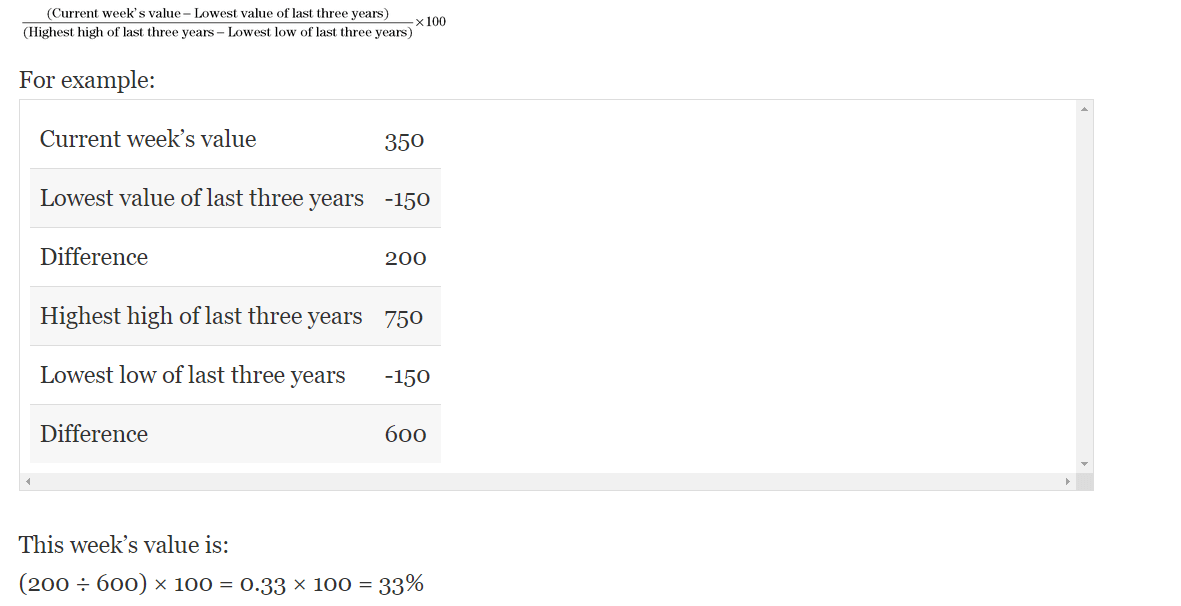
The goal of this indicator is to help an analyst to determine how strong bullish or bearish positions, taken by producers with respect to their high and low positions for a certain period of time, are. You can use any period – 3 years, 1 year or 26 weeks. Williams, at first, used 3 years and then he started to use 26 weeks.
The indicator DOESN’T show the exact time of entering into a position. It just warns that managed money started dynamic actions. It may help to ‘catch’ the big trend beginning. Ideally, the signal for opening long positions emerges when producers buy on the growing trend.
Example of COT Index analysis
Let’s consider a COT Index example for the S&P 500 futures. See Picture 8.
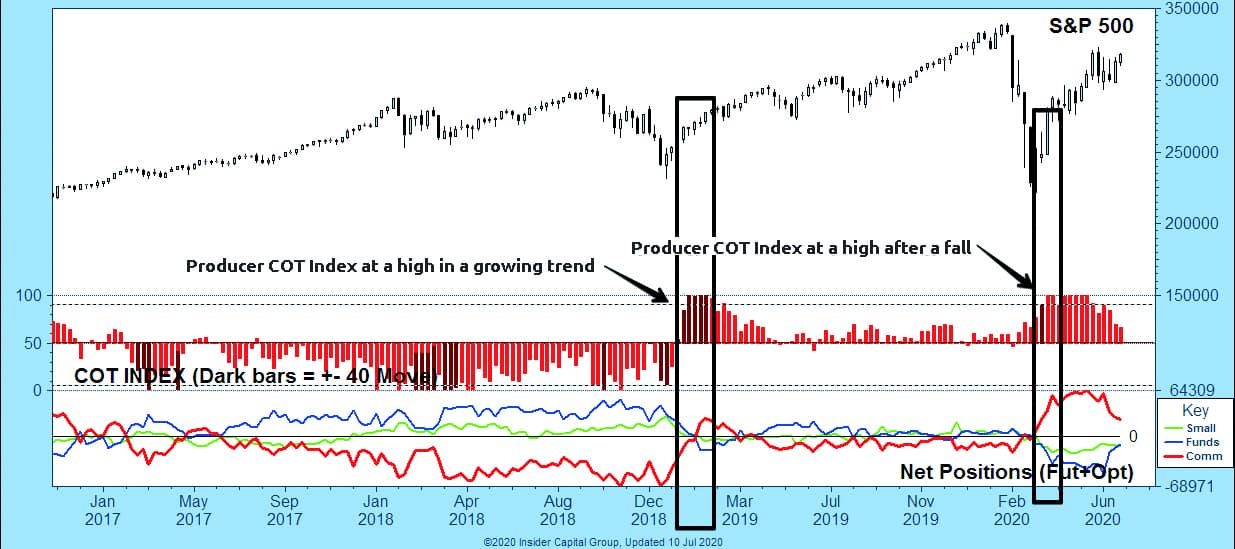
The indicator operates differently from the net Open Interest chart!
- For the buy signal: COT Index should be higher than 90% (higher than 95% will be even better) for the selected period of time.
- For the sell signal: the Index should be lower than 10%.
The current trend should be taken into account when working with the indicator:
- In the ranges, producers buy on peaks and sell in valleys. Thus, it is possible to find support and resistance levels, which are significant for this trader group.
- In the uptrend, it makes sense to pay attention to the buy signals, because the sell signals are, as a rule, premature and there are quite a lot of them. In strong bullish markets: sell signals, which are not followed by a price fall, confirm strength of the uptrend. Here we can compare the COT Index with the technical analysis oscillators, which are constantly in the overbought area in the trend markets, but this is not a sell signal.
- It is the opposite in the downtrend – you should pay attention to the sell signals. Buy signals during a downtrend, as a rule, show small bounces, which only confirm the bearish trend strength.
It is possible to identify peaks and valleys (and also reversal patterns of technical analysis – for example, ‘head and shoulders’) by the COT Index splashes.
Customized developments for COT analysis
Briese added one more marker to the Index – the Movement Index. It marks darker bars in the chart. If the COT Index changes by +/-40% during 6 weeks, the bars are highlighted with a darker colour. The movement in +/-40 points during the uptrend or downtrend retracement often shows the rollback completion and the main trend renewal. If the trend doesn’t renew after the signal, it means that the trend change is possible.
Larry Williams works with his Willco a bit differently:
- It finds the market where producers take long positions and minor speculators take a short position.
- It waits for a trend change signal.
- It selects an entry point in daily charts.
Is there any analog of COT reports for the Moscow Exchange?
These data are not available on the Moscow Exchange, but there is a breakdown into legal and physical persons by every futures and options contract.
We built the COT Index of legal and physical persons for the Moscow Exchange index futures, using these data. Since the Moscow Exchange shows the data every day, we calculated highs and lows for 22 days – it is approximately 1 trading month. See Picture 10.
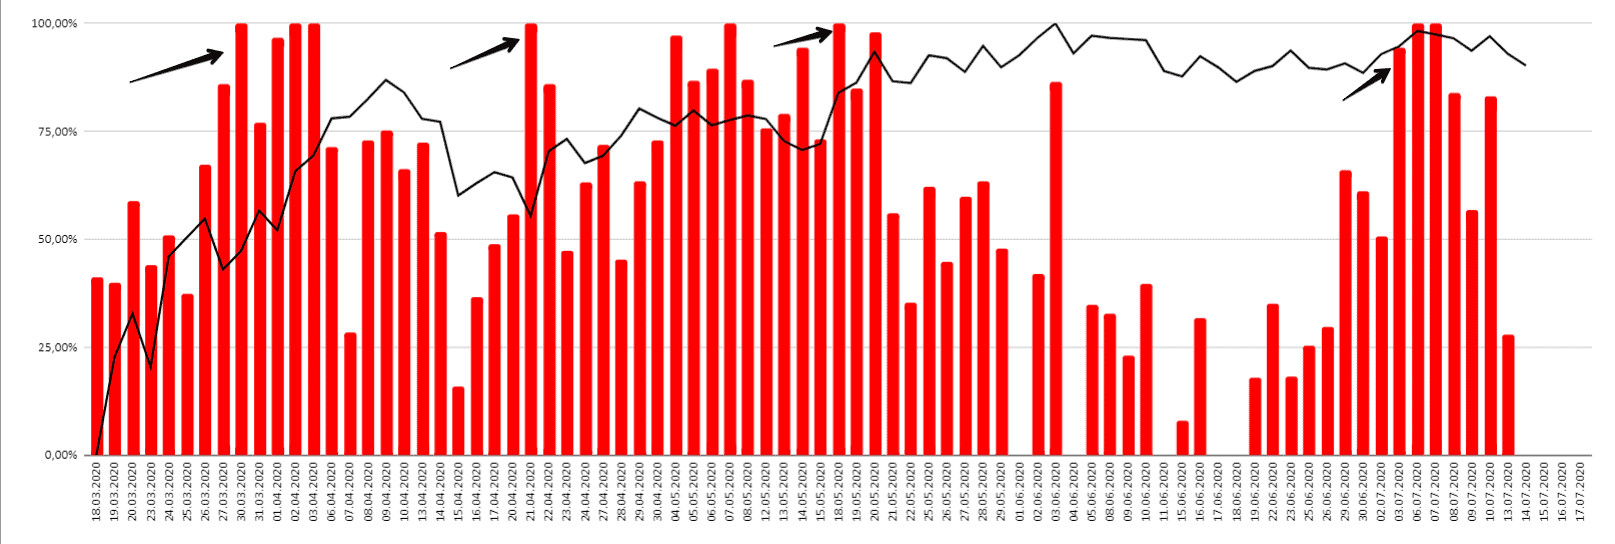
We marked with black arrows those dates when the price started to grow after the maximum legal person index value.
Conclusions
The trader commitment data are a unique instrument, which you can find only in the American markets. Long-term traders may forecast a change of trends and move together with big money.
Stephen Briese has been sending a weekly newsletter for 20 years already. It looks like this: See Picture 9.
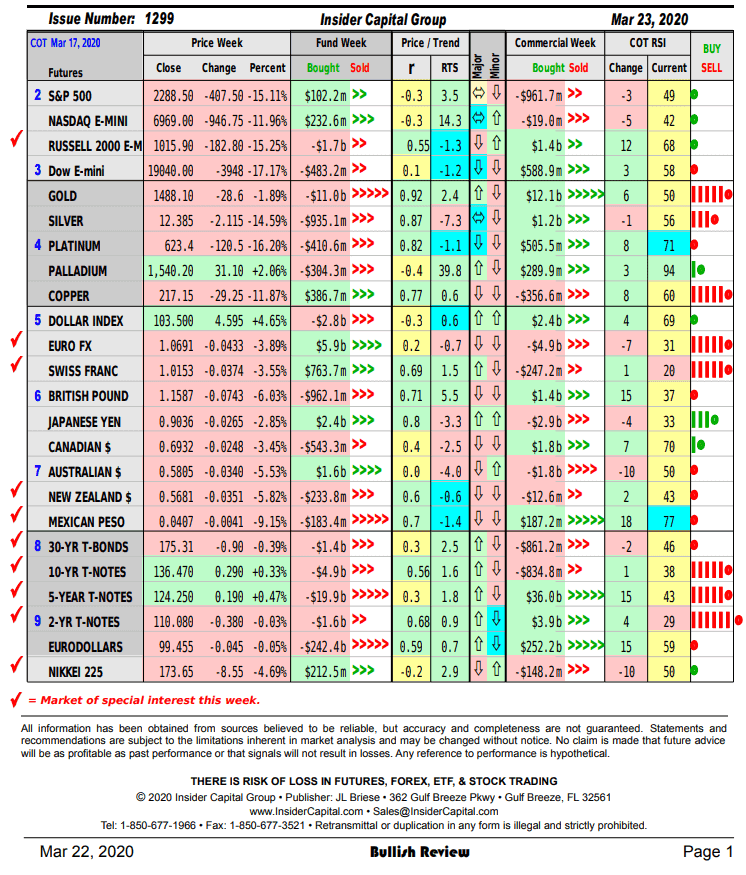
It goes without saying that this instrument doesn’t guarantee a decent result in 100% of cases, but you may take into account his data in your trading strategy.
Did you like the subject? We also recommend you to read the article How to read CME broker reports.