What a reversal pattern is and what reversal forms could be
A reversal is a change of the financial instrument trend.If there was an uptrend in the market, the price starts to go down after a reversal. And vice versa – reversal of the bearish trend results in the price growth.
As a rule, the global trend changes when the price reverses on daily, weekly or monthly time-frames. Reversals on smaller time-frames are usually called rollbacks or retracements. Reversal patterns in trading start with rollbacks and it is impossible to determine with the 100% guarantee what happens with prices next.
Reversals may take place several times a day if the day doesn’t develop as a trend one. However, intraday reversal patterns are not of big significance for position traders, because a more global picture is important for them. As regards scalpers, weekly chart reversals have no significance to them because they work only during a day.
Reversal patterns could be:
- in the form of the letter ‘V’ – they take place quickly and sharply;
- in the form of the letter ‘W’ – a reversal takes place quickly but then the price comes back to minimum levels and tests them. Such reversals are called ‘the double bottom’;
- in the form of the letter ‘U’ – reversals are slow. ‘Managed money’ accumulate or discharge positions during such reversal patterns.
Why it is profitable to trade reversals
As a rule, the risk is limited with the low or high when trading reversals and the movement potential is much bigger than the risk size. However, reversal patterns often complete formation so fast, that traders fail to enter when prices are attractive. From the psychological point of view, trading reversal patterns is clear and doesn’t cause psychological difficulties, because it is natural to buy at lows and sell at highs.Reversal patterns could be identified visually by candlestick charts or by chart patterns. It would have been easy and profitable to trade reversals if it were possible for traders to identify them. However, reversals take place quickly and also they are accompanied with many false signals.
Reversal candlestick patterns. European and American traders started to work with Japanese candles after the publication of Steve Nison’s books ‘Beyond Candlesticks’ and ‘Japanese Candlestick Charting Techniques’.
Nison writes that the dominating trend doesn’t end immediately and sharply. That is why it would be more correct to call the reversal patterns of Japanese candles the trend change patterns. There are much more such patterns than the patterns of trend continuation. If reversal patterns appear, Nison recommends to close the current positions rather than open positions that are opposite to the trend.
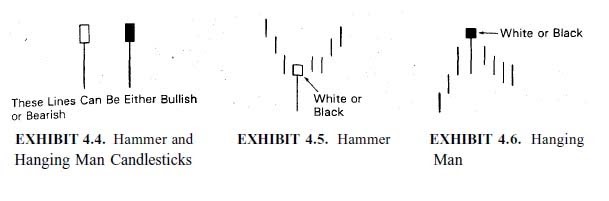
The most famous candlestick patterns are ‘hammer’ and ‘hanging man’. These are individual candles, which tell us about the market player mood changes. Candles cannot be analysed outside the context and it is very important to take into account after what trend they appear and what happens next. See Picture 1.
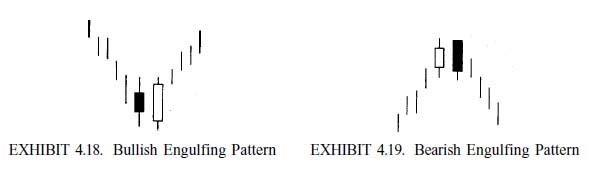
Apart from individual candles, there are reversal patterns that consist of a set of candles – for example, ‘engulfing’, ‘dark-cloud cover’, ‘piercing’ and ‘harami’. A set of candles is more significant than individual candles. See Picture 2.
As a rule, reversal patterns of Japanese candles should be additionally confirmed. Confirmation could be conducted by technical analysis indicators and oscillators, for example, envelopes, Bollinger Bands, RSI, and Stochastic.
Chart reversal patterns are repeated chart patterns, which reflect the market player behaviour. Thomas Bulkowski collected chart patterns in the ‘Encyclopedia of Chart Patterns’. It is a multi-page reference book where you can find description and statistics of practically all patterns. You can also find a separate article on this subject in our blog.
Bulkowski writes that chart patterns send clear signals to buy or sell, you just need to patiently wait until they are formed. The most famous reversal patterns are ‘head and shoulders’ and ‘inverted head and shoulders’ and also different variants of peaks and valleys.
Let’s consider examples of ‘bad’ and ‘good’ trades on the basis of a reversed pattern, which Bulkowski calls ‘big M’. Bulkowski provides statistics by time and percent price change before reversal formation for all examples. See Picture 3.
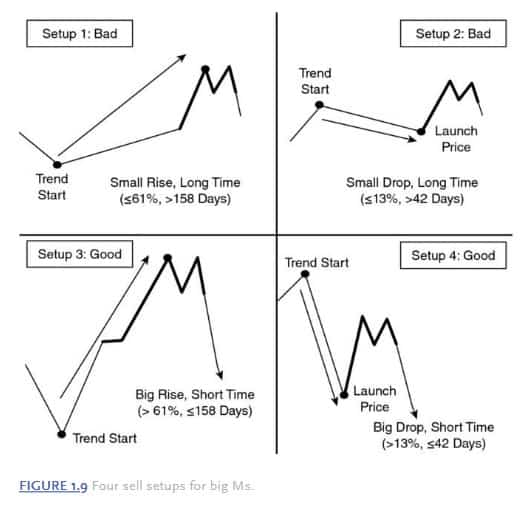
Second example: the trend starts with a small rollback, which lasts rather long. A significant breakthrough is also hardly possible after such a development.
Third example: an explosive and sharp growth during a short period of time could potentially result in a significant breakthrough.
Fourth example: there is a small bounce after a significant price fall – it looks like the fall would continue further on.
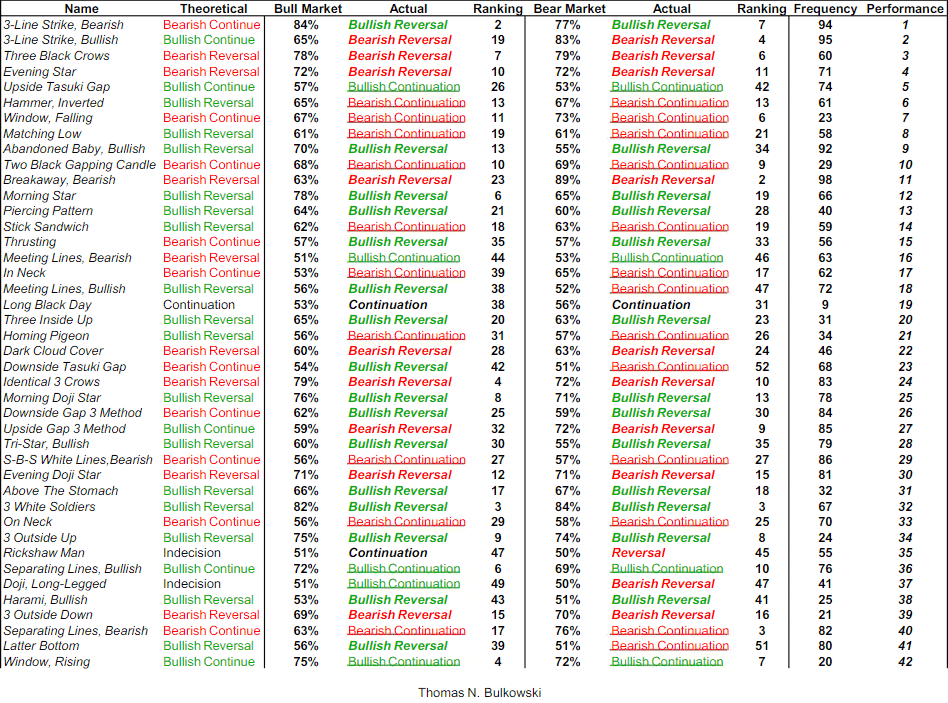
Here’s the statistics of activation of chart patterns in various markets from Bulkowski’s book. See Picture 4.
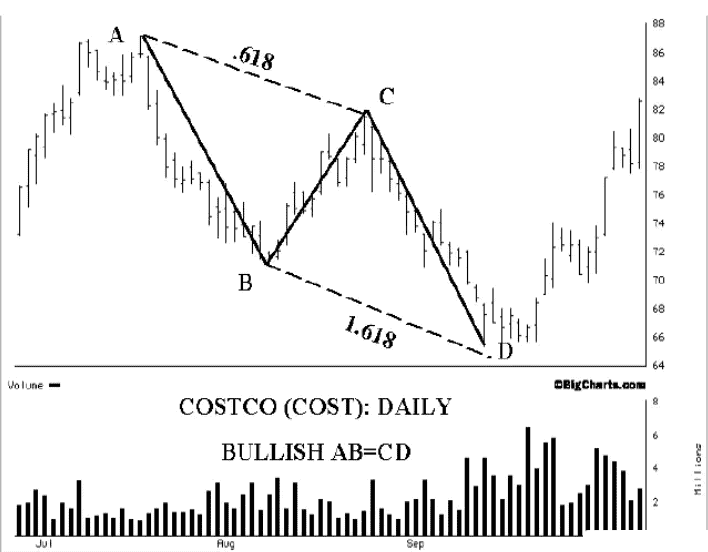
Harmonic reversal patterns in trading forecast reversals on the basis of Fibonacci retracement levels. In order to specify patterns in the chart, traders, first, identify 4 points – for example, the trend’s beginning, retracement, continuation and final movement. After that they identify the 5th point depending on the pattern obtained and previous point values. The most famous patterns are ‘butterfly’, ‘shark’ and ‘bat’.
The first one who spoke about harmonic patterns was Harold M. Gartley in his book ‘Profits in the Stock Market’, however, the biggest number of patterns and descriptions could be found in the Scott Carney book ‘Harmonic Trading’. By the way, Fibonacci numbers could be used separately from harmonic patterns in order to set possible reversal levels. See Picture 5.
Signs Of Strength (SOS) and Signs Of Weakness (SOW) from VSA also warn traders about possible reversals. Unlike reversal patterns of Japanese candles, traders in VSA additionally analyse the volume and price bar ranges. Tom Williams is considered to be the VSA author.
When a trend changes in the market and a reversal is formed, climax actions take place. At this time, financial assets pass from ‘managed money’ to amateurs and vice versa. The buying climax pattern takes place at the price high, while selling climax takes place at the price low.
Let’s consider an example using the daily PAO VTB stock chart. See Picture 6.
The marked candle volume is three times bigger than the previous days’ volumes. The candle itself is long and closes near the high. We may assume that the buys gain strength. However, if we look at the tape, we will see that it is not quite so.
In order to see only trades with more than 10,000 shares, we filtered out the Smart Tape. We marked the biggest buy with the yellow rectangle – it was in the first half of the day. This buy moved the price only 1 tick high – one “+” near the amount. Perhaps, big limit sells were at this level. Market sells appear in the second half of the day. The price starts to move down the next day. We marked green candles of small volume with the black rectangle – nobody wanted to buy.
Selling and buying climax is just one example of a reversal pattern in VSA. Read a series of articles on this subject in our blog for additional information.
Search for reversal patterns with the help of Footprint
Imbalances at extreme points could also lead to a reversal. You can see imbalances in the Footprint charts in real time. In fact, imbalance is a multiple excess of demand over supply or vice versa. If market sell orders cannot move the price lower, it means that there are bigger limit buy orders on their way. The price would either stop or reverse in this case.
When traders get stuck in loss-making positions, they start to close them with opposite trades. For example, if sellers with loss-making short positions get stuck at the local day’s low, they will buy in order to close their positions, that is why the price would grow.
Let’s consider the 5-minute Ebay stock chart. We added the VWAP indicator to the chart with a monthly period, which means that our VWAP shows the average stock price, weighted by volume, for a month. The price was above VWAP in May, which means that it was an uptrend and buyers were strong. And the VWAP line itself could be considered as the support level. See Picture 7.
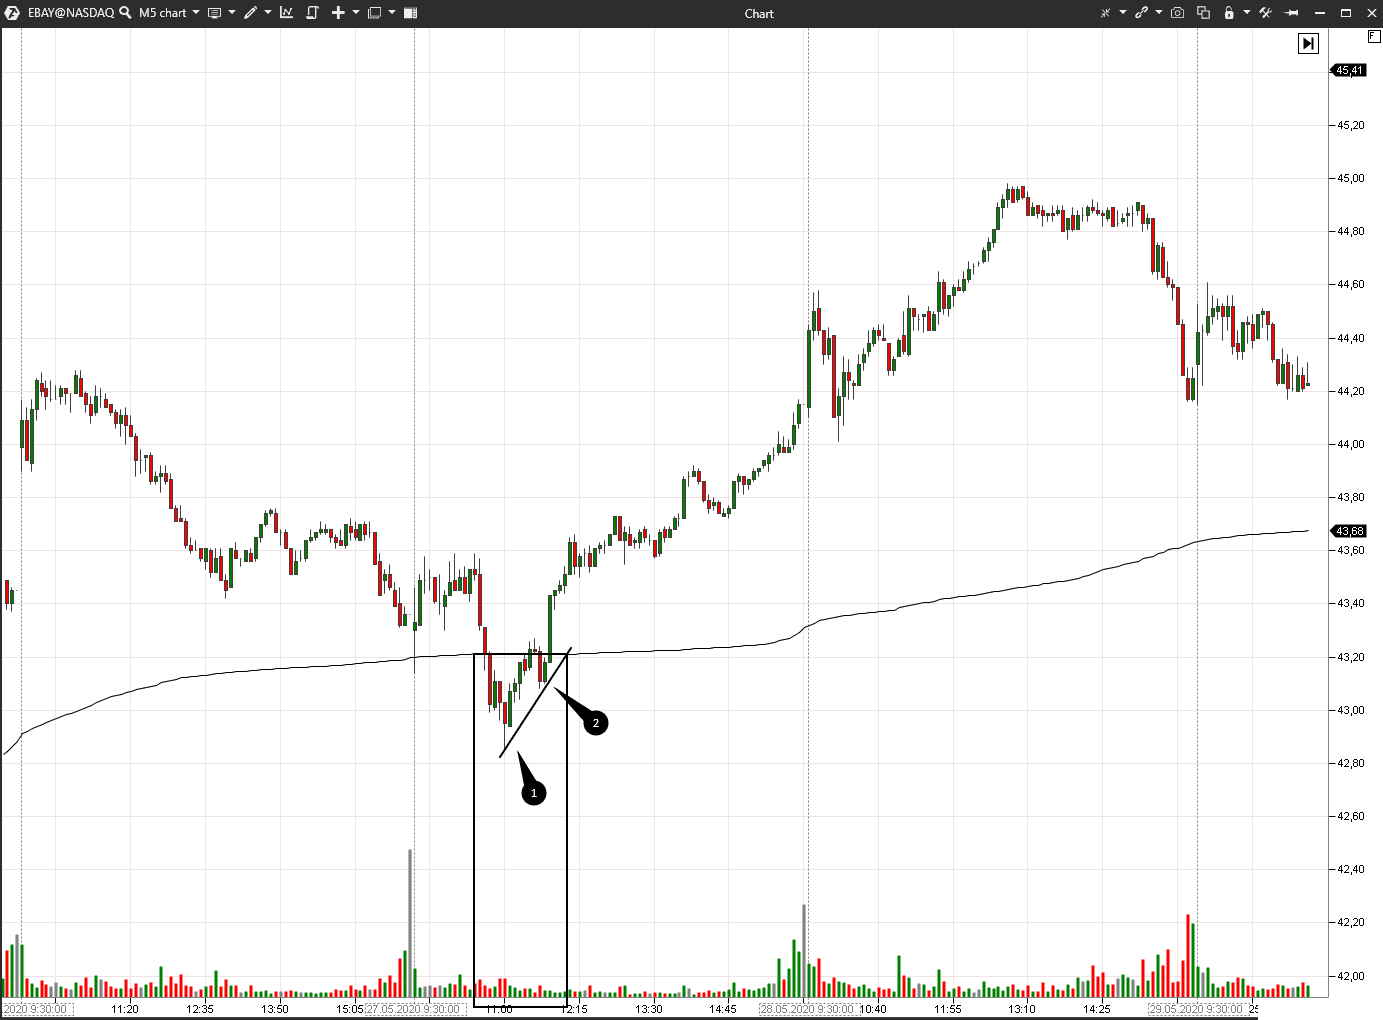
Now, let’s have a look at the marked reversal candlestick pattern in the detailed Footprint chart with 400% imbalance. See Picture 8.
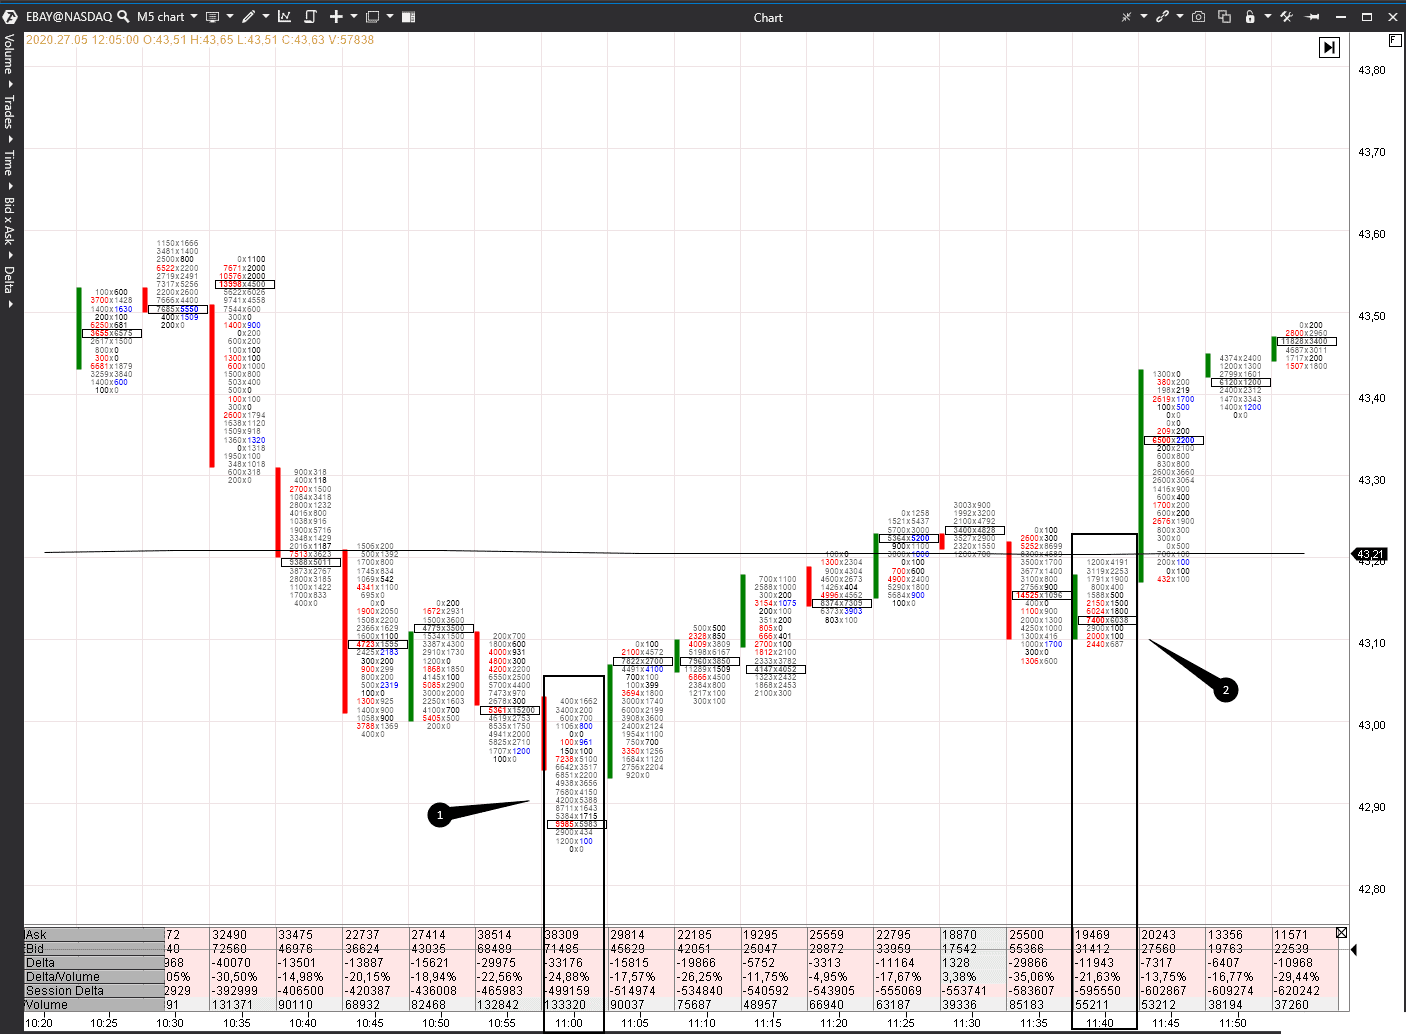
The biggest volume for the whole reduction period is in the candle marked with number 1, but the candle closes at the low. The lower the price, the less the amount of sold shares is, however, the situation should be opposite in the event of a strong bearish trend. There is a red imbalance of sellers in the candlestick tail. If they got stuck in loss-making positions, they would buy in order to close sells.
The volume is much smaller in candle number 2. The candle is green despite the red imbalances – most probably, it is a test at the VWAP level. The next bar is wide and closure is at the high and much higher than VWAP – the reversal is confirmed.
Analysing the Footprint, traders may see what happens inside every candle. It is possible to assess what volume got stuck and what volume ‘moved’ prices and also to see the fight between buyers and sellers in real time.
Main rules of trading reversals:
- do not try to be the first and catch the very high or very low, although you also shouldn’t enter a reversal too late when the price already ran away from the extreme point;
- follow the rules by which you trade reversals, for example, local price low, positive delta and buyers that got stuck at the bar low;
- accept loss-making trades without emotions. Reversal patterns do not always work. If you want to win back after a loss-making trade, perhaps, reversals is not your trading strategy;
- do not persist in searching for a reversal on trend days. Of course, the price would reverse sooner or later but, perhaps, it would not be today and not after the deposit expires.