What are volatile futures and how to make money from them
Volatility… Futures… Strange and a bit intimidating words for a beginner in financial markets. But, in fact, everything is simple. We already wrote about futures for beginners in detail. Now, let’s find out what volatility is.
Read in this article:
- about volatility in simple words;
- how to measure volatility;
- indicators;
- how to address volatility in trading;
- chart examples.
The word ‘volatility’ originates from the Latin word ‘volatilis’, which means swift-passing, quick, unsteady, elusive and variable. It has the same meanings in English.
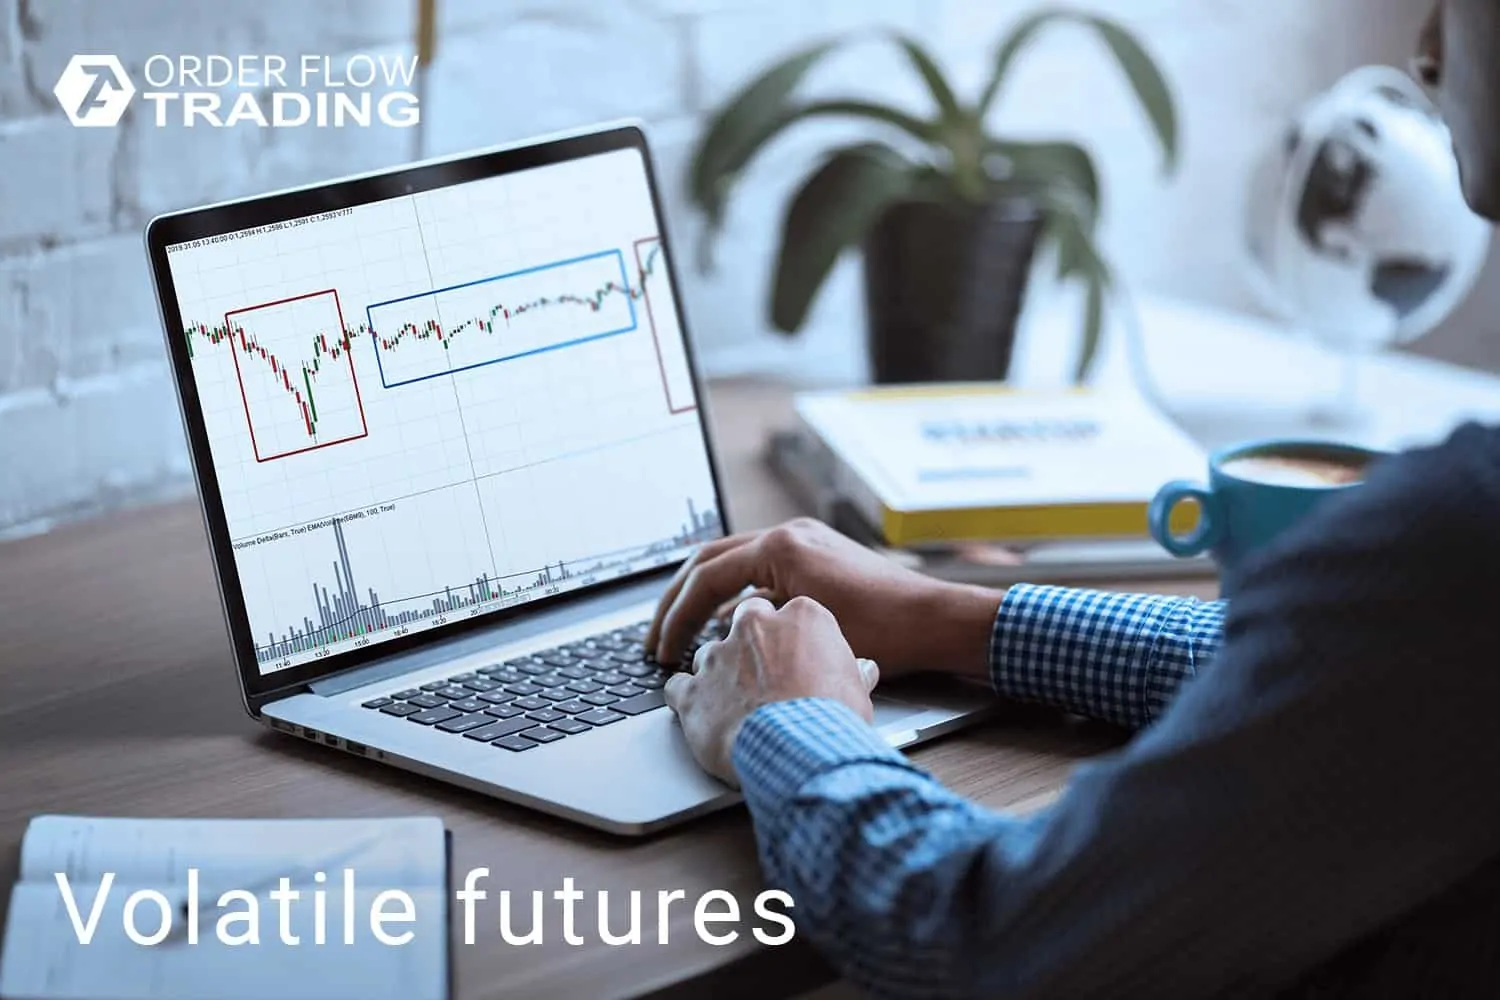
In other words, volatility is instability. If we apply the term volatility to the financial market, we would mean unstable nature of the price and its fluctuations per unit time. It is visualized in the picture below in a GBP/USD currency pair futures chart:
The chart expands with the growth of volatility (red rectangles), while the charts of involatile markets are lukewarm flats (blue area).
Let’s compare it with the sea, since the markets also move in waves. The storm of 6-9 wind force scale units is a high volatility, while the calm is a low volatility.
If we measure sea volatility in units, how do we measure volatility in futures markets? Usually, price changes are measured in percent – from low to high within a certain period of time.
It is considered in futures trading that:
- involatile market fluctuates within 1% (maximum 2%) during a day;
- fluctuations above 10% show that the market has a high volatility.
One more example of volatility are seasonal sales. Christmas discounts of 50% and more! Price drops due to closing a store. These are examples of volatile markets.
High volatility – is it bad or good?
On the one hand, high volatility is good. Because:
- it shows that the market is active;
- it increases potential of making money on the price difference.
On the other hand, high volatility is bad. Because:
- it increases possible risks;
- it is a symptom of an unbalanced market. Big price jumps could cause panic and unpredictability.
What influences volatility in the futures market?
A futures contract is a derivative instrument, which follows the underlying asset price quote. Consequently, the volatility in the futures market is completely under the influence of factors, which influence the underlying asset price.
Let’s take oil as an example. As soon as the world learns about some important piece of news, which relates to the oil price (practically any piece of news influences the oil price in the modern world), the market becomes very volatile, since the demand (buyers) and supply (sellers) sides start to look for a new balance, which would take into account this piece of news.
Consequently, if you seriously plan to trade in one market, you need to know all important price formation factors.
There is the technical background apart from the fundamental one.
The market becomes active at the moments of breaking previous extreme points, when trading near psychological levels on expiration days.
Indicators for measuring volatility
There are many indicators that measure a degree of price instability in the market directly or indirectly:
- ATR;
- Bollinger Bands;
- CCI – measures a degree of deviation from the average statistical price;
- Keltner Channel;
- ADX and others.
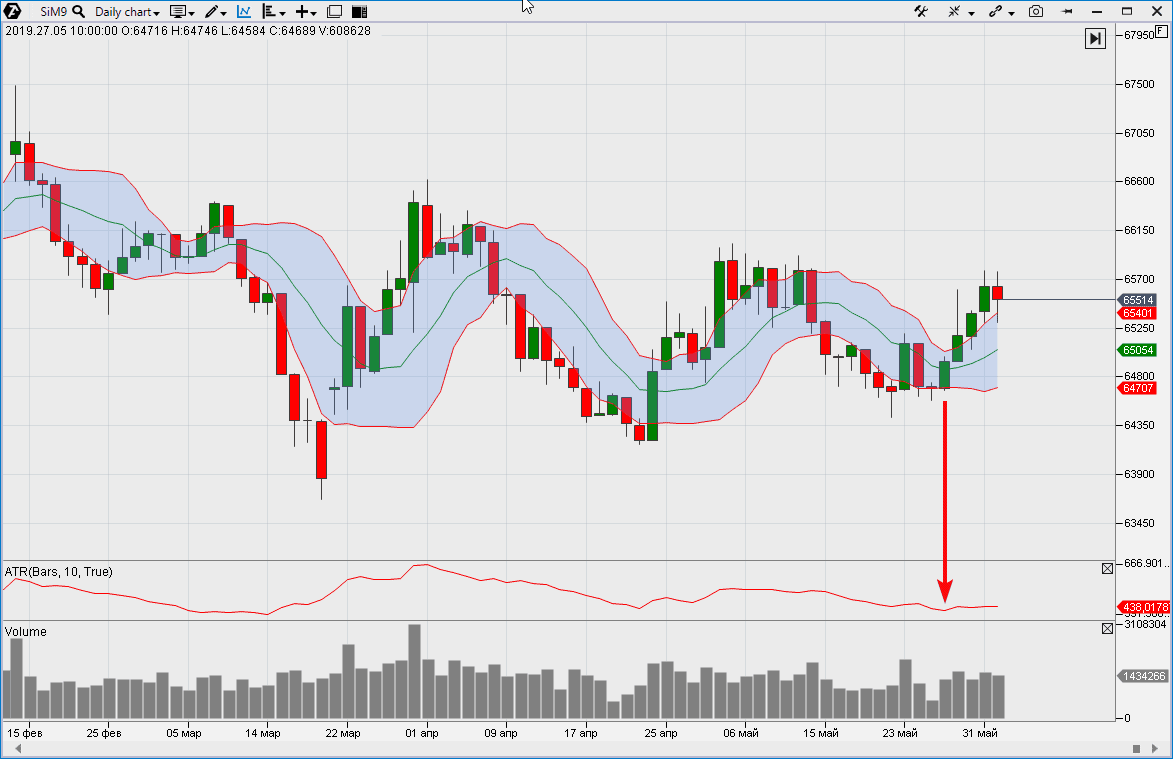
Let’s consider ATR and Bollinger Bands as examples. Namely these indicators are the most popular instruments for measuring volatility. Let’s load them in a USD/RUB currency pair futures chart (a day period).
- ATR (Average True Range) indicator is shown in the form of a red line below the price chart. When the indicator takes smaller values, it means that the volatility decreases;
- Bollinger Bands indicator is shown as a band with blue background in the area of price candles. When the bands widen, it means that the volatility increases.
The arrow in the chart points at the moment (end of May 2019), when the price instability went down in the market. As a result, the ATR indicator took values, which were close to lows, while BBands ‘contracted’.
Volatility indices are applied instruments for measuring volatility.
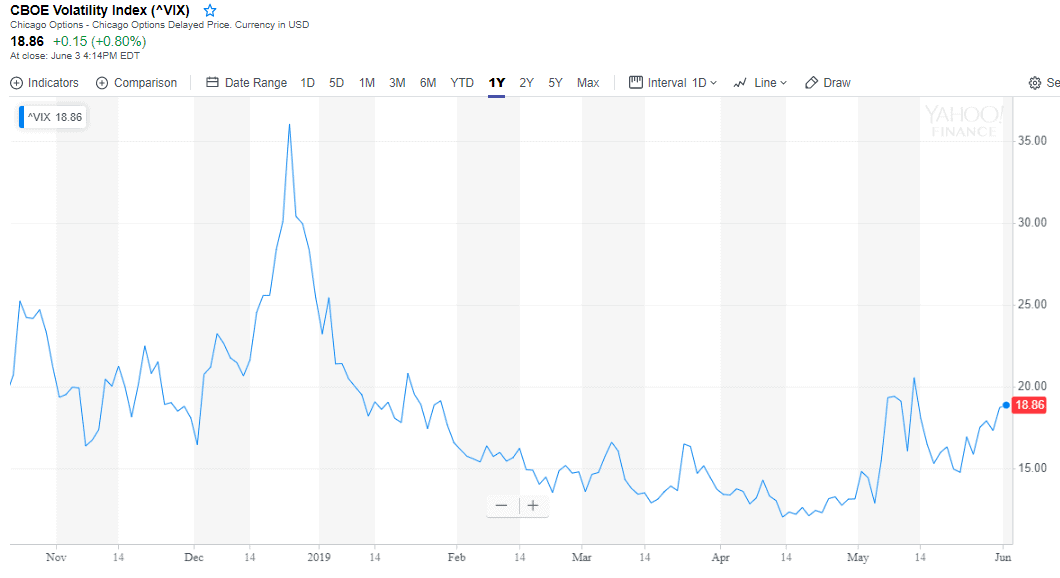
The picture above shows a VIX (Volatility Index) chart for 1 year. This instrument shows the price instability in the American stock market. The VIX peak shows that the market was very volatile in December 2018 and the stock was traded on wide fluctuations.
VIX was developed by the Chicago Board Options Exchange (CBOE) as a criterion for assessment of the 30-day expected volatility of the US stock market. Real-time price quotes of S&P 500 and call and put options data are taken as its basis. A high value of VIX means a high-risk market.
How volatility influences trading.
There is a huge number of trading strategies. Google finds 377 million of web-pages with trading strategies.
The search results include our YouTube channel, where we describe trading strategies.
However, what kind of attention is paid to volatility in this multitude of trading setups? We think that insufficient, since strategies can send different signals under conditions of different market activity.
If, under conditions of low volatility, one 5-minute candle may account for 1,000 trades, there could be 10-100 times more trades during the next 5 minutes after important news broadcast. And it is not a surprise that the indicators, used by traders, could go off-scale and behave chaotically in such cases.
Do you take volatility into account in your trading?
If you look for reasons why indicators do not work, pay attention to volatility in those cases when they brought your trade to a loss. Perhaps, the indicators are not bad, they just didn’t work properly in a specific situation.
For example, let’s take a GBP futures.
Here are two charts. A 15-minute chart to the left and a tick ATAS chart to the right. The tick chart builds a new candle by a number of executed trades and not by equal time periods. This chart type allows expanding areas with higher volatility and contract the chart when the market is inactive. Note the volumes. As if they were ‘combed’ and aligned in the right chart. This is a result of the fact that the tick chart smoothly distributes trading activity along the horizontal axis.
The classical Stochastic Indicator (Stochastic Oscillator) with standard add-ons is loaded to the charts. The arrows point at the selling signal. However, if we take the 15-minute period in the left chart, the selling signal is received on the candle closure at 11:15:00 and at 11:09:56 in the right chart. Five solid minutes of difference. And note the right edge. Activity increases at market reversals. Consequently, a signal for closing a short / opening a long also was formed more timely in the right chart.
Download ATAS. Check how a change of the chart type:
- allows neutralizing a negative effect from a volatility change;
- opens an opportunity to receive more timely signals.
The trading strategy, which is based on volatility.
Now we will discuss, if not a futures trading strategy, but, at least, a working idea for it. A psychological component lies in its basis.
When the market trades within a long inactive corridor, traders start to feel bored and focus on breakouts in order to catch a leaving train. The cunning market (or a ‘smooth operator’, if you will) knows well this behaviour of a regular person. That is why, false breakouts after a long flat period provide opportunities for trading in the opposite direction.
Example 1. Here is a EUR/USD currency pair futures chart.
- The price entered a flat after closing the American session on May 29, 2018. The profile formed a peak at the level of 1.115, while it traded in a narrow corridor.
- One would think that this bar tells us that the market wants to go down from the flat. However, note the clusters. The delta is obviously red on the bar number 2. Sells are going on. However, in case these are real sells of a strong seller, why the price completely neutralized the descending process on the next 2 bars.
- Price growth and moderate volume growth with a positive delta is a bullish structure. The footprint readers receive more and more arguments for bull trading while the market forms transition from point 2 to point 3. Impulsive bears are trapped near 1.114 and the market wouldn’t allow them leaving without losses.
It seems that this trading idea involves a higher risk, which is connected with trading against a probable trend. No doubt, there is a risk, but it is justified. If you master an ability to identify false breakouts after a period of low volatility, a potential reward will be higher than a risk.
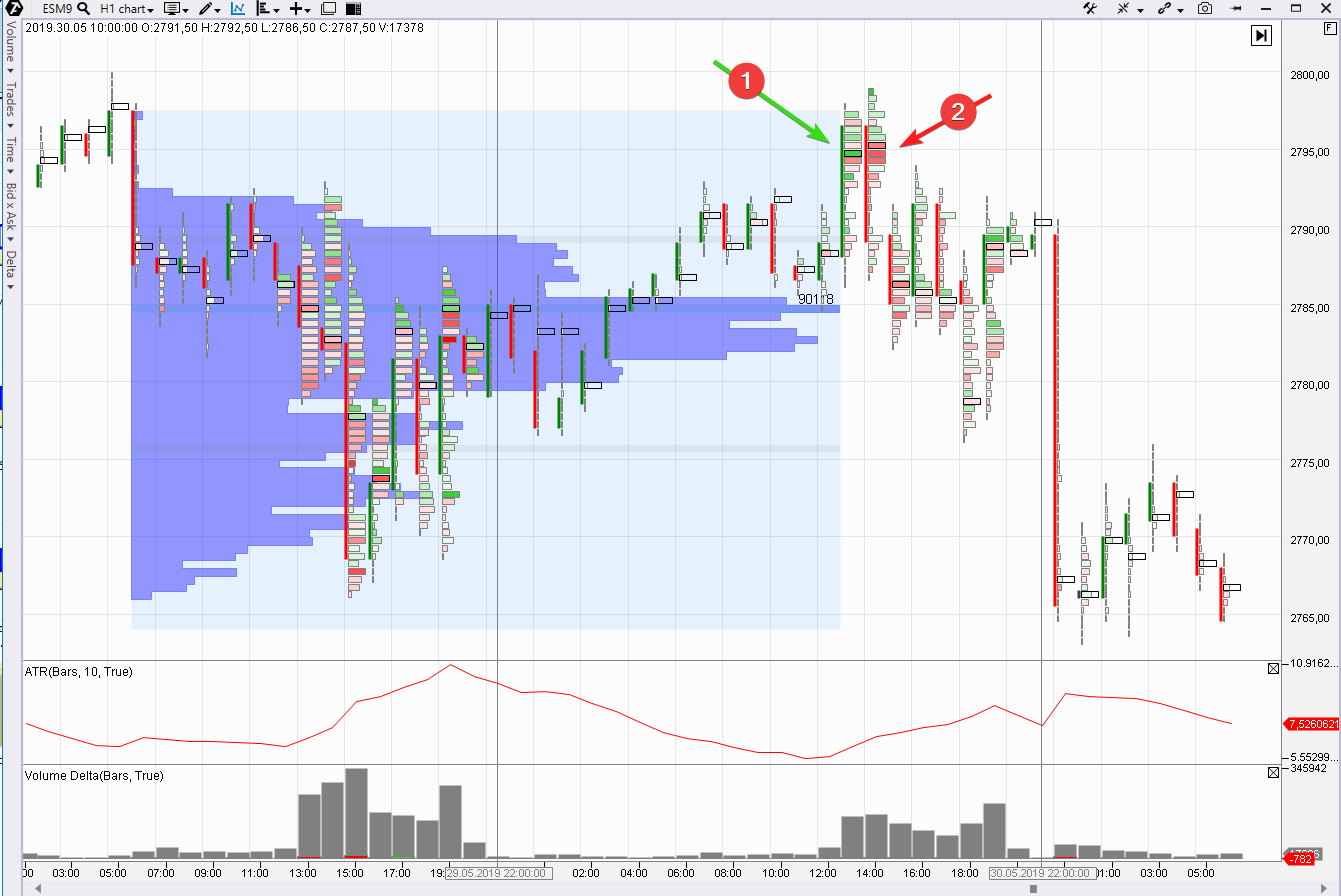
Example 2. Here is an E-mini S&P futures price quote chart.
- Green deltas on the upward breakout. The price goes behind the profile. It seems that we have a fact that the price is ready to ‘go north’.
- But what is it? Red deltas tell us about emergence of a major seller in the market. He trapped impulsive bears (number 1) and didn’t let the price go above the level of his emergence near 2,795. That is why, opening shorts from these values seems a reasonable game on the basis of existing facts.
Example 3. Take a look at the very first chart in this article. There are 3 rectangles there. Note how the market forms a false upward breakout after a period of low volatility.
Download ATAS and analyze deltas on clusters in this chart (a GBP futures – the morning events of May 30, 2019). When does it become obvious that the breakout is false? Where would you have entered a short and posted a stop? How would you have protected the growing profit? Answers to these questions would help you to build a trading strategy, which would use:
- instability of volatility in the market;
- stability of traders eager to enter into the very beginning of a trend after a boring flat.
Summary
Volatility = price variability. When developing a trading plan, a trader should take into account:
- changes in the market volatility;
- his actions, which depend on these changes.
As a rule, extreme values of volatility are not favourable conditions for entering the market, especially for beginner traders:
- too high volatility = extreme risk;
- too low volatility = there is no potential for making money on the price difference.
Choose such market volatility parameters, which produce the best results in your demo trading. Avoid trading when volatility goes beyond the set limits. And then your trading on your real account will have more chances of your success. Best of luck!


