Tag Archive for: Features of the ATAS platform

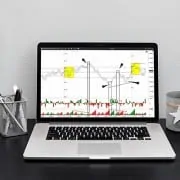
Platform for analyzing stock quotes in real time

In this article, we will speak about price quotes: what it is; where to view the quoting history; quotes in real time. Quote is the cost or price of a commodity. The word originates from the French ‘to number’ or ‘to mark’. Securities are quoted or numbered on the exchange and registered in the quotation […]

Which indicator fits best of all for an entry

Which indicator fits best of all for an entry?

Let’s frankly admit that there is no ideal indicator for an entry into an exchange trade. If it were, there wouldn’t be hundreds and thousands of other indicators for an entry. To have a stable profitability each trader should have: Trading system. Properly studied instruments. Capital management rules. The indicators you comfortably work with belong […]

Индикатор Dynamic Levels.

Analysis of Trading Levels With the Help of Dynamic Levels

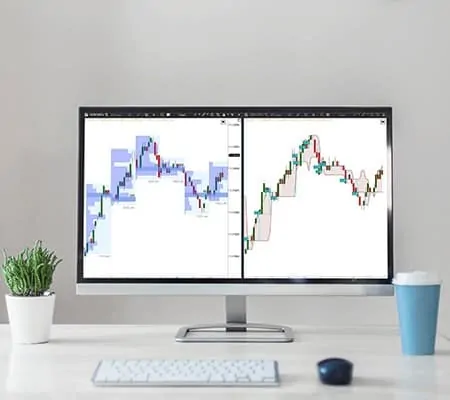
Are you interested in the volume trading strategies? ATAS will help you. In this article, we will talk about one of the very useful indicators of the ATAS platform. Namely, we will speak about Dynamic Levels. Read in this article: What the Dynamic Levels indicator shows? The Dynamic Levels indicator review. Variants of application of […]

How to select instruments for trading on the Moscow Exchange?

The issue of a start-up capital arises immediately after traders start thinking about what instruments to trade and in what markets. Foreign brokers recommend to open an account when you can spare USD 10-25 thousand. Not everyone has this type of money. Those people who just start their trading career and want to try themselves […]

Trading by volumes – dance to the rhythm of the market

Imbalance: how to make money under any conditions

Many exchange traders often execute trades the idea of which could be compared with buying potable water in a hot desert or selling ice on the North Pole. Sometimes it is very difficult to avoid such a situation trading in the futures market. Analysis of imbalance can help you to solve this widely-spread problem. Read […]

Volume analysis. Why volumes are important

Volume analysis. Why volumes are important?

Why do professional traders pay so much attention to the trading volume? What is behind the Volume indicator? Why is the volume analysis important? We will try to answer these questions in this article in the popular-scientific form. If you have never used the volume, you would, most probably, wish to try to include it […]

TPO графики в ATAS. Как торговать?

TPO charts in ATAS. How to trade?

Many traders are acquainted with the Market Profile concept. In this article we will tell you about TPO. TPO is the basic concept of the Market Profile and for the first time it was applied by Peter Steidlmayer. TPO stands for: Time. Price. Opportunities. TPO appears in the chart as soon as the market touches […]

What is delta?

Delta and Cumulative Delta: how could they help a day trader?

The Delta term was introduced into trading in 2002 when the revolutionary Footprint chart was developed. Overall distribution of information technologies and the Internet, which also affected the trading sphere, served as an impulse for it. Namely at that time access to the data about real trading volumes on the exchange ceased to be a […]

Strategy of using the footprint (example of a russell 2000 e-mini)

Strategy of using the footprint (example of a russell 2000 e-mini)

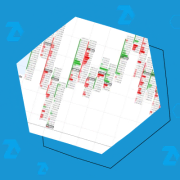
In this article we will consider yet another strategy of applying the Footprint chart, this time for trading in the Russell 2000 E-mini market, which is quite popular among retail traders. The main reason for its popularity is that a lot of price movements and reversals take place in it. It facilitates emergence of wonderful […]