Look Inside Every Single Bar
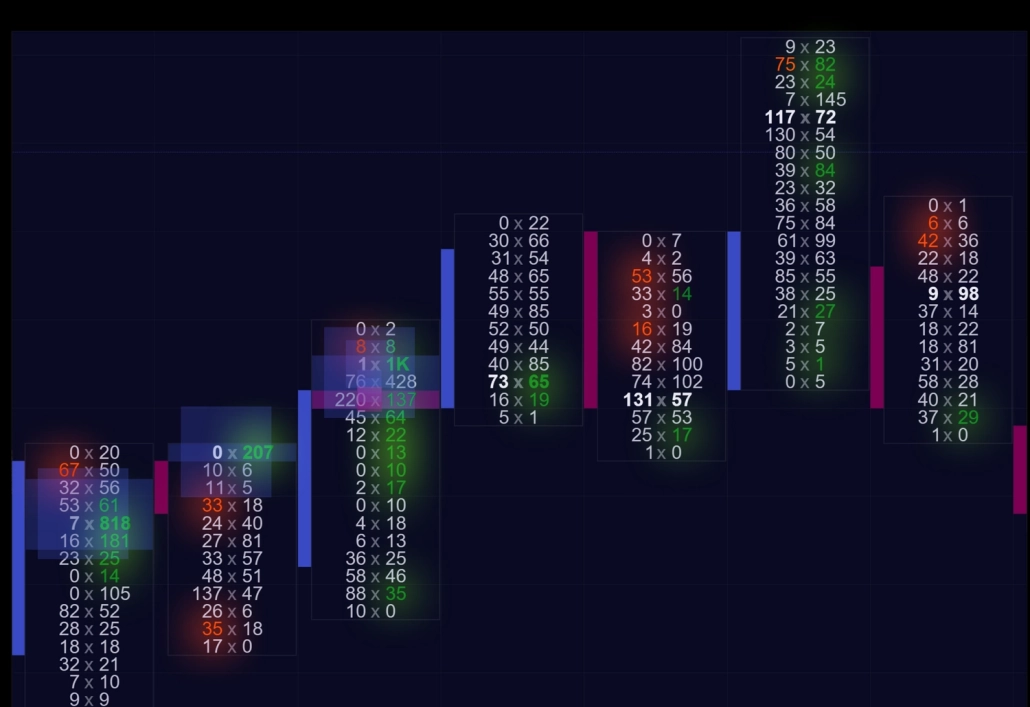
A candlestick only shows the open and close price. Footprint breaks it down into the actual battle between buyers and sellers within each price level. With over 400 volume display configurations and 14 timeframe types, you can customize your charts to perfectly match your analysis style.
A candlestick only shows the open and close price. Footprint breaks it down into the actual battle between buyers and sellers within each price level. With over 400 volume display configurations and 14 timeframe types, you can customize your charts to perfectly match your analysis style.
Real-time Order Flow
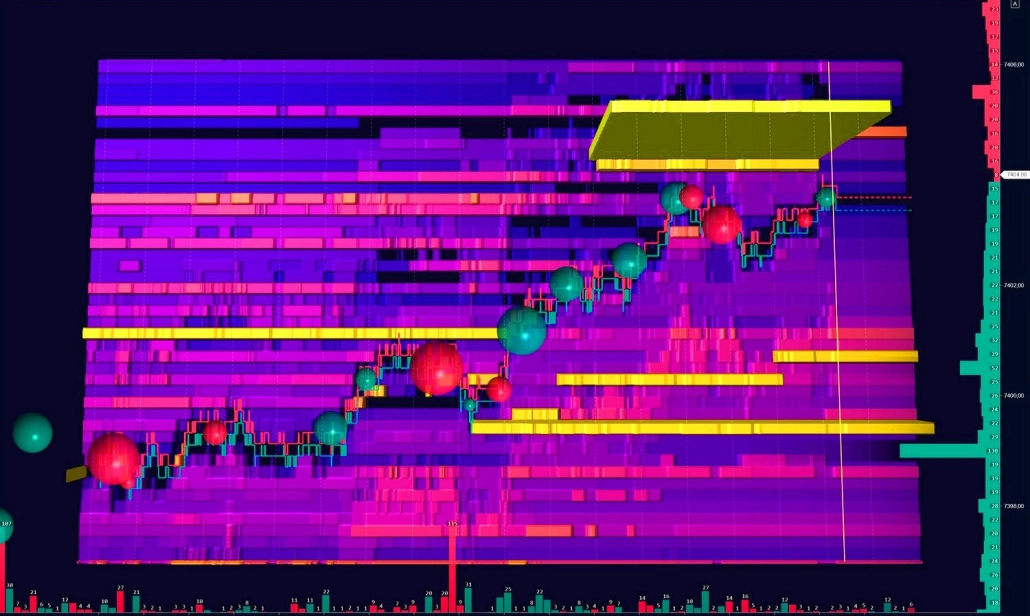
Analyze executed trades and changes in the limit order book to evaluate liquidity and volume distribution between buyers and sellers. Smart DOM, Heatmap, and Smart Tape—all in a single workspace.
Analyze executed trades and changes in the limit order book to evaluate liquidity and volume distribution between buyers and sellers. Smart DOM, Heatmap, and Smart Tape—all in a single workspace.