How to find a entry level using footprint
“Little goes a long way” is a well-known saying. This article is little, but it contains practical value for those who want to increase efficiency of their market analysis with the help of Footprint.
Footprint (what footprint is) or cluster analysis is a comparatively new approach to the market analysis. It became possible due to development of computation capacities of modern computers. One of the useful features of Footprint is that it allows tracking actions of major players.
Footprint brings maximum transparency into the trader’s working space through convenient visualization of buys and sells:
- at each price level;
- with 1 second and 1 contract accuracy;
- in real time.
Download the test version of the trading and analytical ATAS platform free of charge right now. This software is, probably, the most flexible one for cluster analysis among all existing analogues, since ATAS allows displaying 25 different Footprint types.
How to use Footprint?
Let us take a gold market example. We will use ultra-short timeframes in order to show how accurate trading decisions could be if they are made on the basis of Footprint data.
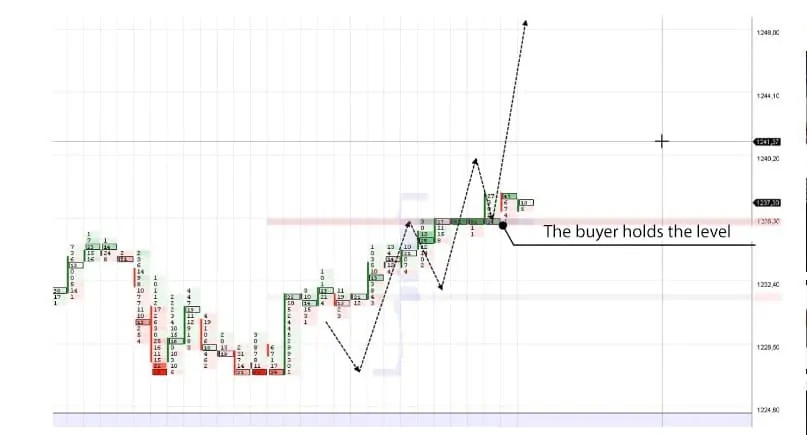
Footprint display type – TRADES with DELTA color filtration
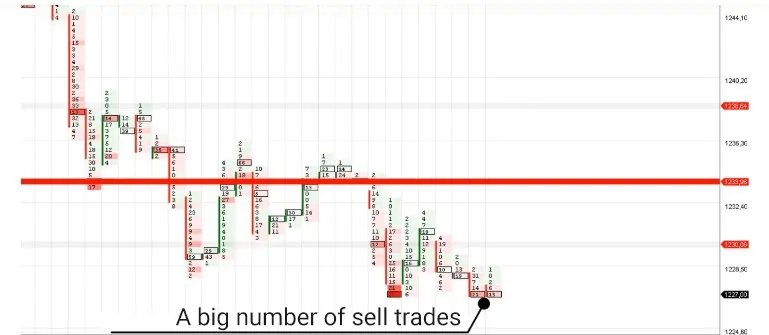
As you can see in the picture above, Footprint shows a splash of sell trades at the 1227 level. This is only several ticks below the previous low. It is worthy of note that the splash did not entail further downward movement. We have here an “abnormal” situation when the sells do not push the price down. Why?
Perhaps, it is an execution of sell orders, which displays:
- execution of stop losses of the buyers;
- sells of minor traders, who speculate on the “downward breakout” of the previous local low, but who are not able to move the market.
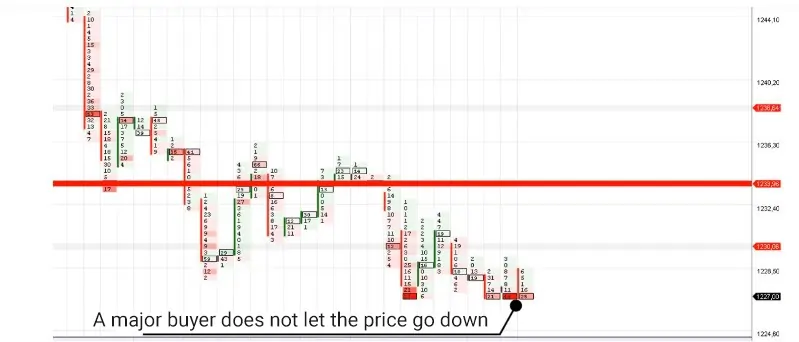
Neither of the above represents a true pressure of the major players’ sells. Well, where are they?
Probably, they are on the bullish side. Their limit buy orders, as a strong plate, keep the market from falling. Perhaps, they take a short-term long position.
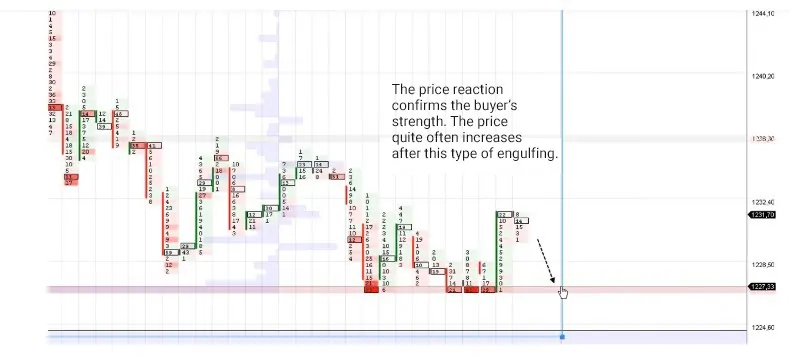
Confirmation was not long in coming.
The price increase after the splash of sells from the 1227 level does not seem strange if you know that the major player has taken the long by means of:
- engulfing a sell flow from minor sellers;
- collecting triggered stop losses from minor buyers.
The price might not go back to the 1227 low in order not to give the traders, who tracked actions of major players but missed this upward reversal, a chance to enter into a long position.
The price increases gradually up to the resistance level, which is formed by the previous local high and VAH (read about Value Area High in the article about horizontal volumes) level.
A splash of buys, at this level, means determination of buyers that accumulated longs at the low and pushed the price upward through the local resistance.
Advice.
Use Footprint and monitor situations of breakout of the resistance level on the historical data of any market. You will see how a buyer “eats” asks performing a breakthrough to a new local high. This level, which registers predominance of buyers, will render support often further on.
We hope that this little-size but large-capacity overview has been useful for you.
Have you liked the article about Footprint in the gold market example? You are sure to like this article about footprint and gold too.

