How the cluster analysis helps to trade Tesla stock
Intraday traders trade not only futures but also securities and options. Some professionals prefer stocks since:
- American exchanges have a very big choice of stocks;
- there are very volatile stocks;
- the stocks, which are ‘proper’ for trading, have big trading volumes that is why they have smaller spreads and higher liquidity, which means that you can always exit from a trade with minimum losses;
- you can forecast price movements based on corporate events, for example, quarterly and annual reports;
- influence of algorithmic trading in stocks could be lower, if many participants trade them, that is why price movements are clearer and better forecasted – levels and trading patterns work better.
‘Good’ stocks increase the percentage of the won trades and this is one of the most important criteria of a long-range success.
What it is in Tesla stock
Due to the explosive growth, which started in 2019, Tesla stock became very interesting not only to investors but also to intraday traders.
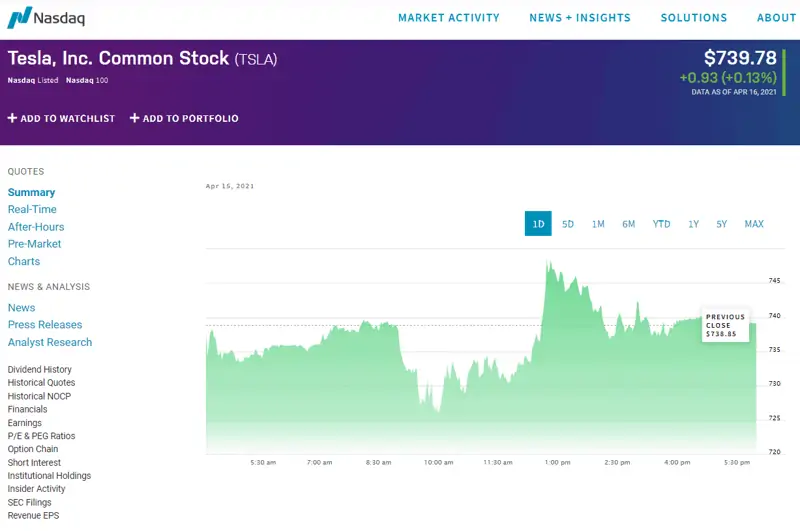
The company stock is traded on the American Nasdaq exchange with the TSLA ticker. See Picture 1.
You can find complete information about the company on the official web-site of the stock exchange, including:
- how many institutional investors have the company stock in their portfolios;
- what insiders do;
- how many traders opened short positions.
If you want to trade stocks, it is not mandatory to bother with the company’s fundamental indicators and know how the company works. However, additional knowledge helps traders to build trading plans and get a bigger profit in every trade.
What Tesla is
Tesla is an innovative company, which manufactures electric vehicles, autopilot software and solar batteries. The company stock grew by 1,280% for the past a year and a half (at the moment of writing the article in April 2021 – editor’s note).
The growth periods interchanged with periods of multi-month consolidation, which were usually formed before quarterly reports. Investors adapted to the current price level during consolidations and could buy more stock during rollbacks. Despite the fact that the company already has grown by more than 1,000%, it has the potential for further growth, because:
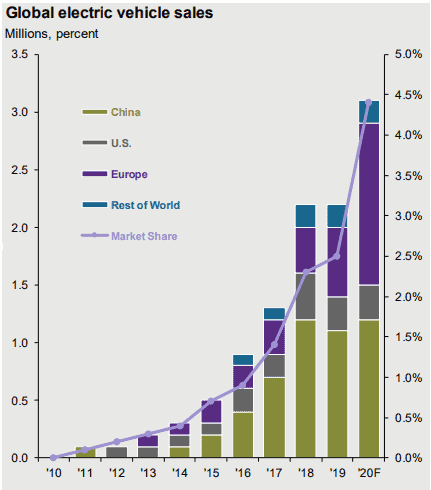
- global sales of electric vehicles were only 4.5% in 2020;
- Tesla is several years ahead of its competitors in technologies. See Picture 2.
After the company was included into the S&P 500 index, the volatility didn’t decrease, but it became easier to analyse price movements with the help of the technical and cluster analysis instruments.
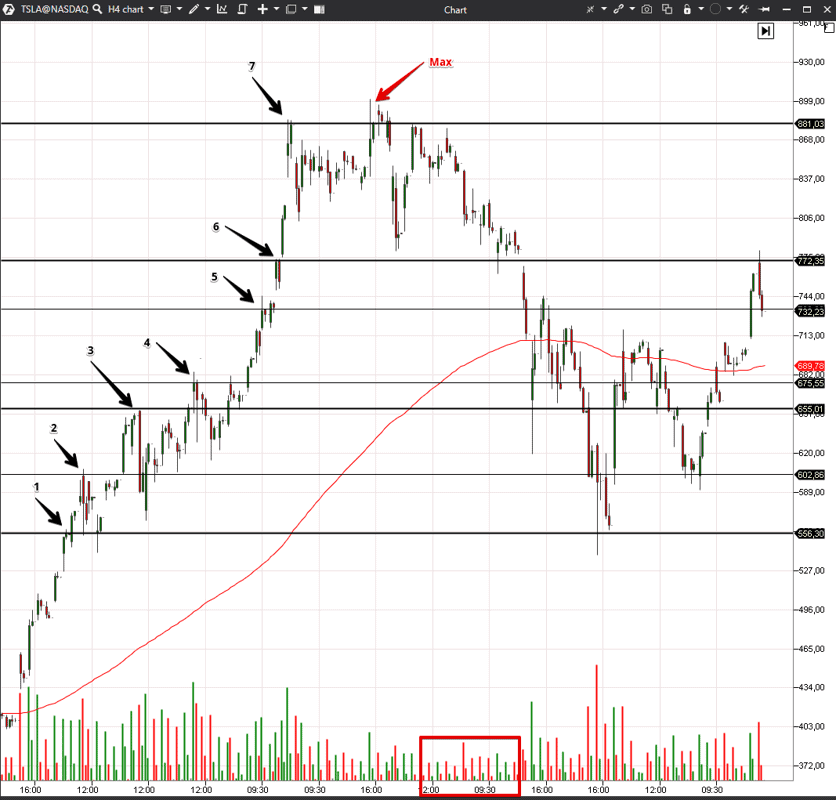
For example, we built resistance levels by the candle body highs in a 4-hour chart (see the screenshot below) in the right part of the chart. The price also slowed down in the left part of the chart at these levels, which means that it was possible to work with them for several weeks. See Picture 3.
We marked more significant levels with thick horizontal lines. The price failed to consolidate above the resistance level at a new high, marked with a red arrow, and volumes decreased. Moreover, the price moved far away from the 200-day moving average.
These signs should have attracted attention of the traders, who wished to open short positions and/or register profit after a significant growth.
Correlation of the TSLA price and fundamental indicators
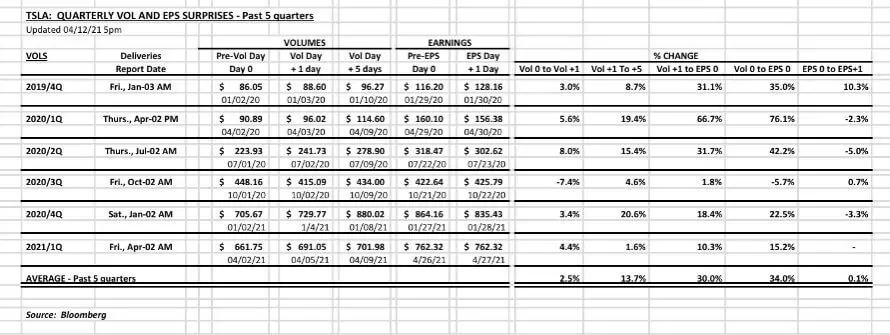
The Tesla stock price has grown during the past 5 quarters after announcement of the volumes of sold vehicles and before the earnings report. The average growth was around 30%. Perhaps, this growth was connected with algorithmic trading – the stock grows in value because analysts update forecasts and increase target prices. Consequently, when forecasts predict higher prices, fund managers buy the stock more willingly. See Picture 4.
The prices fell on the days of publishing earnings reports in 3 out of 4 past quarters and this is how the empirical ‘buy the rumor sell the fact’ rule works.
Example of cluster searching in the TSLA stock market
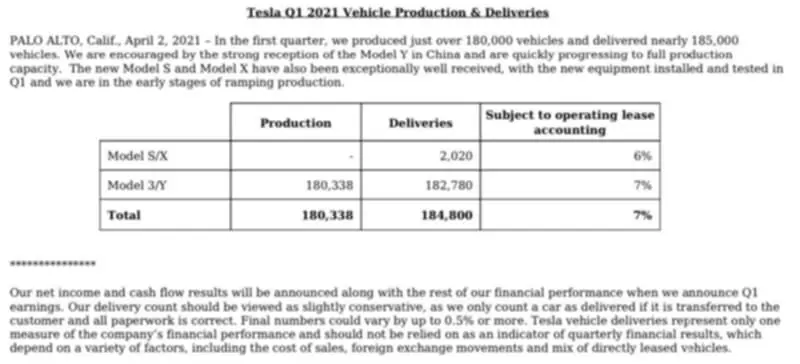
Let’s consider the beginning of April 2021. Data about the volumes of sold vehicles were published on April 2 on Friday after the market was closed. See Picture 5.
These are record-breaking data about deliveries for the whole history of the company and they surpassed forecasts of analysts. That is why, trades were expectedly opened with an up gap on April 5.
How to trade TSLA
Let’s use the Cluster Search indicator for searching the levels, at which trades could have been opened with the best reward/risk ratio. It is safer and more profitable to open long trades and wait for the upward breakout based on such reporting data.
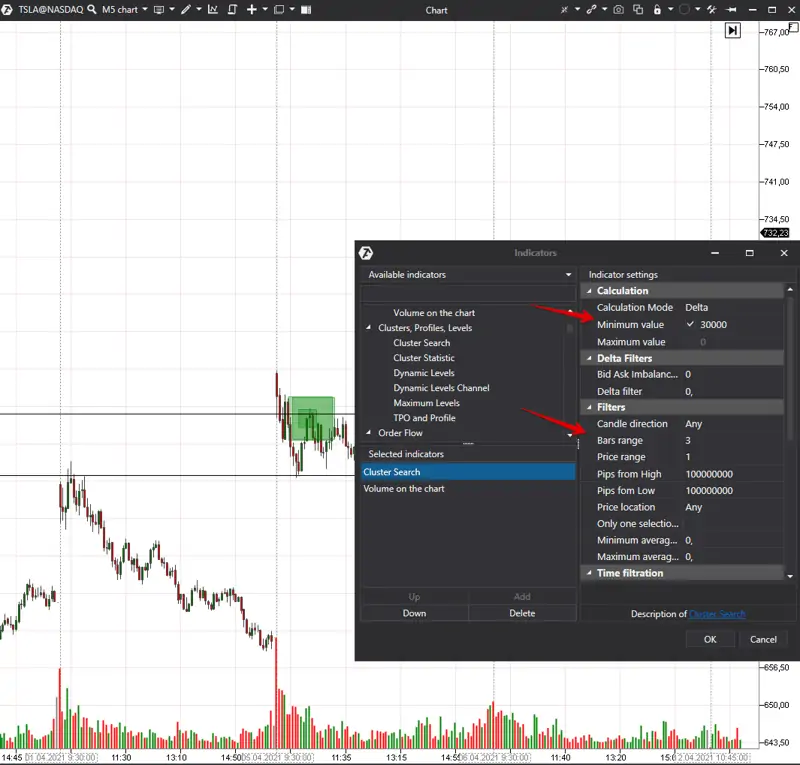
We added the Cluster Search indicator to a 5-minute TSLA chart and now we will look for clusters, combined at three levels, with the Delta predominance in 30000. The indicator will mark such clusters in the chart with green squares. The bigger the square, the higher the positive Delta value is.
Additionally, we removed the first and last half an hour of the trading session from the selection result with the help of the time filter. Usually, volumes particularly increase during these periods and the indicator would have highlighted them every day. See Picture 6.
The settings, shown in the screenshot, mark those price levels where market buyers were active. We will monitor the price reaction to these levels. Taking into account all the facts, we can make a conclusion that the probability of the price increase is higher than the probability of its decrease. However, things may develop differently in the market, so, there are no guarantees whatsoever.
Settings for a specific development of events could interfere with a correct assessment of a situation, that is why we work with probabilities only. See Picture 7.
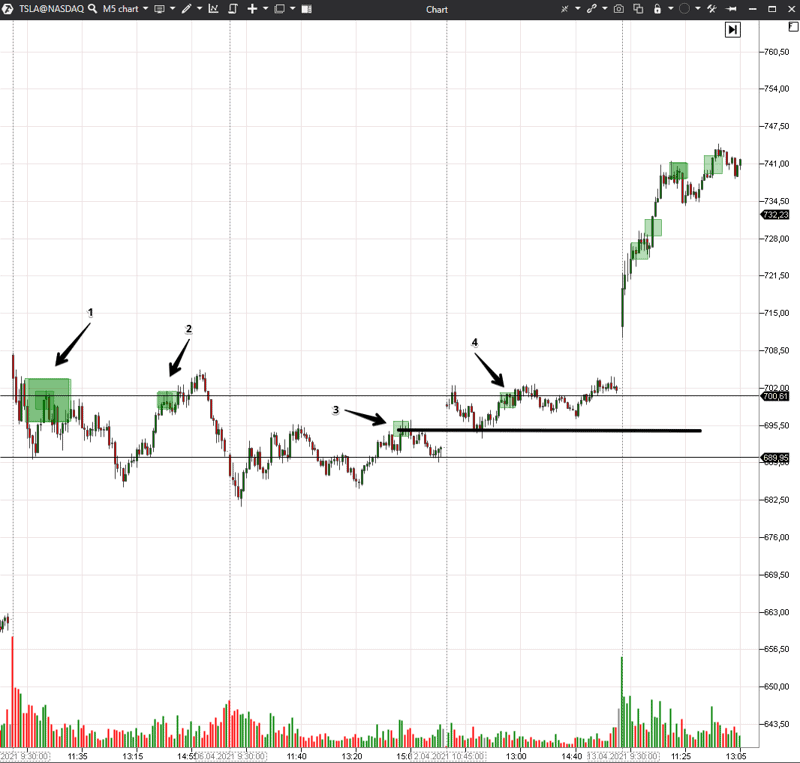
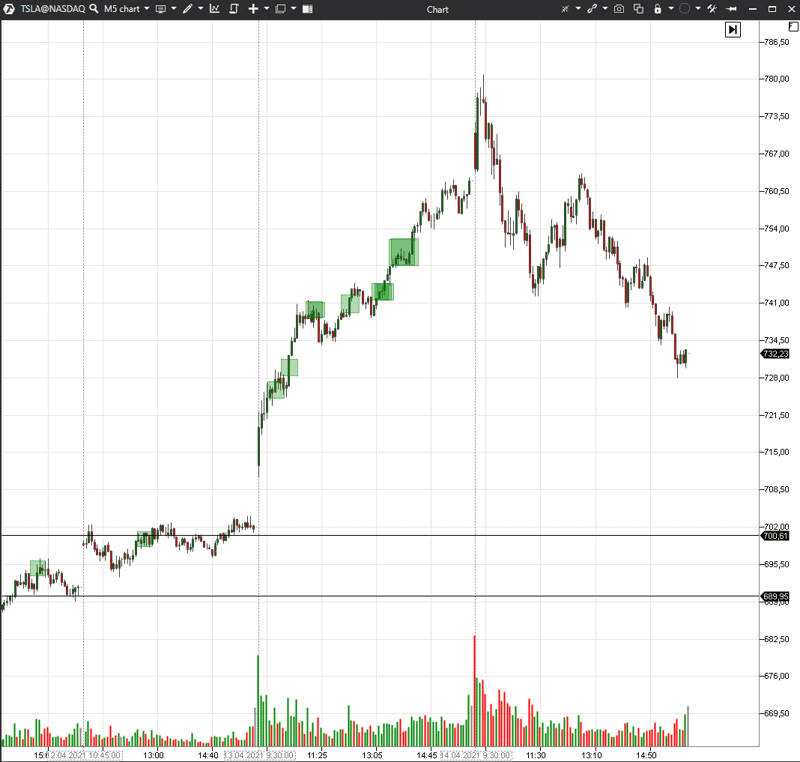
The first big cluster appears in point 1 and we marked this level with a black horizontal line. The lower horizontal line is the gap low. If this level is held, the price growth probability increases.
Buyers appear again in point 2 and try to push the price higher, but they fail to consolidate for a long time. The price closes the gap but cannot consolidate. The next two trading sessions develop near the range, which we marked. Two more clusters appear.
Cluster level number 3 in the middle of the range transforms into the support level, while cluster number 4 emerges again at where buyers and sellers fought during the previous trading sessions. The price consolidated above this level at closing – this is a bullish sign. The next trading session again opened with an up gap. See Picture 8.
We can see multiple green squares with the simultaneous price increase. It is a sign of a trend day for buyers and it is the most significant movement, which we expected.
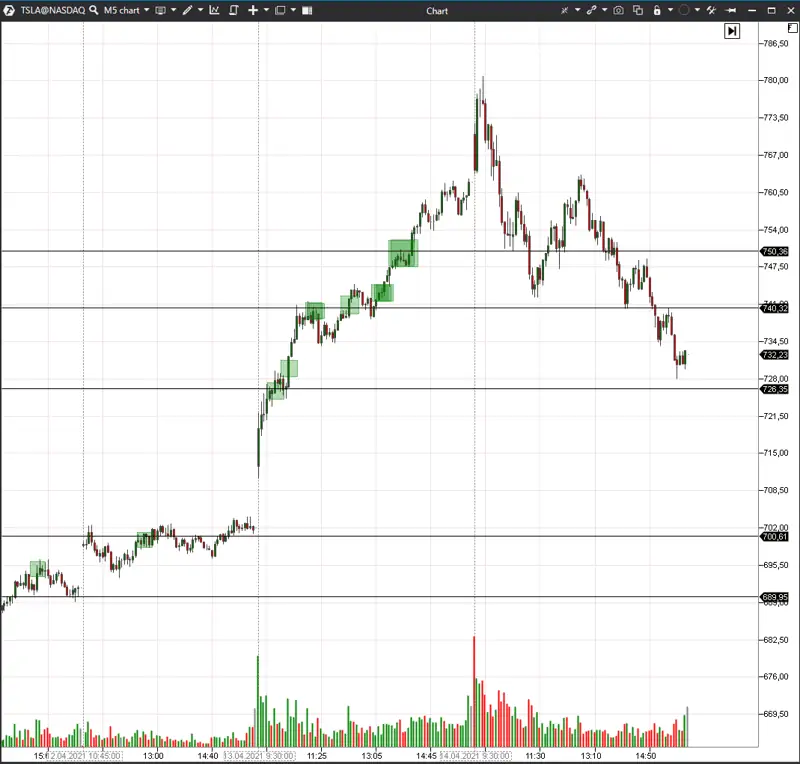
Let’s mark green squares in the chart with levels in order to analyse whether the price stopped at these levels further and whether the traders were able to work with this information. See Picture 9.
It is clearly seen in the left part of the chart that the price bounced and broke the marked levels. Traders could have gained an advantage by trading from these levels or using them for stop loss and take profit orders.
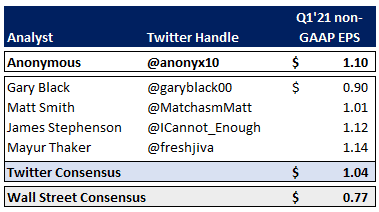
The closest (at the moment of the article publication) earnings report will be published on April 26, 2021. Analysts differ in forecasts. See Picture 10.
Note that forecasts of Twitter analysts are much higher than forecasts of Wall Street analysts. It might be connected with fanaticism and fascination with the company, but it also could be connected with a deeper understanding of the company business.
If the earnings data would be higher than forecasts of Wall Street analysts, the prices would probably grow. The stock will be, most probably, volatile after publication of the report and the cluster analysis indicators would show who controls the situation – buyers or sellers.
Correlation of the Tesla stock and bond yield
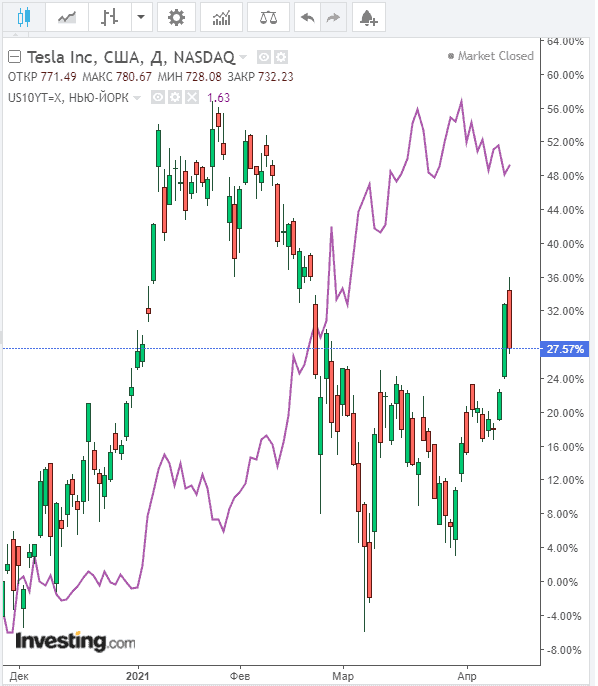
When traders trade stocks of growing companies (and Tesla is definitely a growth stock), it is also possible to use the inverse correlation of this stock and yield of 10-Year US Treasury Bonds.
Here’s how combined charts of the Tesla stock and yield of 10-Year US Treasury Bonds look like. See Picture 11.
Conclusions
If you have a trading plan for every trade and modern software, you could increase the number of positive results more efficiently in order to become a consistently profitable trader.
Download the ATAS platform demo version free of charge and estimate the power of its instruments for cluster analysis of relevant markets in action.
Information in this article cannot be perceived as a call for investing or buying/selling of any asset on the exchange. All situations, discussed in the article, are provided with the purpose of getting acquainted with the functionality and advantages of the ATAS platform.

