Cluster analysis and volume levels in the ATAS platform
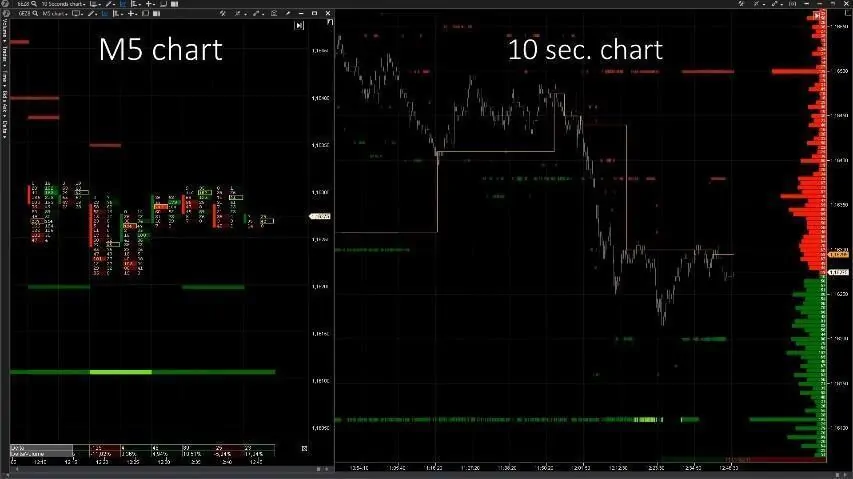
In this article we will consider a combination of the cluster analysis and volume levels in the trading and analytical ATAS platform. The aim is to find specific patterns in the buyers and sellers behavior for detecting market entry points with a low risk. We will consider an intraday market of futures on the EUR/USD currency pair as an example (what a futures is).
We will use the following charts and indicators:
- A cluster chart in the bid/ask ladder format will show the buyers and sellers actions. The timeframe is 5 minutes.
- The Cluster statistic indicator will show the percentage domination of buyers or sellers in each bar.
- The Dynamic Levels indicator will show the intraday maximum volume level movement in the 10-second chart of a EUR/USD futures (6EZ8).
- The Dom Levels indicator builds red and green lines in the chart. These are levels of major orders in the order book.
The maximum level volume is widely spread in the volume analysis. Traders that use the market profile know that the price tends to respond to the levels of major volumes, since the price behavior reflects trades of buyers and sellers.
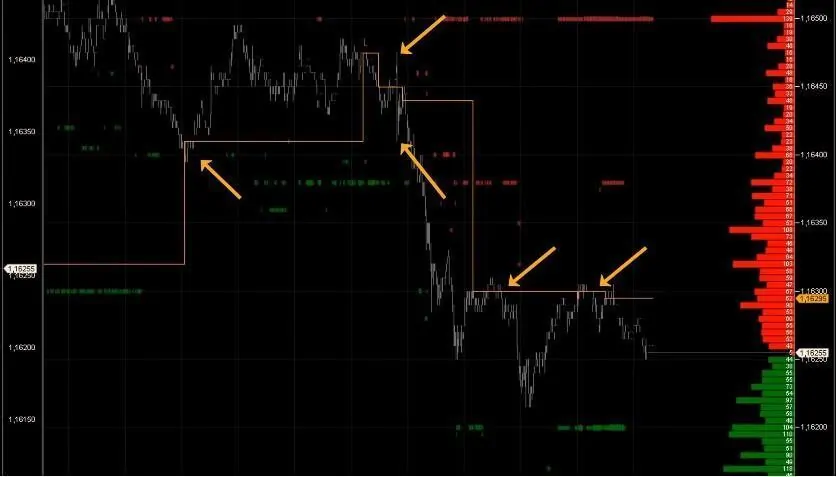
The picture below shows a yellow polygonal chain (Dynamic Levels Indicator), specifying movement of the maximum volume level. Arrows point at specific behavior of the price of two types:
- Breakdown – the price breaks the level and aggressively moves further in the set direction;
- Test – the price stops, tests the level, tries to break it, steps back in the opposite direction and tests the level again.
Important note. All examples, considered below, are taken away from the general market context and do not take into account the senior timeframe levels, which always make important amendments into the intraday trading. We analyse the flow of orders only in momentum. In real time, it is mandatory to take into account a general situation in the market.
Also, remember that there could be a flat (side movement) in the market. The market in a flat does not tend to new levels but trades with the aim to accumulate new volumes of positions. Or a period of low volatility just passes over, the reasons of which could be plenty. Due to the flat, the cluster analysis, as well as other types of analytical methods, often produces contradictory results. For example, the entry point signals could appear in the middle of the flat range, where the entry price itself would not have a sufficient potential for continuation of movement. This increases risks.
Cluster analysis and breakdown of the maximum volume level
The maximum volume level (computed by the Dynamic Levels Indicator) could be broken by the price:
- from bottom to top – a potential entry into buys. When analyzing an ascending bar, which breaks the maximum volume level, search the cluster chart for aggressive market buys in the form of bright green cells and overweight of the buying delta in the cluster static indicator from 30% and higher. The delta overweight means availability of aggressive buyers who will push the price further in the direction favorable for them;
- from top to bottom – a potential entry into sells. When analyzing a descending bar, which breaks the maximum volume level, search the cluster chart for aggressive market sells in the form of bright red cells and overweight of the selling delta in the cluster static indicator from 30% and higher.
When the price breaks the high volume level, the further movement nearly always is supported by the breaking side and is a confirmation of the fact that this level is important for the market.
Example 1. Breaking the maximum volume level by the price from bottom to top
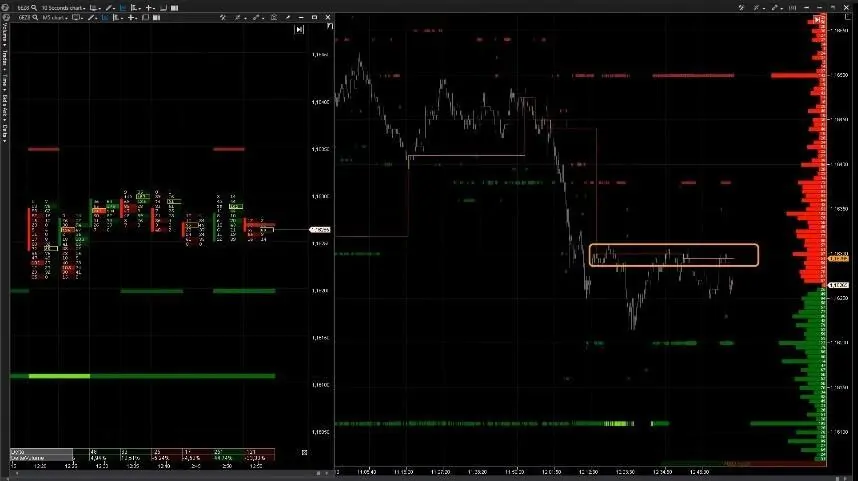
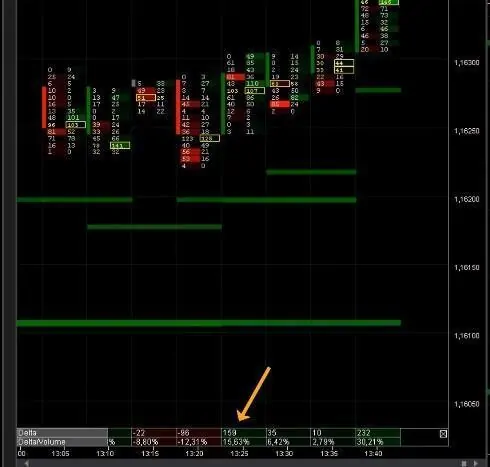
The price is under the maximum level of the volume (marked with a yellow rectangular). It is clearly seen that the price bounces from it several times.
If a seller will really start protecting this level:
- all aggressive buys, which can break this level, should be absorbed by sell limit orders stopping the price;
- there could be no major buys at all, and if there are no major buys, the price will not be able to break the level.
During several tests of resistance, we see domination of market buys from the contrast green color in the cluster chart, but the price does not grow further.
This seller holds the price at the resistance level test.
However, at a certain moment the buyers start absorbing market sells. Note absence of a bearish progress, despite the sells in the 13:20 clusters. This is a breakdown forerunner.
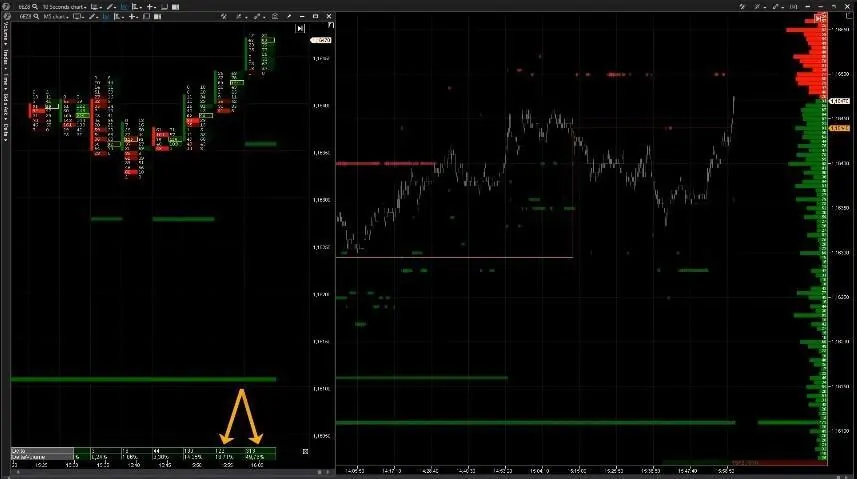
The price breaks the maximum level of the volume from bottom to top in less than half an hour. We can see the cluster static indicator readings in the bottom of the m5 cluster chart. This indicator is of interest due to the delta values and percentage weight in relation to the whole volume in the candle. The breakdown is accompanied with a big overweight of market buyers (the arrow points at the moment when the buyers domination started and this domination became much stronger during the breakdown).
Splash of buys during a resistance breakdown is a behavior specific for a strong market. Download ATAS free of charge and study the delta behavior during a breakdown in your favorite market/timeframe.
Example 2. Test of the maximum volume level
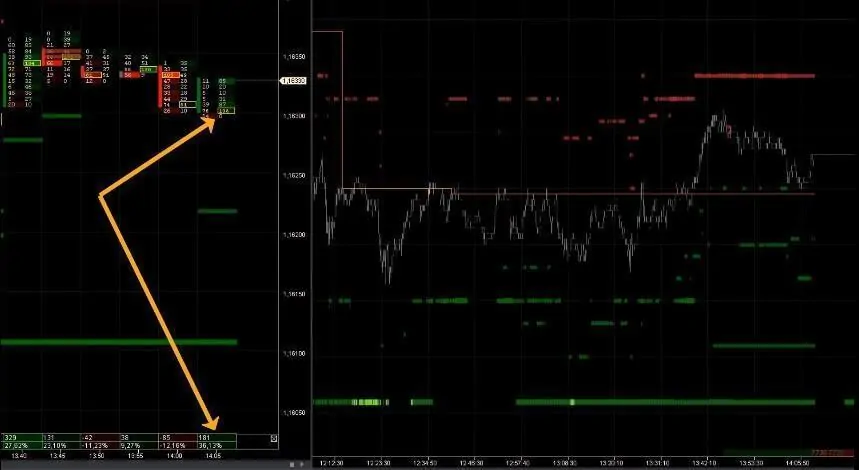
As a rule, a short price correction takes place after a breakdown. It is called a broken level test in the classical technical analysis. How does it look like in the cluster analysis? We do not see major absorptions of sells in the test. Perhaps, this movement is required to make the buyers, who entered at the resistance breakdown, nervous. The level test usually ends when the sells “dry out” and an aggressive buyer appears, and the price lends itself to him, bouncing from the breakdown level in order to continue the growth.
The arrows point at appearance of the buyer who completed the breakdown test and renewed the growth.
The upward movement continues and we may consider the level breakdown to be successful. The price achieved the red-color levels of the dom levels indicator, which could be used as a target for fixing the profit from long positions.
Example 3. The cluster analysis and one more maximum volume level breakdown
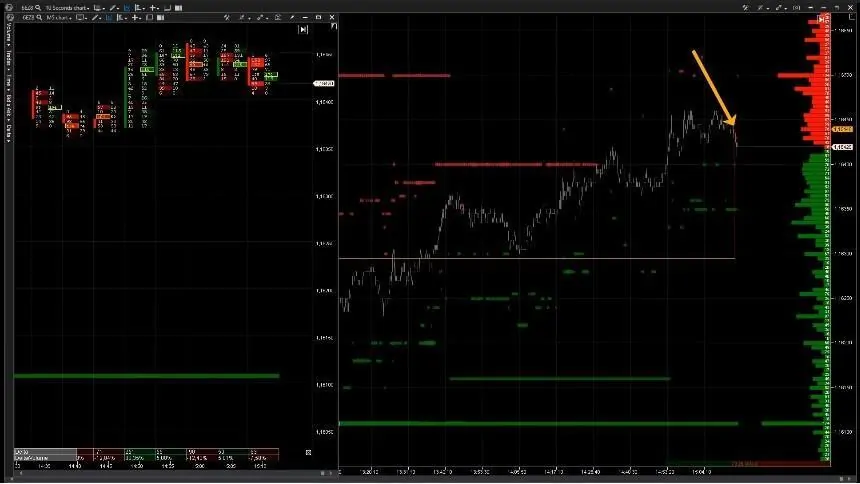
After the price growth described in the example above, the maximum volume level moved up. The balance has changed and we can start analyzing major clusters in order to find new possibilities for making profit.
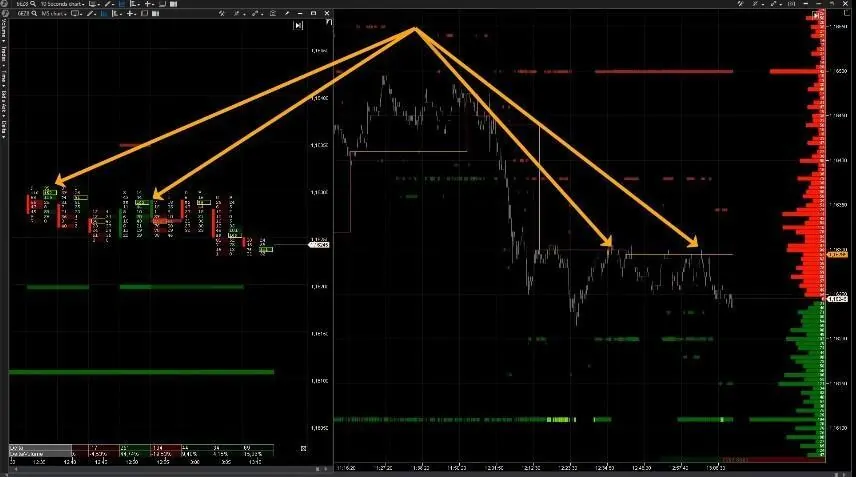
A big number of market sells emerged in the cluster chart after the move of the maximum volume level.
Then the price goes down, which means that the buyers tried to sustain the achieved progress of the market growth, but they failed. At least, on the first try. Just a number of 5-minute bars and the price goes up back to the maximum volume level (Dynamic Level Indicator).
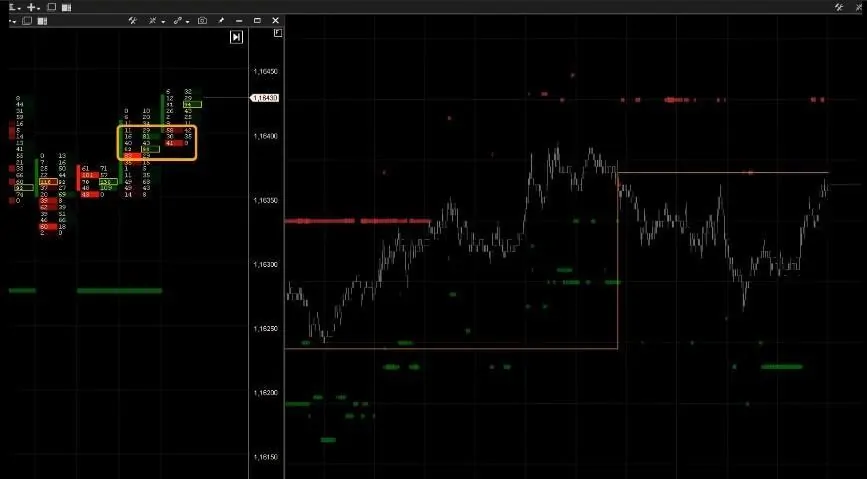
Let us apply the cluster analysis at this potential maximum volume level test. Aggressive sells emerge in clusters, but they do not result in the price downward movement.
This absence of the bearish progress in the price against the background of executed SELL orders is a forerunner of an upward breakdown, what we already saw in the Example 1. The price goes to the level breakdown after this absorption. Note the cluster static, the breakdown momentum is again accompanied with aggressive buys of the bright green color.
It means that not only ourselves but the other buyers also see this level. They make efforts to break this level and establish themselves on top.
Summary
The cluster analysis gives a better understanding of real market mechanisms. All by itself or in a combination with supplementary indicators, such as Cluster Statistic, Dynamic Level and Dom Level, the cluster analysis increases chances for successful forecasting the price movements near important levels – whether there will be a breakdown or a test with a bounce.
In the course of the maximum volume level testing, absorption of major market orders takes place, the price movement stops and a fight between buyers and sellers starts.
If the level is tested from bottom to top, it is worth looking for absorption of market buys. The footprint will show clusters of the bright green color without a bullish progress.
If the level is tested from top to bottom, it is worth looking for absorption of the market sells. The footprint will show clusters of the bright red color without a bearish progress.
When a breakdown takes place, the delta takes the bright color of that side of the market, which has an obvious advantage. The bright green clusters affirm the buyers success during a breakdown of resistance. The bright red clusters affirm the sellers success during a breakdown of support.
Download ATAS. It is a powerful and flexible trading and analytical platform, which allows analyzing market situations easily and acting faster than other market participants with the help of modern instruments.

