Create your own profitable trading strategy
We will speak in this publication not only about theoretical aspects of the profitable trading system development but will also consider such a technical moment as programming a specific trading system on the C# programming language for the ATAS platform.
We will explain to you in simple words how to develop your own trading system step by step and test it on historic data with the help of the ATAS platform.
Read in this article:
- What is a trading system?
- What should a trading system be?
- Steps of developing your own trading system.
- Launching a new trading system into operation.
This publication may become your starting point of a journey into a fascinating world of trading system programming. Even if you do not have a programming experience, you will be able to develop, following our recommendations, trading systems and robots independently with the help of the analytical ATAS platform.
Such a direction is efficient due to a big number of already developed programming modules in the ATAS system, which allow working with exchange data – receive volumes, use built-in indicators, identify chart patterns, etc.
Introduction
If you haven’t yet read our publications, which conduct a small tour into the algorithmic trading system, we recommend you to get acquainted with them through the links below:
- Trading systems.
- Development of robots.
What a trading system is
A trading system is a set of rules, which describe your actions on the exchange.
For example, if you open your position exceptionally from the level, where the price ‘drew’ the high and low beforehand, you definitely use a trading system. Besides, if the system is successful, accurate execution of its rules would ensure the trading capital growth.
There could be a lot of such rules and principles (it is preferable not to make it complicated) – the quality of rules rather than their number is important, as well as their strict observance.
If a trading system has strict rules without evaluative human judgements – it could become a trading robot.
Birth of a trading system
As well as a human being cannot walk and speak immediately after birth, a profitable trading system is not born profitable.
Before a trading system starts increasing the account, it passes several mandatory stages, which could be put into shape as the following list:
- a trading system idea;
- writing the trading system’s programming code;
- testing on historic data;
- testing on current quotations;
- introduction of necessary improvements;
- realisation in the final variant.
In fact, the trading system and algorithmic trading concepts originate from different planes, however, the difference disappears after they are implemented in life.
The matter is that a trading system idea might be born in the trader’s head, but it is still impossible to assess its brilliance without a real market test.
For example (see the picture below), if you register successful realisation of your idea several days in a row, it might seem to you that you discovered the Grail (1), but it is absolutely insufficient for a profitable trading system. Exchange market is an environment, which changes all the time. That is why the profit may turn into loss (2) in the long run.
It means that any idea, which might seem very attractive on paper, needs thorough testing, first, on historic data and then on real time data.
Trading system testing
Let’s speak now how to conduct testing of your trading system.
If you are a very persistent and goal-oriented person, you could analyse every day for several months, writing down real results into a notebook or electronic table and making final calculations.
If you lack patience (time and strength), you could independently write a program or invite an expert which will write a program for you.
Advantages of the second approach are obvious:
- a program will do the work, which you would have to do during a week, in a couple of seconds;
- you may adjust a program, introduce and change various ratios, which would allow not only to check the trading system efficiency, but also to select the most optimum correlations of ratios and find dependencies and regularities;
- neuronets could be implemented into a program and they will be able to find the best correlations of all ratios and calculate the optimum algorithms independently.
If a trading system shows a good result on historic data (taking into account brokerage and exchanges commissions), then you should develop a trading robot for this system, which would independently open trades on the exchange and post takes and stops.
Advantages of algorithmic trading are obvious:
- a trading robot is never tired;
- a trading robot has no emotions, which very often interfere with the trader’s activity;
a trading robot never violates the rules of risk management and money management.
So, now we are reinforced in the expediency of transforming your trading system into the programming code.
Let’s consider practical recommendations on how to do it.
Steps of development of your own trading system
The ATAS platform has many indicators in its arsenal, which allow visual identification of patterns and dependencies in the price behaviour.
You will definitely have trading system ideas if you monitor them.
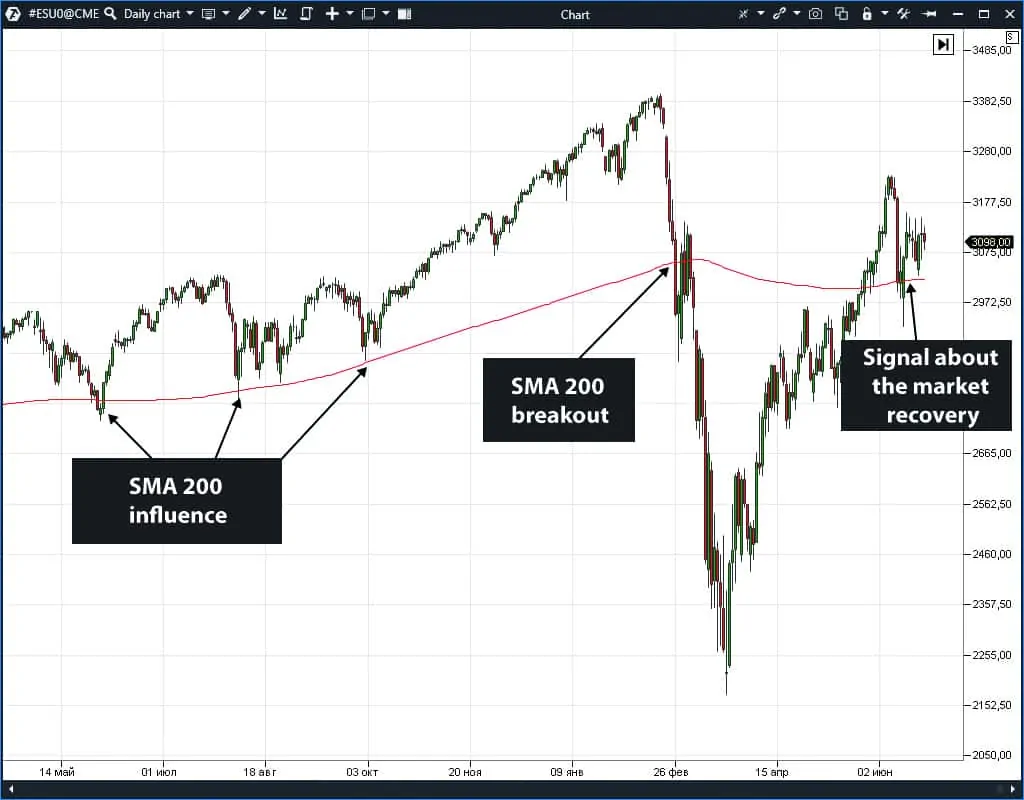
A very simple example. You might have often noticed how the price reacted to the level, which was formed by high volume, or to the lines, which were formed by moving averages (see the chart below).
Here you can see the S&P 500 index futures price dynamics for 2019-2020 with a daily time-frame. Every time the chart approaches the two-hundredth moving average, the index is bought out and the price continues to grow. The SMA 200 (SMA – Simple Moving Average) serves as the support level and doesn’t allow the market to crash. There should have been an event, which we know as the pandemic due to the spread of coronavirus, in order to break the SMA 200 level.
It’s quite probable that if this event hadn’t happened in human history, the market would have continued its growth.
Why do we see such a regularity? The matter is that modern exchanges are filled with trading robots, which are set for certain patterns and regularities. The more often different regularities manifest themselves, the higher the probability is that these regularities are used by trading robots.
Let’s assume that major funds use SMA 200 for buying out securities, which creates a potential for reversal movement on the wave of big buys.
We already considered in one publication how to determine the exchange entry point. We described the algorithm of making trading decisions on the basis of the Delta and Open Interest indicators.
Let’s take the idea of the search for entry points on the basis of the Delta indicator. Now we need to develop a module, which would check the efficiency of our idea on various exchange instruments.
Our first task is to collect statistical historic data and save the results in a file for further use. The task is solved in several steps.
Developing a programming module for collection of statistical data
Since the trading and analytical ATAS platform is written in the C# programming language, we will continue using this language for writing our own statistical module. All additional modules could be connected to the main program with the use of dynamic dll libraries.
Any version of the Visual Studio, which could be downloaded from the developer’s web-site free of charge and installed on your computer, will do for writing our own library.
We will not go into details of the Visual Studio installation procedure. We will just note that you can find a multitude of materials, video lessons and textbooks on this subject.
You need to create a new project in the programming environment: .NET Framework class library.
You should set the project name, which we would use further on, for example – Statistic. When selecting the platform version, you need to select not lower than .NET Framework 4.6.
Then you need to load a special ATAS library into the project. The library is called ATAS.Indicators.dll and the file is located in the root directory, in which the ATAS is installed.
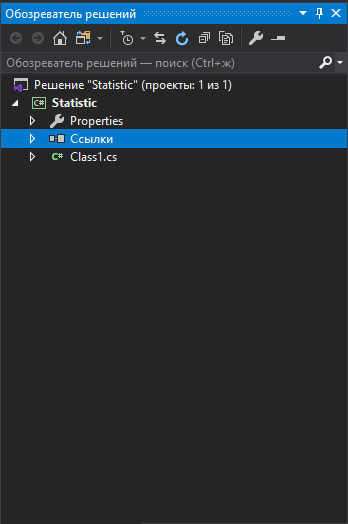
To do it, you need to go to the Solution Explorer window, click the right mouse button over the ‘Links’ section and select ‘Add a link’.
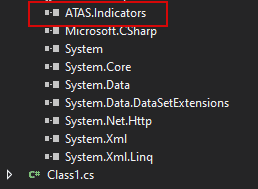
Then we find the ATAS.Indicators.dll file and add a link to it in the project.
After the library is added, we can see its name in the list of links.
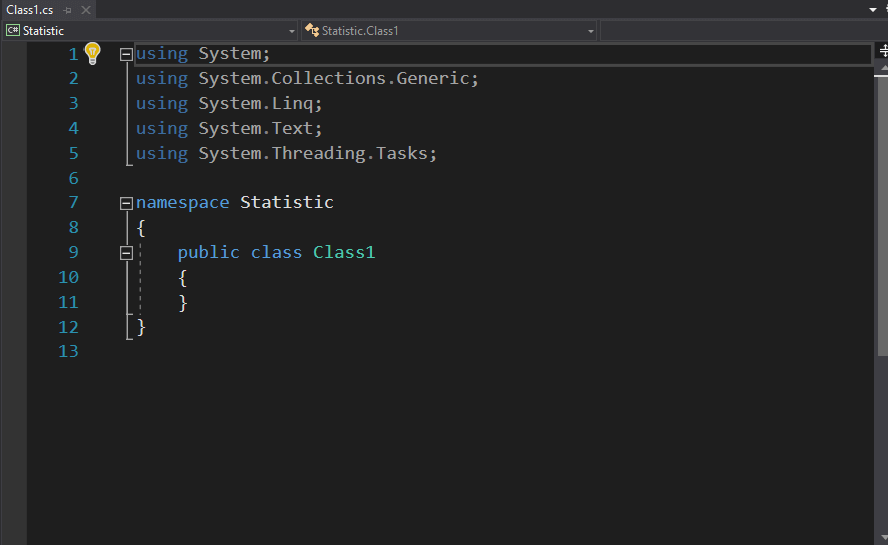
The startup project looks as follows by default:
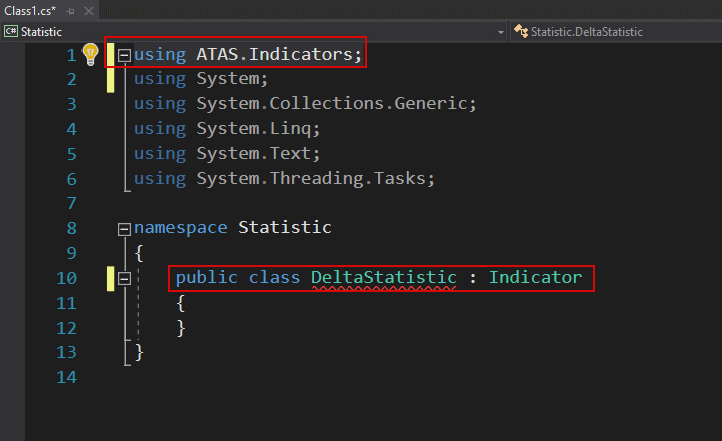
Let’s rename the main class name and label it as DeltaStatistic and add inheritance of methods and properties from the loaded ATAS.Indicators.dll library. In order to do inheritance without errors, you need to add the following directive:
using ATAS.Indicators;
Our project should look as follows after the above manipulations:
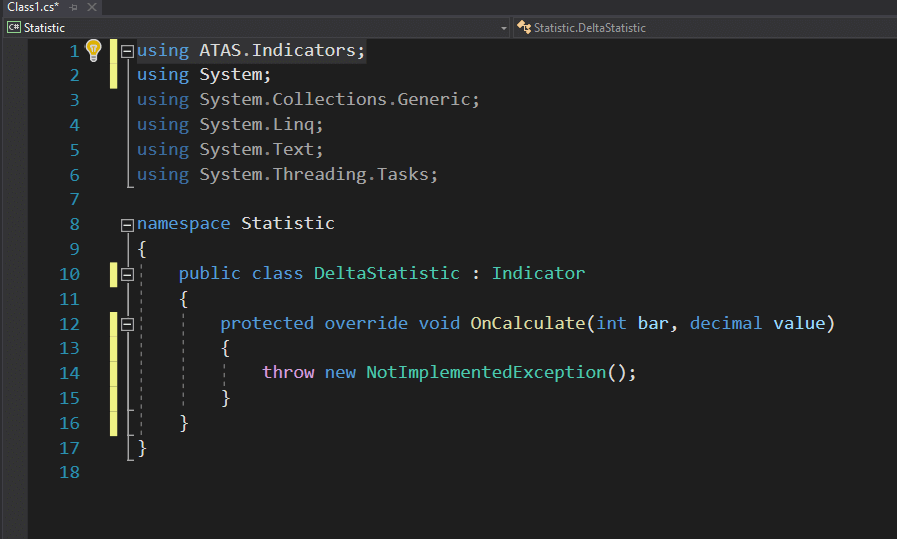
The abstract OnCalculate method is not still realised, that is why the development environment will show an error under the class name. Visual Studio in some cases offers an accelerated realisation of some interfaces and abstract properties, that is why we move the cursor over the DeltaStatic name (marked red) and select the abstract method realisation, offered by the environment, after which our project will look as follows:
Now we have the OnCalculate method in our project, in which the indicator logic is usually realised.
Now we remove ‘throw new NotImplementedException()’, which we don’t need, from the new OnCalculate method.
The OnCalculate method is called for each bar on history in the successive order and further on is called at every tick. We realise the logic using another method, which is called OnInitialize, in order not to overload the computer with excessive calculations. This method is called once while initializing or refreshing the chart. That is why we will need to refresh the chart after changing ratios so that the module would recalculate results.
Since we would use logging of our statistics in the main ATAS window, we would need to add a link to the Utils.Common.dll library, which is also in the root directory where the program is (the same way as we did it for the ATAS.Indicators.dll library).
Programming the trading system
Let’s start programming the code, which looks for the Delta indicator abnormal volumes in the chart. To do it, we calculate average values for the positive and negative Delta. When we know average values, we would be able to search for the bars, in which Delta has a deviation for a certain ratio.
In the event the Delta value deviates for a certain ratio from the average value, we would consider this bar a ‘reference’ one.
We will introduce several rules to check efficiency of the trading system:
- if the Delta is negative, the bar goes down and several next bars are below the reference bar closure level – we consider the bar opening level to be the resistance level;
- if the Delta is negative, the bar goes down and several next bars are above the reference bar closure level – we consider the bar closing level to be the support level.
The same rules will act for the positive Delta but with a reverse logic.
Now we need to decide what number of bars after the reference one we should analyse. To do it, we will set a ratio, which we can change when necessary. For example, if we plan to work on a minute time-frame, we will set that we monitor 3 bars after the reference one.
This is required in order to give the market a possibility to ‘decide’, in what direction the main movement would develop after the reference bar. It often happens that volatility decreases for some time after the reference bar and we need to envisage a possibility to miss such areas in order to increase efficiency of the algorithm operation.
We will also need one more ratio – a multiplier. The algorithm will multiply the Delta’s average value by this ratio and look for the bars with the Delta, which is higher than the received value. The bars, which are found this way, are added to the collection of reference bars.
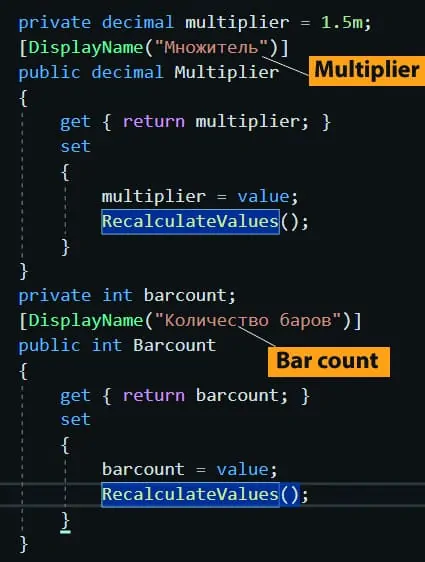
Let’s insert two fields into the code with the following names:
- Multiplier (accounts for the ratio value, by which the Delta’s average value will be multiplied);
- Barcount (accounts for the number of bars, which should be missed after the reference bar).
We will need two more ratios apart from these ones. One will account for the take profit size and the other – for the stop loss size.
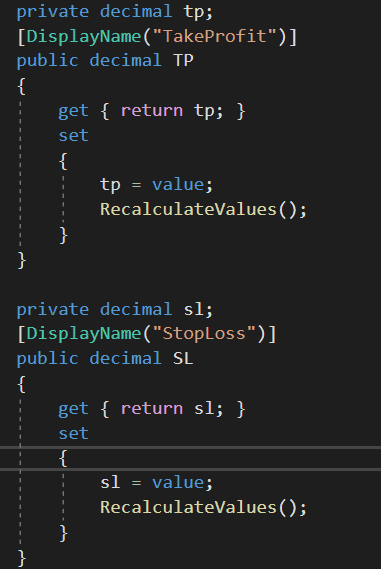
Let’s add two new fields into the code TP (take profit) and SL (stop loss).
You might have noticed that the RecalculateValues() method is called in the ‘set’ block of each of the fields. This method recalculates all values when one of the indicator properties changes. In our case, the call for this method could be cancelled, since we use our algorithm only during the chart initialization. If we take the whole code from the OnInitialize method and put it into the OnCalculate method, we should leave the call of the RecalculateValues method. That is why we deliberately leave the proposed field block structure in the presented code for those cases when you would decide to transfer the whole logic into the OnCalculate method independently.
The whole logic of statistical calculation lies in the consecutive sorting out of the reference bars, building the support and resistance levels by high and low of the reference bars, imitation of opening short and long trades from the levels and checking the opened trade results. All the profit and loss data are logged in the special ‘collection’ inside the indicator and are shown in the main program window after completion of calculations.
Since the goal of this article is not to write a manual on programming, we will not give you a major part of the information about coding, otherwise, we would have to make this article several times bigger.
We provide the source code of the indicator to those who want to study it. The programming source code of the indicator is available for downloading and studying here:
You can download the compiled indicator using this link:
In order to install the indicator into the platform, you need to copy the ready library into the directory: C:UsersUsernameDocumentsATASIndicators, after which you need to restart ATAS.
In order to launch the statistical module, you need to add the DeltaStatistic indicator from the general list to any chart.
After the indicator is added to the chart, you need to set the indicator parameters:
- the multiplier accounts for what fold of deviation from the Delta’s average value will be taken into account when calculating reference bars. For example, if the positive Delta average value for the whole chart is 500, then, if the multiplier is 2, those candles would be reference ones, the Delta in which is more than 1,000. Reference candles with the negative Delta are calculated similarly;
- the number of bars accounts for how many bars the indicator should miss in order to start the trend direction initiation as up or down, which, in its turn, influences the trade opening directions. For example, if the closure of the next bar is higher than the reference bar opening point for the growing reference candle + the missed number of bars, then the level of the reference bar opening becomes the support level and the system monitors when the price tests the support level again and calculates what profit such a trade would bring. If the trade is closed by a take profit, the profit is considered to be positive, if it is closed by a stop loss, the profit is considered to be negative;
- the take profit accounts for what number of points are considered to be a profit in the event of a take profit activation;
- the stop loss accounts for what number of points are considered to be a profit in the event of a stop loss activation.
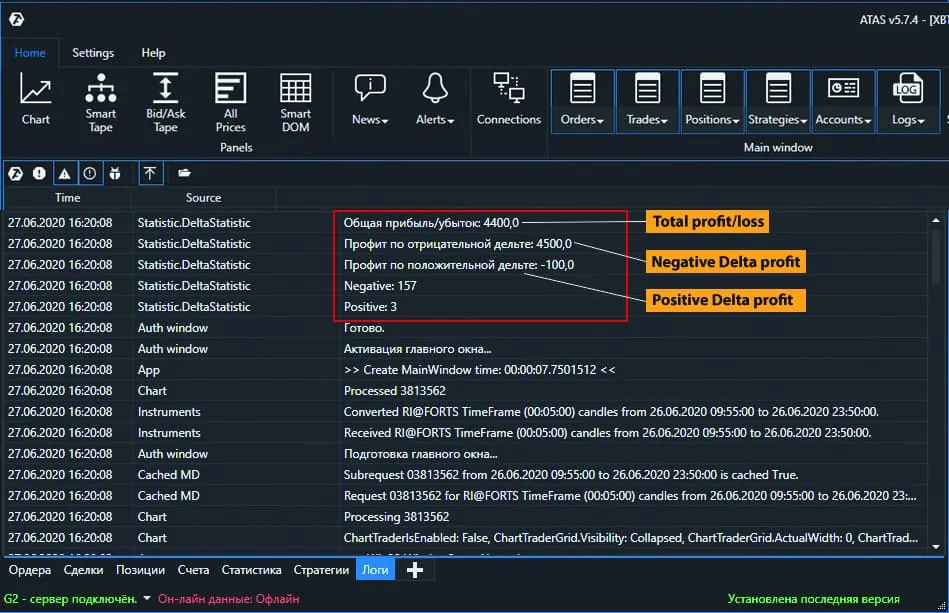
The program consecutively calculates every reference bar in terms of the trade opening, take profit or stop loss activation, collects the statistics of every trade and shows the final result, which could have been received in real trading, in the main program window.
We can see from the above picture that the statistics module tells us the following:
- there are 3 reference bars with the positive Delta;
- there are 157 reference bars with the negative Delta;
- profit by imitation of trades from the positive Delta -100 points;
- profit by imitation of trades from the negative Delta +4500 points;
- the general profit is 4400 points.
Thus, if we use these indicators, we are capable of collecting statistical data on absolutely any financial instrument and on absolutely any time interval.
And selection of such parameters as stop loss or take profit allows us to find optimum correlations, so that our trading system would be the most efficient one.
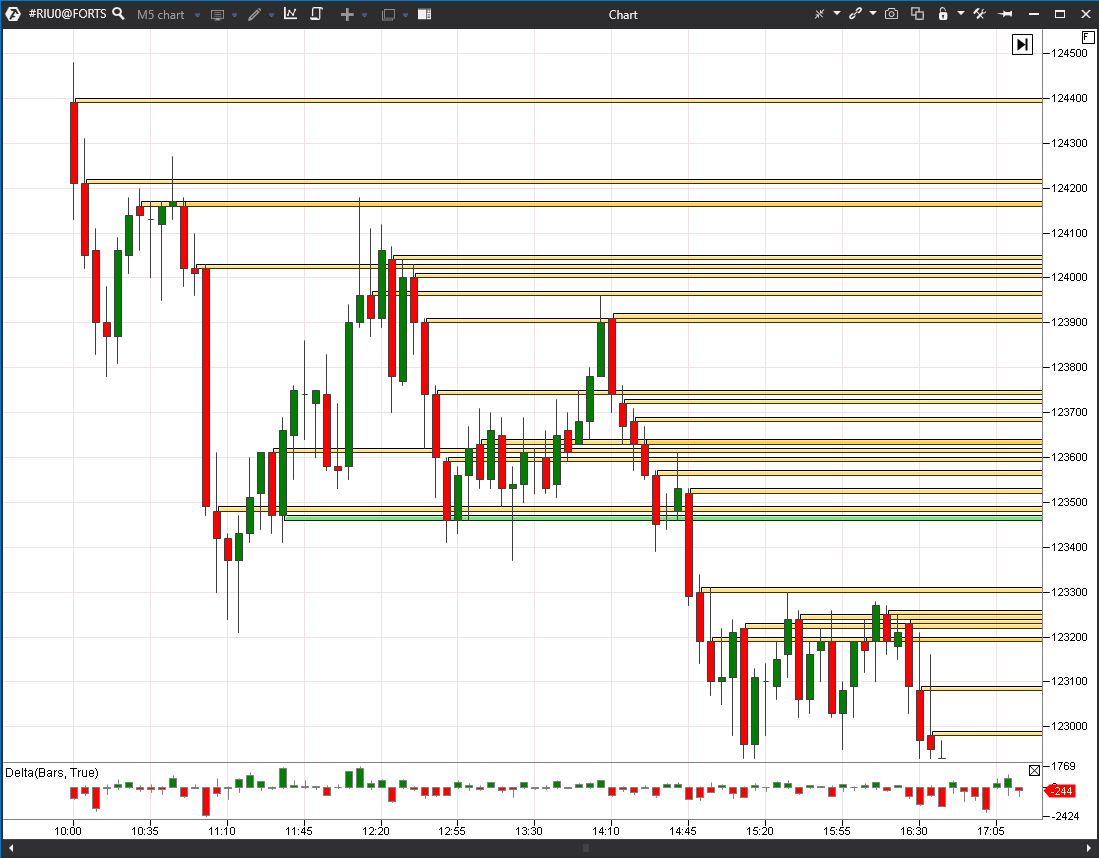
We want to remind you that the chart should be refreshed after changing parameters in order to enable the indicator. If everything is set correctly, the indicator will draw the support and resistance levels directly in the chart, confirming its operation, and, if necessary, this function could be disabled in the code after recompiling the library itself.
Summary
We would like to note in the conclusion that:
- you can develop a profitable trading system only with a serious attitude to this issue;
- a trading system, which is implemented in a programming code, will work faster and more correctly than a manual trading system, in which you use a pen and paper;
- a trading system can work both on long and short time intervals;
- the ATAS platform significantly simplifies development of a trading system, making the programmer’s work with historic data and built-in indicators intuitively clear;
- after your own trading system is ready and shows good results on historic data, you can realise the whole trading logic in the trading robot using the ATAS platform due to the built-in system of posting trading orders and risk control.

