Strategy of trading by Delta and Vertical Volume. Examples
When you monitor the charts and rapidly changing quotations of financial instruments, you may have an impression that the market is a big symphonic orchestra under close management of an experienced conductor.
So, how to select an instrument, which would allow you to seamlessly join a united crew of experienced musicians, escaping dissonance? And how to spend less time studying and tuning?
Of course, we do not speak about musical instruments here but about indicators that provide traders with a competitive advantage in order to trade in harmony with a trend. Namely this means to hear the ‘market music’.
In this article, oriented at practical trading, we will:
- tell you about two well-known indicators – Delta and Vertical Volume;
- show you how to build a simple strategy on these two indicators;
- formulate trading rules;
- give you chart examples of how strategy works.
Method of trading by the Delta and Volume pattern
Below, we will give you a simple trading method, based on the readings of two indicators: Delta (what Delta is) and Volume.
This trading method is based on identification of recurring regularities (patterns).
We will demonstrate only:
- hourly charts, but it doesn’t mean that this method doesn’t work on other periods;
- EUR futures (EUR/USD), but it doesn’t mean that this method doesn’t work in other markets.
Use this method in other markets and on other periods, selecting signal indicator values by trial and error. We discovered that the below described method is traded most efficiently for the 6E futures on CME during the period from 07:00 GMT until 16:00 GMT.
Search for signal values
This strategy takes into account activity of major players. Their actions could be determined by volume splashes. If the Volume indicator takes on extreme values, it is a sign of the fact that a major player entered the market. Retail traders cannot provoke high values of the Volume indicator.
Well, if we need volume splashes, how to understand what is a splash and what is not?
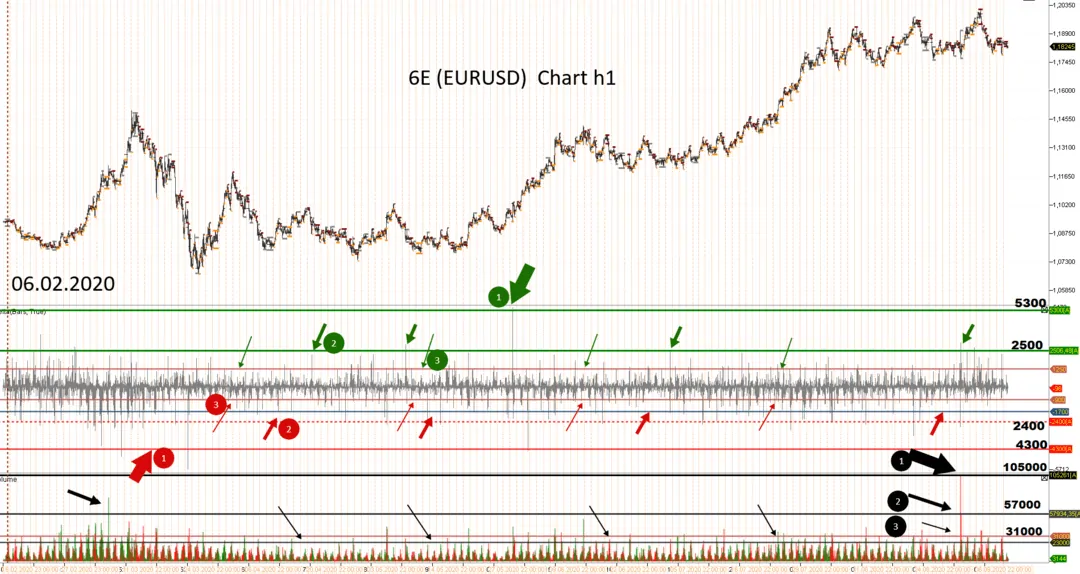
Everything is relative. Let’s take a chart. The picture below reflects fluctuations of the futures contract value from February 6, 2020.
Having analysed average values of the Delta indicator, we can identify visually that:
- values of the positive Delta from +1,250 to +2,500 could be considered extreme ones;
- values of the negative Delta from -900 to -1,700 are also strongly out of character.
Similarly, we will establish that the Volume indicator values from 23,000 are especially big.
Such splashes on the Delta and Volume values most frequently manifested themselves during the period from February 6, 2020, until September 6, 2020. We are interested in them in order to identify trading signals.
Pattern description
We want to remind you that we consider hourly candles.
We consider the entry pattern to be formed under 2 conditions;
- the Delta indicator shows less than -900 or more than +1,250;
- the Volume indicator shows more than 2,300.
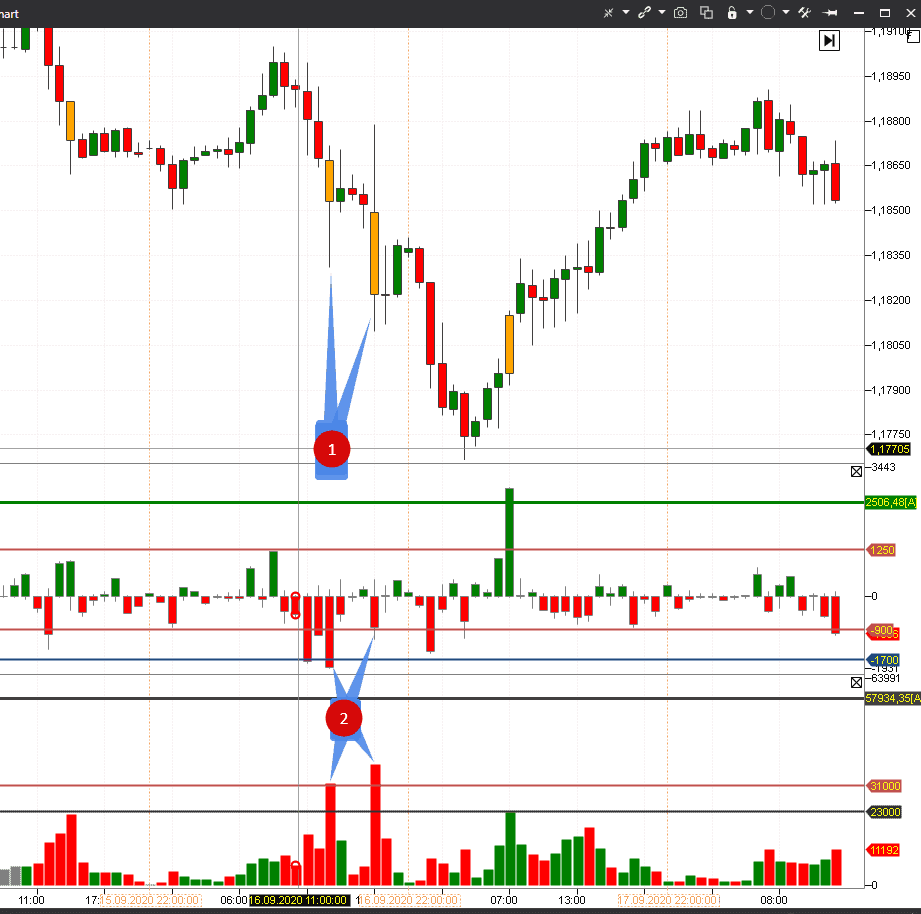
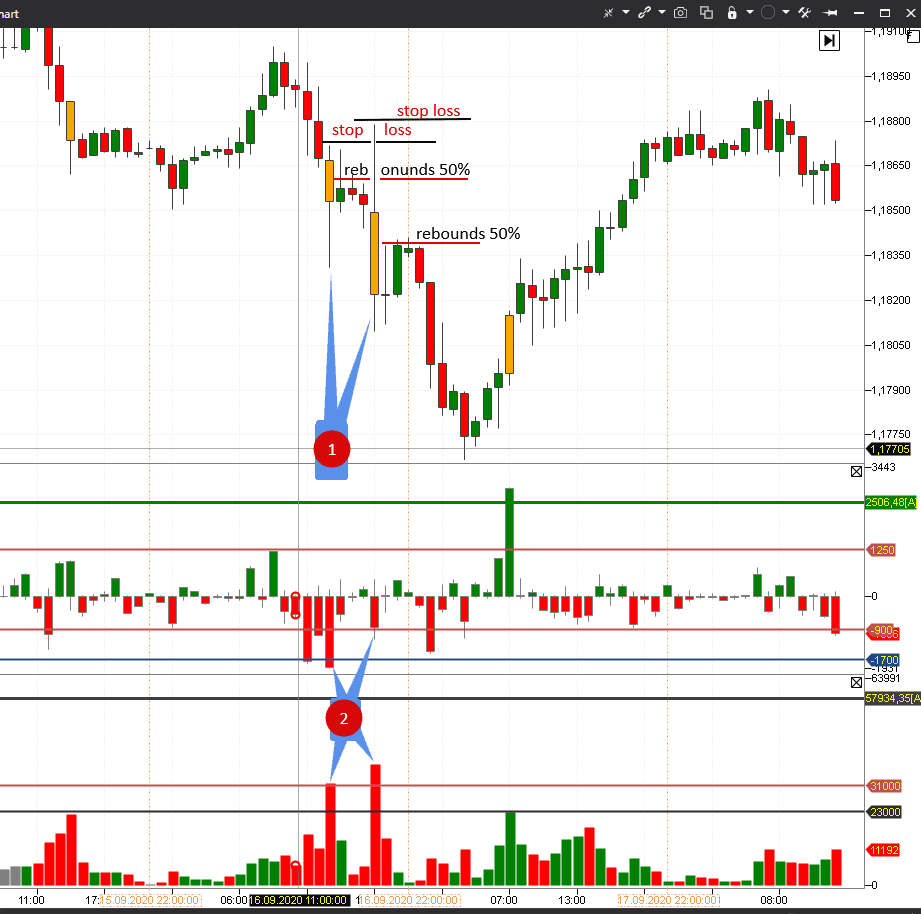
Let’s consider example 1. Candles in this chart are coloured orange with the help of the Bar’s volume filter indicator for better visualization. We set Bar’s volume filter = 23,000 and orange colour in the indicator settings.
Marks in the chart show:
- candles with splashes of values on the Delta and Volume indicators;
- splashes on histograms of the Delta and Volume indicators.
How to trade in this case? To sell or to buy? To use market or pending orders? And where to post stop losses?
We will consider answers to these questions very soon. Meanwhile, there’s one more example for mastering the pattern.
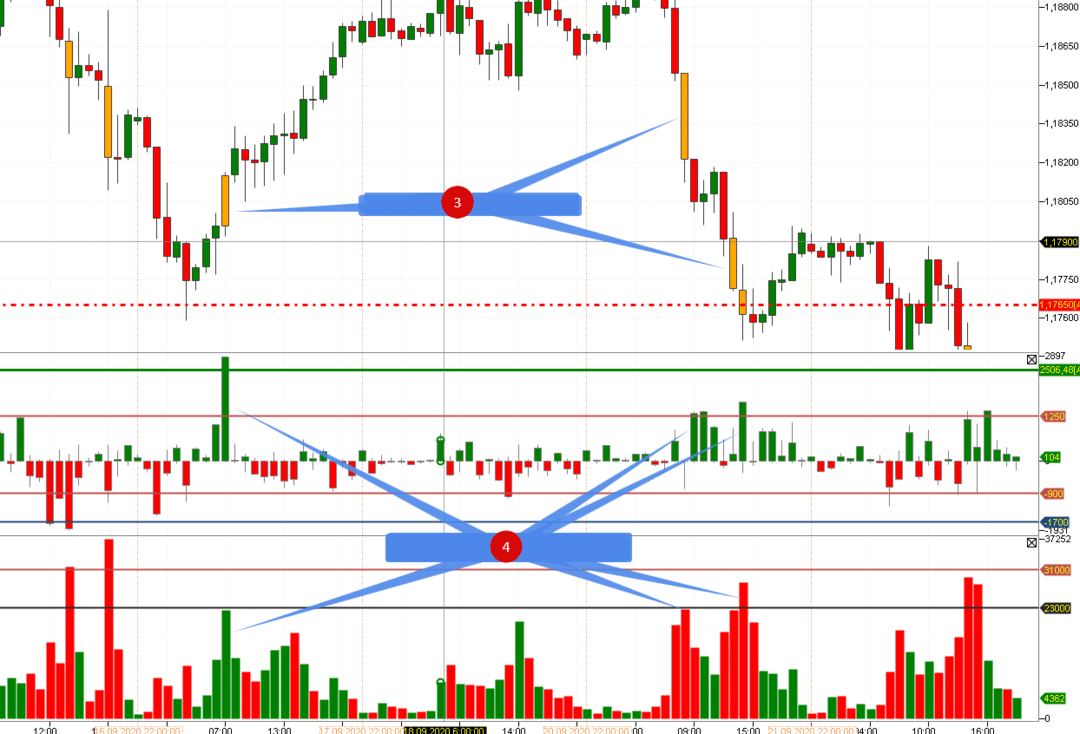
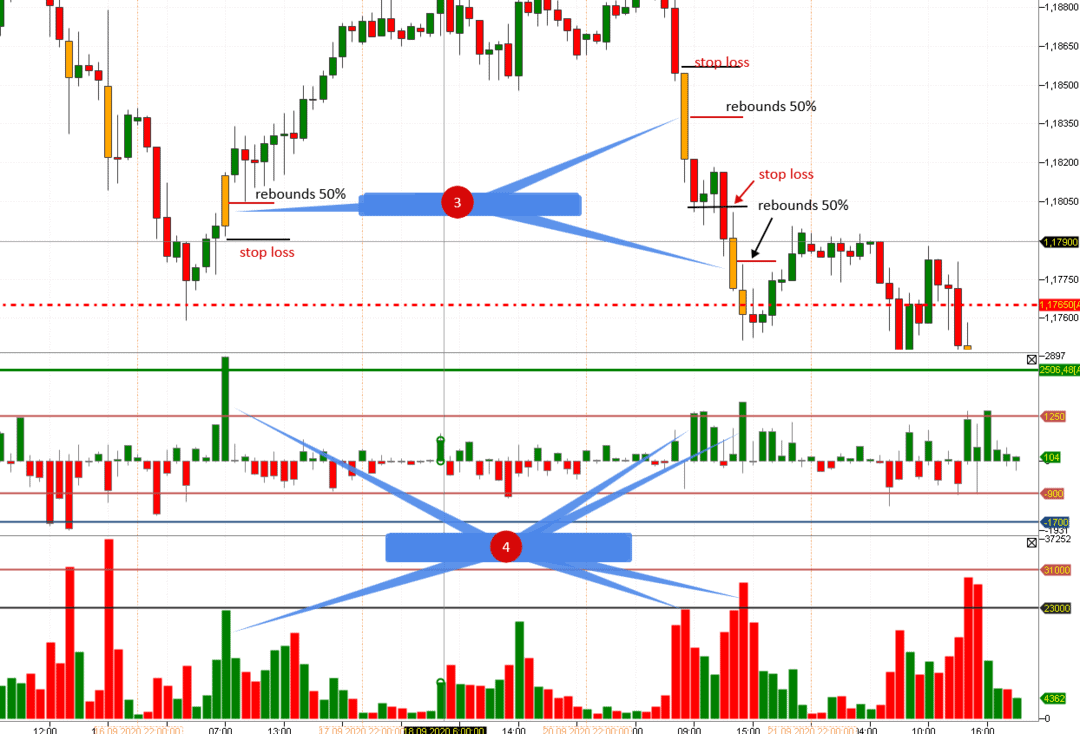
Example 2.
Marks in the chart show:
- three candles with splashers of values on the Delta and Volume indicators;
- splashes on indicator histograms. We can see a big positive Delta (from plus 1,250 to plus 2,500) on the background of high Volume bars (values 23,000 and above).
Description of trading rules
Important! First of all, we want to underline that this article doesn’t describe a trading system, which guarantees profit. Risks will always be present and you need to take your own responsibility for them. It is also important to understand that the below described rules could be unacceptable due to a unique character of every trader, his experience and preferences.
If you agree with these statements, let’s consider a variant of the market entry rules.
For example.
Sell signal:
- splashes on the Delta and Volume indicators;
- the hourly candle is descending;
- the hourly candle size from high to low is bigger than the sizes of the two previous candles.
The third item is important for entering the market, which is in the impulse.
Similarly, but with a mirror reflection for buying:
- splashes on the Delta and Volume indicators;
- the hourly candle is ascending;
- the hourly candle size from high to low is bigger than the sizes of the two previous candles.
The market entry. The ‘rebound’ technique.
Well, we know how to identify the pattern, which sends us a signal about activity of major players. How to enter the market?
Let’s consider the ‘rebound’ entry technique. In this case we will post buy limit and sell limit orders.
The pattern is considered to be formed after closing the hourly bar. After that:
- We post a sell limit in the middle of the last candle (50% level). A rebound within 50%-65% is considered to be acceptable. Only in this case, a favourable trading window ‘opens’ for profit making.
- Stop loss is above the hourly high, at which the pattern is formed.
- We do not limit the profit but the minimum one is 25 points.
We will add one more rule to increase the strategy effect. It will also help to identify how long you should hold your position.
The hourly candle, on which we entered the market, should close below the entry point after opening a short position. In the event this condition is not met, you should close your position at the market price or post the minimum stop loss of 10 points.
This is a simple and minimum condition for staying in a short position.
Conditions are similar for entering buys, but with a ‘mirror reflection’.
The picture below shows 3 candles, which send signals:
- one signal for buying (to the left) on the ascending impulse;
- two signals for selling on the descending impulse (to the right);
- delta on the signal candle could be both positive and negative.
We used red and black lines to show the levels where you should post pending orders for entry/exit.
The market entry. The ‘breakout’ technique.
As a variant, let’s consider the market entry with pending sell stop and buy stop orders. In other words, we will apply the ‘breakout’ technique.
We will use splashes on the Delta and Volume indicators as a signal candle (we described this pattern above). And then we will act in accordance with the logic:
- if the Delta is positive on the signal candle – we post a buy stop above it;
- if the Delta is negative on the signal candle – we post a sell stop below it.
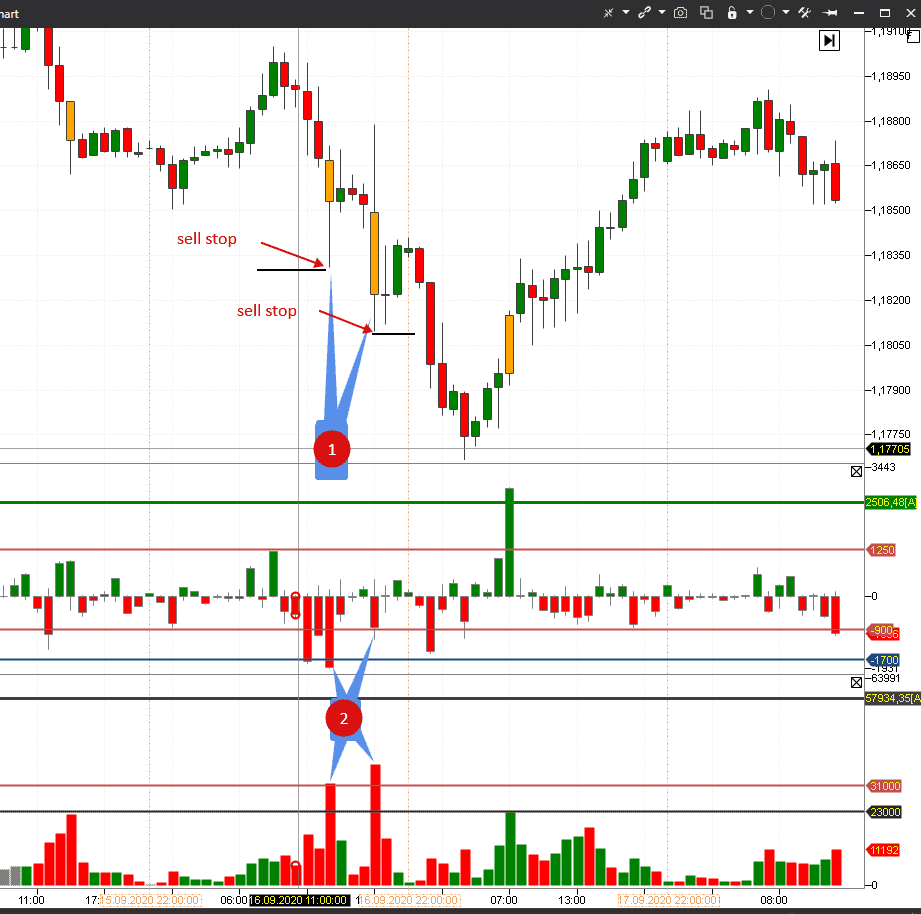
Example 5.
We identified 2 signal candles in the chart above and specified that sell orders should be posted under their lows.
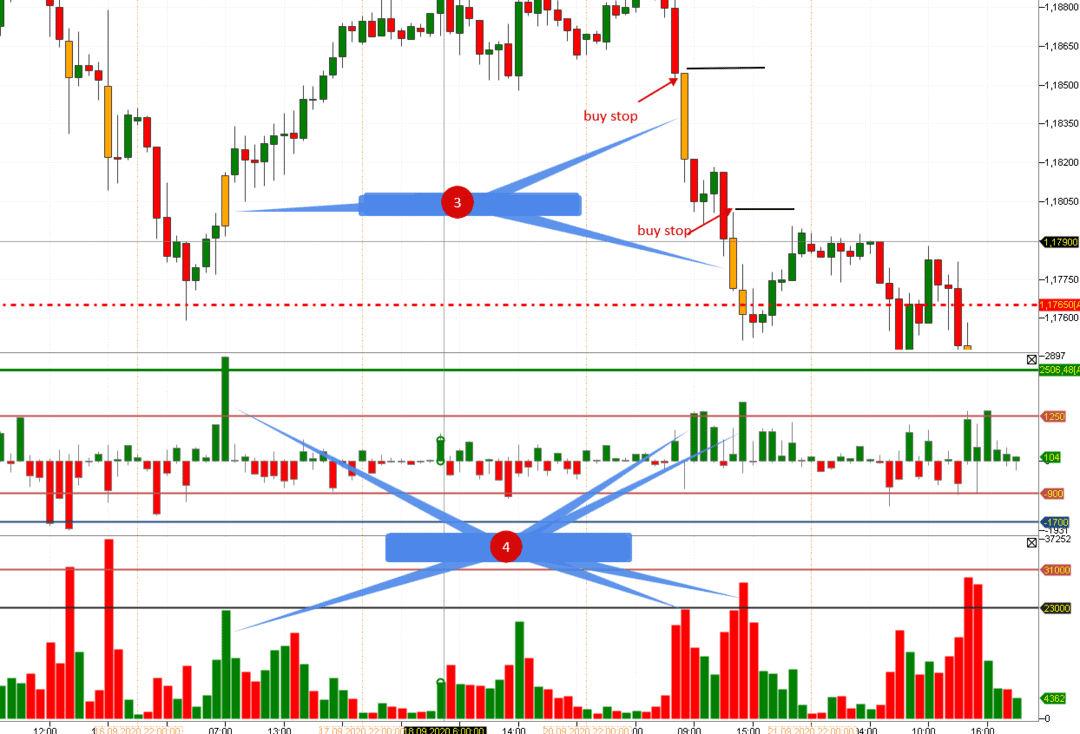
In our next example, we have a positive Delta splash. Consequently, we post stop buys above the signal candle.
Example 6.
Acting in accordance with the ‘breakout’ entry technique, we would recommend to use mathematical values for a stop loss and take profit. For example:
- a stop loss of 11 ticks;
- a take profit of 25 ticks.
Let’s add two more conditions for making the position management clearer:
- Within 5 minutes after opening a position, we should see the minimum profit of 10 ticks.
- The take profit should be activated within 30 minutes.
In the event one of these two conditions is not met, you should close your position at the market price.
Conclusions
We considered an example of building a strategy on the basis of 2 indicators – Delta and Vertical Volume. The strategy is designed to take a quick profit when the market is in the impulse.
But this is not a magic wand – unfortunately, you cannot avoid losses.
The goal of this article is to show you in practice:
- how to use indicators for strategy building;
- how to ‘join’ the impulse, caused by the major player activity;
- what risk management techniques should be applied in this event.
As a result, we described a rather rational method, which deserves your attention.
Pros of the method:
- minimalism and simplicity of the used instruments;
- trade of recurring regularities;
- use on various time-frames;
- minimum time spent in front of the trading terminal.
Cons:
- it is necessary to conduct a statistical study on the historic data for identifying the pattern indicator parameters for entering the market.
Did you like the article? Click the like button and we will try to develop the subject further and improve the strategy we described above.
Information in this article cannot be perceived as a call for investing or buying/selling of any asset on the exchange. All situations, discussed in the article, are provided with the purpose of getting acquainted with the functionality and advantages of the ATAS platform.

