From time to time, the ATAS blog gets you acquainted with the experience of profitable traders.
In this article, we will tell you what helped the SMB company to become the most famous and successful proprietary trading company in New York (what proprietary trading is).
The company experienced difficulties in 2008-2010. The market had changed, HFT algorithms were introduced, consistently profitable traders were not happy with their wages and left and Mike Bellafiore, one of the SMB founders, had family problems. In order to bring the firm back to life and help traders to improve, Bellafiore invented a new format of mentoring and work of beginner traders – the PlayBook.
The PlayBook helped SMB and, perhaps, it will help other traders.
The PlayBook is a detailed description of trading setups, which brought the biggest profit to a trader. In fact, it is a template or technique, by which a trader estimates his trades every day after the end of a trading session.
This format allows traders to minimize their weaknesses and use strong sides in trading. Successful patterns ‘establish a foothold in the brain’ and a trader identifies and trades them practically automatically.
What the PlayBook gives to beginner and experienced traders
The PlayBook helps traders to understand where their best trades are and where they make most of the money. In order to use your strengths, you need to understand what your strengths are.The PlayBook helps traders to:
- Find their best trades, improve their trading systems and believe them.
- Remove improper and loss-making trades and reduce the influence of emotions during trading.
- Increase the position size in the best setups.
- Hold the trades longer for making a maximum profit.
- Accelerate the study process and stop jumping from one strategy to another.
- Reduce the distress during trading and open trades with confidence.
- Automate your most profitable setups.
Examples of some trading setups from SMB
We give you the names of setups the way they are presented in the firm’s trader PlayBook. All beginner traders study the first three setups. They are the simplest and most efficient:- Second day play,
- Trend trend trade,
- Bullish flag trade,
- Fade trade,
- Trade2Hold,
- Pullback trade,
- Opening consolidation.
If you want to learn more, we recommend you to read the book of Mike Bellafiore ‘The PlayBook: An Inside Look at How to Think Like a Professional Trader’.
Every trade of SMB traders is executed in accordance with a certain template, that is why trading setups accumulate as time goes on and then it becomes possible to select only the best ones.
Beginner traders may use the PlayBook of experienced traders, however, blind copying would not produce good results. Any setup should be adapted to your personal qualities and strengths.
7 steps, by which any trade/setup is worked over
Step 1. The global trading picture is an estimate of the market strength or weakness at the current moment of time.
Traders assess the global trading picture by indices – for example, S&P 500. It is important to answer the following questions at this stage:
- Does the market move up, down or is it traded within a range?
- Where are important resistance and support levels?
- What drives the market and what influences traders’ moods?
Even the growing trend could be reversed by global negative news, that is why it is important to understand what takes place in the market. Any individual instrument is not traded in vacuum but is a part of the market. As a rule, 80% of stocks move in the same direction as the index does.
Step 2. Intraday fundamental analysis is analysis of fresh news about instruments, which a trader plans to trade.
You can go further and select instruments based on fresh news.
For example, there was a news on September 22 after the end of the main trading session that Yandex buys the Tinkoff Bank. The Yandex stock was up by more than 8% and the next day the stock value reached its historic high. See Picture 1.
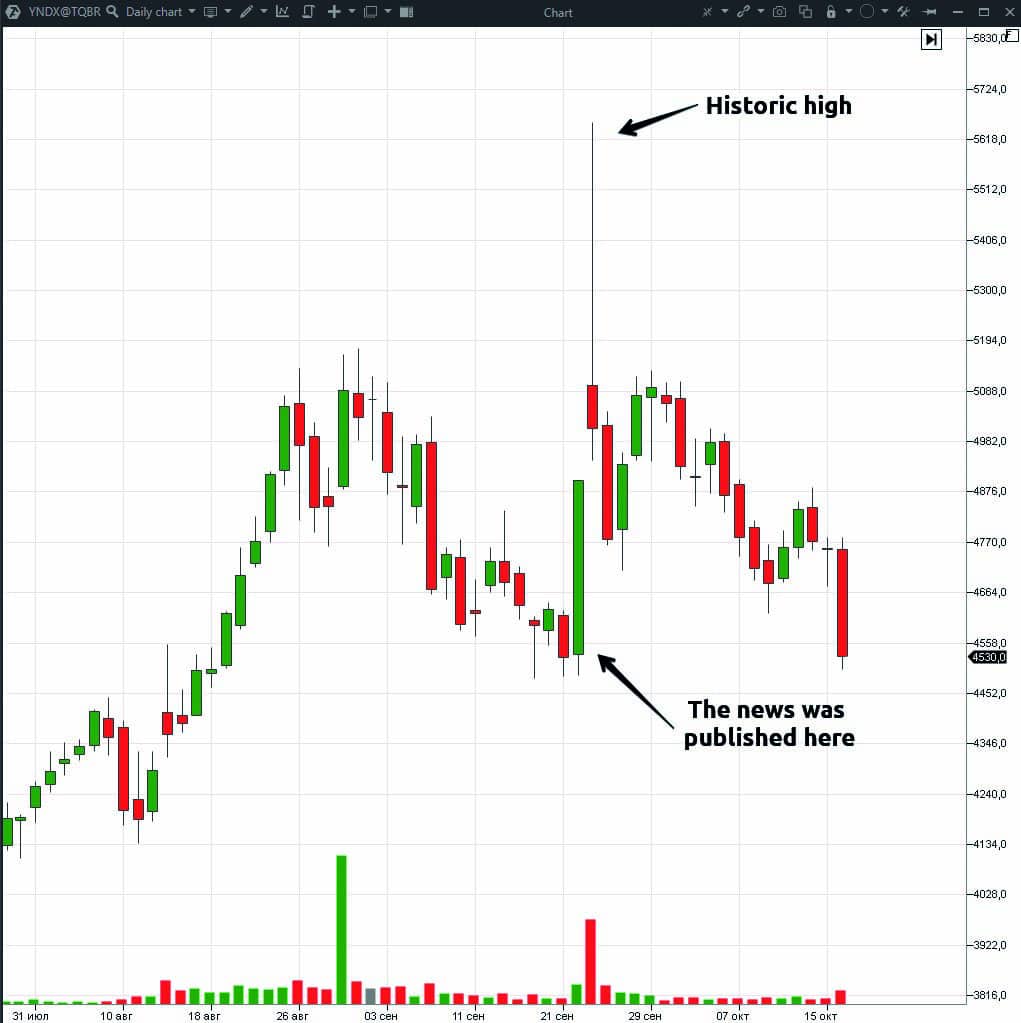
Such situations do not occur often, but you could make much more money on them than on other trades. The following types of news strongly influence the stock value: earnings reports, investigation of management activity, emergence of a new product, growth of a market share and other fundamental indicators.
Step 3. Intraday technical analysis is short-term and long-term support and resistance levels and chart patterns.
New software is developed very fast and, today, traders have additional advantages in the form of:
- cluster analysis,
- horizontal volumes,
- order flow analysis,
- HFT algorithm actions.
ATAS helps traders not only to identify significant levels but also to see in real time that these levels are held by buyers or sellers.
For example, the Cluster search indicator may help you to find clusters you are looking for inside candles by set parameters.
Let’s assume a trader analyses the 5-minute EUR futures (EDZ0) chart and wants to understand whether the price stops at the support level. Then, using the indicator, he may mark all clusters in the chart with market sells of a certain volume at the candle low. If the price cannot move further down on the next candle, it means that someone wants to hold this level. And if such situations are repeated at the support level, it means that a reversal is possible.
Clusters are highlighted in ATAS and a trader receives an audio signal when they appear in the chart. See Picture 2.
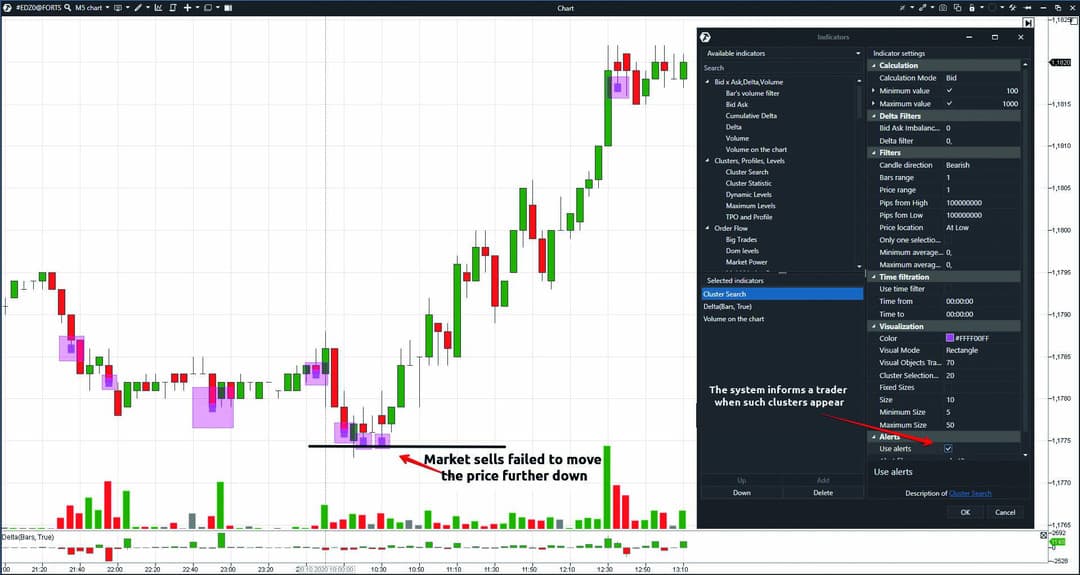
Sellers tried to ‘push the price through’ three times in our example at the trading session’s low but failed.
Step 4. Reading the Tape. It is difficult to explain in the written form how to read the Tape.
There are a number of instruments in ATAS, which help to work with the Tape:
- Smart Tape itself;
- Spread Tape;
- Smart DOM;
- indicators, which take information from the Smart Tape and highlight significant levels in the chart.
All these instruments make the work with the Smart Tape easier, because very many trades are executed and a trader can easily miss something.
For example, when working with the Tape, it is important to pay attention to the levels, which are held by limit orders. Entry into a trade at such levels has the minimum risk. We will consider an example of working with the Tape a bit further.
Step 5. Trading strategy for every setup is not a mandatory but very desirable stage. If every setup has its own clear trading strategy, it could be automated.
Step 6. Risk management and selection of a certain number of contracts. You can read about risk management in this article.
Step 7. Written review of a trade by a template. Analysis of trading by a template, carried out with a mentor or group.
Example. Setup analysis
Let’s analyse one SMB trading setup – Second Day Play. This is one of the most simple and efficient setups for traders of any training level.
It is clear from the name that trading takes place on days after publication of very negative or positive news for a certain instrument.
Trading doesn’t necessarily take place namely on the next day. The price could consolidate for some time after the trend and only then it could sharply move again. If the consolidation takes place the next day after the trend, it means that it makes sense to monitor the instrument and put alerts. The system will inform a trader with audio and video signals as soon as the price approaches significant levels.
If the instrument price changed by +/- 5% and was closed in the extreme point on the previous day, it is a good candidate for this setup.
To open a trade you need to identify beforehand:
- significant intraday levels of the first trading day;
- extreme points;
- levels, at which maximum volumes were traded.
If the instrument stays below or above one of the significant levels, you can work with it.
The global picture is important for this type of a trade, because, depending on the general market direction, you may trade more aggressively or with a bigger number of contracts/lots. If the market in general and trading setup in a specific instrument move in one direction, it creates more favourable opportunities for a trader.
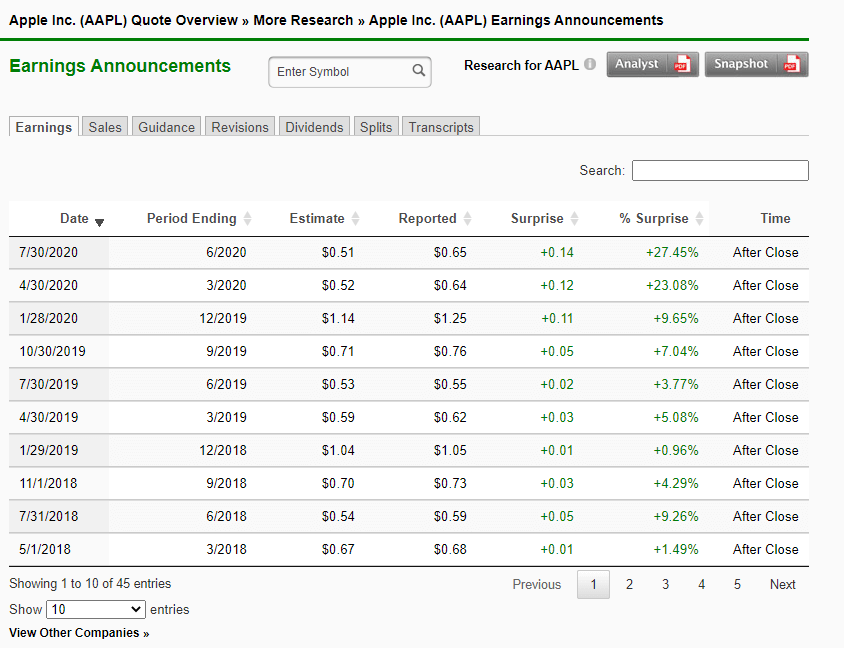
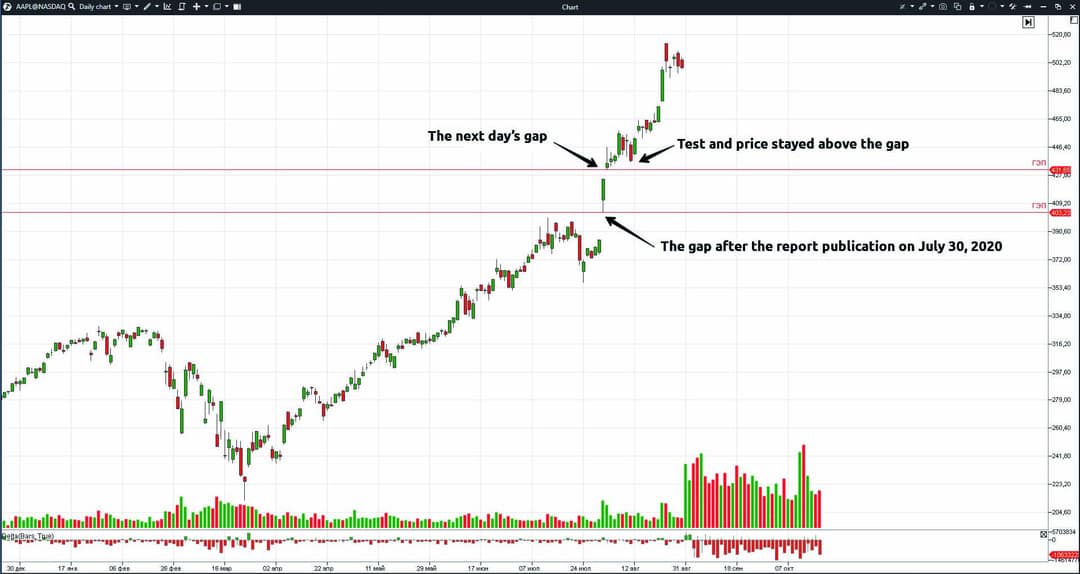
Let’s consider the Apple stock example. The earnings per share report was published on July 30, 2020, after the trading session was closed. The report was much better than expectations of analysts. See Picture 3.
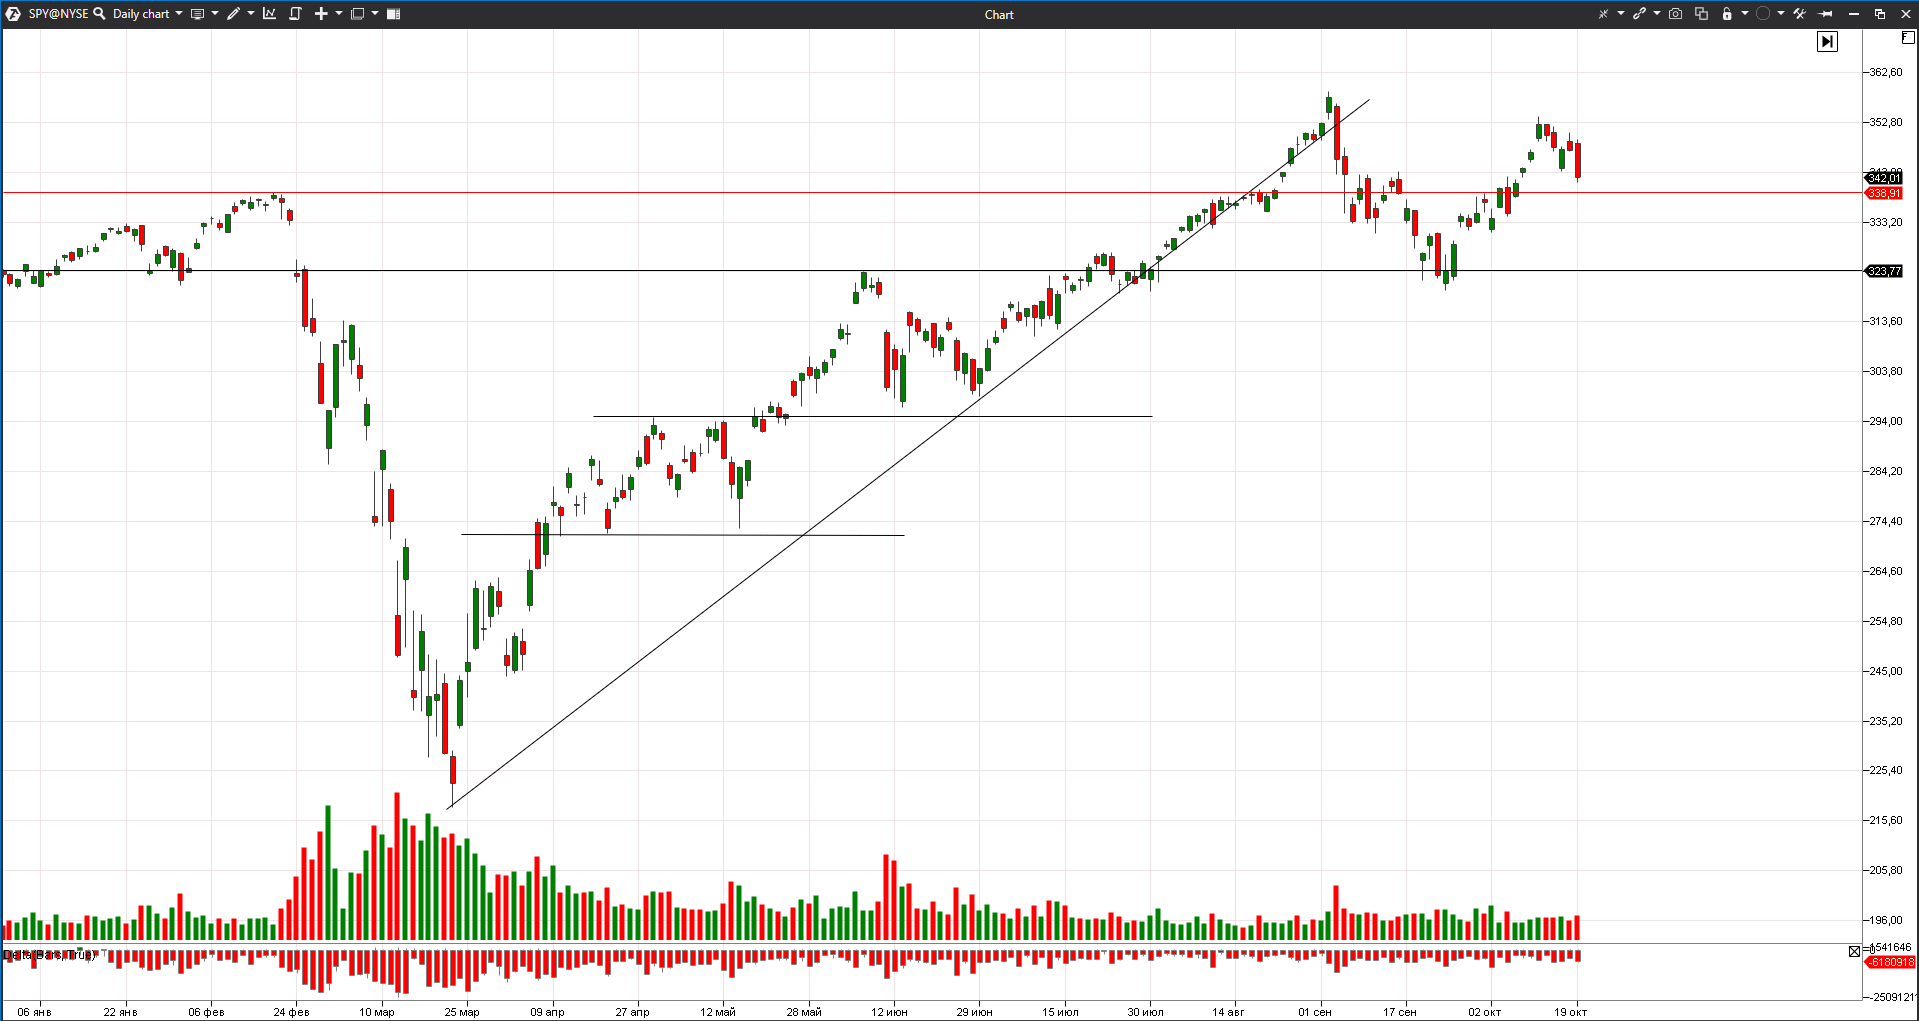
In order to assess the global picture, let’s have a look at the ETF SPY chart, which completely repeats the S&P 500 index.
S&P 500 stayed in the growing trend and was traded above the significant support level. All losses, connected with the coronavirus crisis, were practically ‘erased’. We marked the previous historic high with the red line in the chart, while we used the black horizontal line to mark the mirror support/resistance level. See Picture 5.
Now we can move to the intraday technical and cluster analysis of the Apple stock in the 5-minute chart. We added the Spread Tape, Speed of Tape indicator and Volume Profile in the form of TPO.
The Speed of Tape indicator shows levels, at which the Smart Tape accelerated. Quite often, the trade acceleration takes place at the beginning of a trading session or if support/resistance levels are broken. You may judge by the Market Profile whether the market is in balance or in a focused movement. See Picture 6.
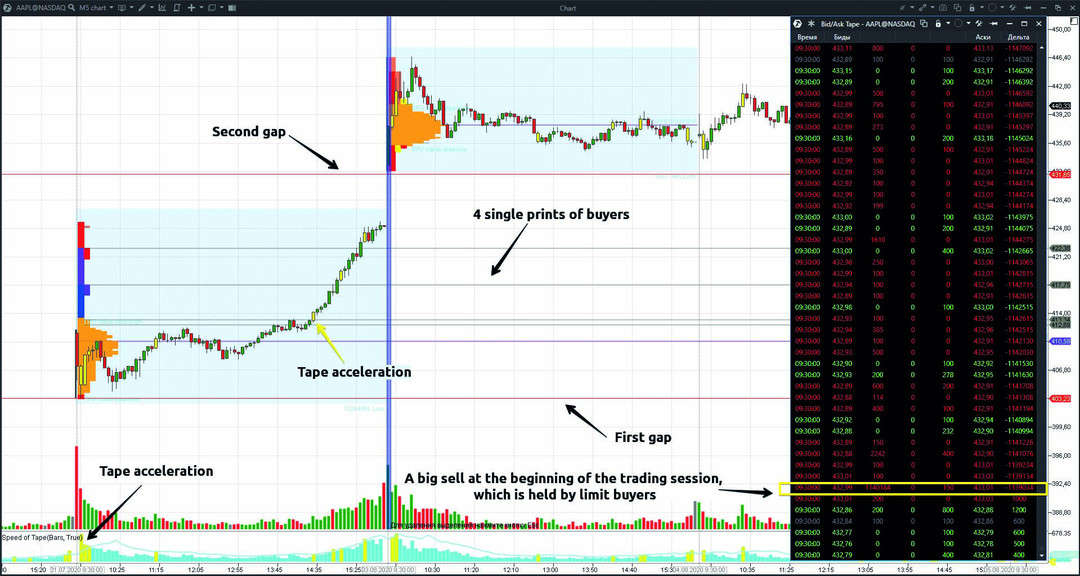
Closing at the high also confirms confidence of buyers. The further price growth could be expected taking these signs into account.
The August 3 trading session again opened with the upper gap. A big sell, which we marked in the Tape, didn’t move the price down, which means that big limit buys hold this level.
If we look at the whole Spread Tape for the first 5 minutes, we can see many market sells, but the price continues to grow, which is a sign of strength. The price starts to consolidate and volumes fall after the first trading hour. But the gap doesn’t close, that is why we may expect an upward breakout after the consolidation period.
Conclusions
Mike Bellafiore believes that every trader can achieve success if he studies and keeps his PlayBook, but his way of development will be difficult and a profit will not come at once.This is an approximate way of a trader’s development:
- Loss-making trades.
- Less loss-making trades.
- Breakeven at month-end.
- Small profit at month-end.
- Several profitable months in a row.
- Search for opportunities among especially successful trades.
- Trading only with selected setups and adding new profitable setups only after a stable profitability.
- Increasing the position size in the best trades in order to increase a general profit.
We hope that the PlayBook and trading and analytical ATAS platform will help you to pass initial stages and become a professional trader more quickly.
Information in this article cannot be perceived as a call for investing or buying/selling of any asset on the exchange. All situations, discussed in the article, are provided with the purpose of getting acquainted with the functionality and advantages of the ATAS platform.