We want to disappoint those who believe that there is some magic and secret indicator, which produces 100% of signal accuracy. There are no such indicators.
This article will help you to build a more correct approach to the use of indicators rather than looking for their settings, which will make you a wealthy person immediately and guaranteed.
Read in the article:
- Identify your own trading style.
- What are the best indicators for scalping?
- What indicators could be used for intraday trading?
- What indicators will help you in intraweek trading?
- Bonus.
- Conclusions. What to do in practice?
Identify your own trading style
You should think a lot about your own trading style before you select indicators, since the set of indicators, which would be optimal in your situation, depends on your circumstances, abilities, experience and wishes.We believe that there are 3 factors that influence selection of the trading style:
- Time.
- Experience.
- Abilities.
Let’s consider each of them in detail.
Factor 1. Time. This is the first thing you should think about. How much time can you devote to trading in real life?
It is important to understand that we do not speak here about trading 1-2 days or even 1-2 months. If you want trading to become your profession and main source of income, you will have to dedicate years and maybe even your whole life to it.
If you have some employment or do some business, most probably, you will not be able to find much time for trading. In such a case, the daily time-frame will fit you, since it requires only several minutes a day for analysis and trading.
If you have several free hours a day, you may think about intraday trading or scalping (what is scalping?).
You should also make an estimate of how much time you would like to dedicate to trading in the future and, taking it as a reference point, plan your development.
Factor 2. Experience. Your trading experience directly influences your decision on what style to select. The shorter the time-frame, the more difficult it will be.
For example, intraday trading or scalping is the task for an experienced trader, since the situation could change very fast and you should have real experience to make quick decisions frequently.
Factor 3. Abilities. Assess your physical and psychological abilities objectively. Execution of a big number of trades, which are connected with the risk of losing your capital, every day exerts pressure on the body and emotions.
You should increase your load in trading step by step, as you do it during physical training. Start from longer time-frames. After reaching a stable profit, you can start gradually reducing the time-frame and increasing a number of trades. By doing it, you will finally find your optimal trading style.
After you have started to understand what trading style you need, you can start to select an optimal indicator for your trading system.
What indicators are good for scalping?
Scalping envisages many short-term trades during a day. Indicators, which identify significant intraday levels, will help you to find such trades.You can use these levels for finding bounces and breakouts. It is important in scalping to find market entry points with a short stop loss (what stop loss is) and take small movements in several ticks. The Dynamic Levels Channel indicator can help you a lot in this.
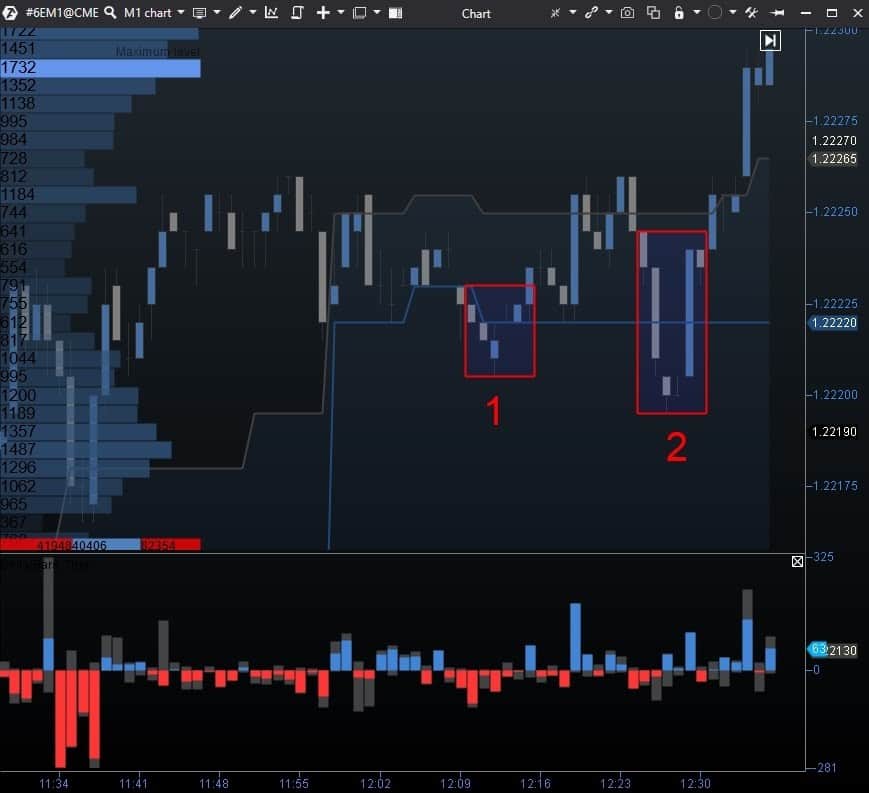
Working in the trading and analytical ATAS platform, you can load Snapshots, which is called Dynamic Levels Channel. The 6E futures chart with a loaded snapshot looks as follows:
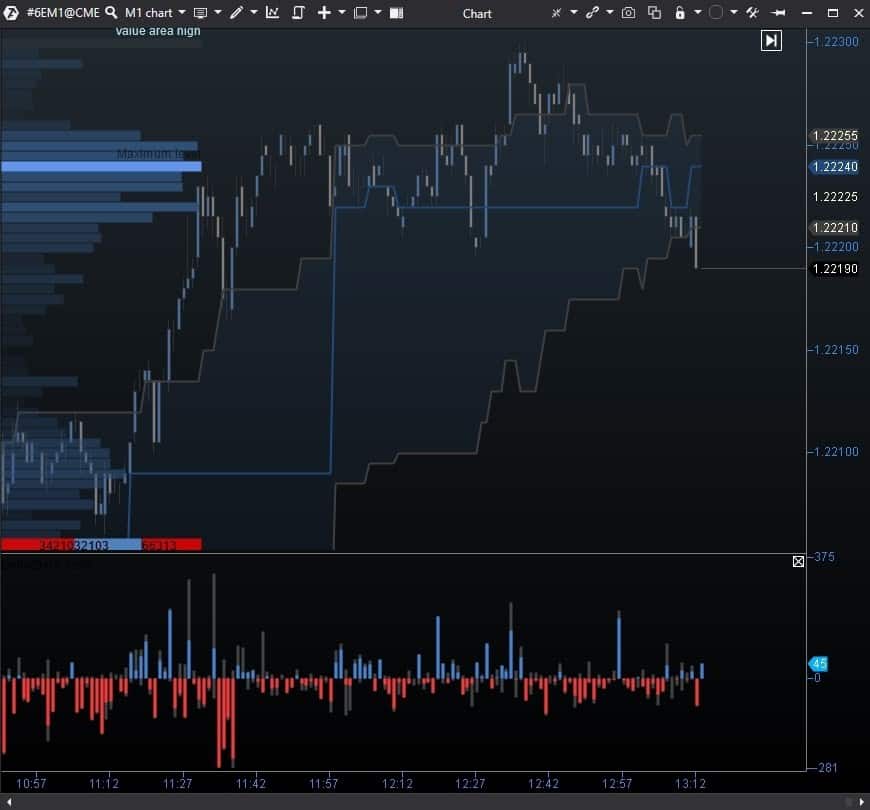
- POC – the maximum volume level for a set period,
- VAL and VAH – Value Area levels for a set period.
These dynamic levels could serve as resistance and support areas for the price and provide good market entry points. The Delta indicator, which is located in the bottom part of the chart, could help to filter out trades. You can find a good many entry points during a day on M1 time-frame with the use of this Snapshots.
Let’s consider a level breakout entry point example:
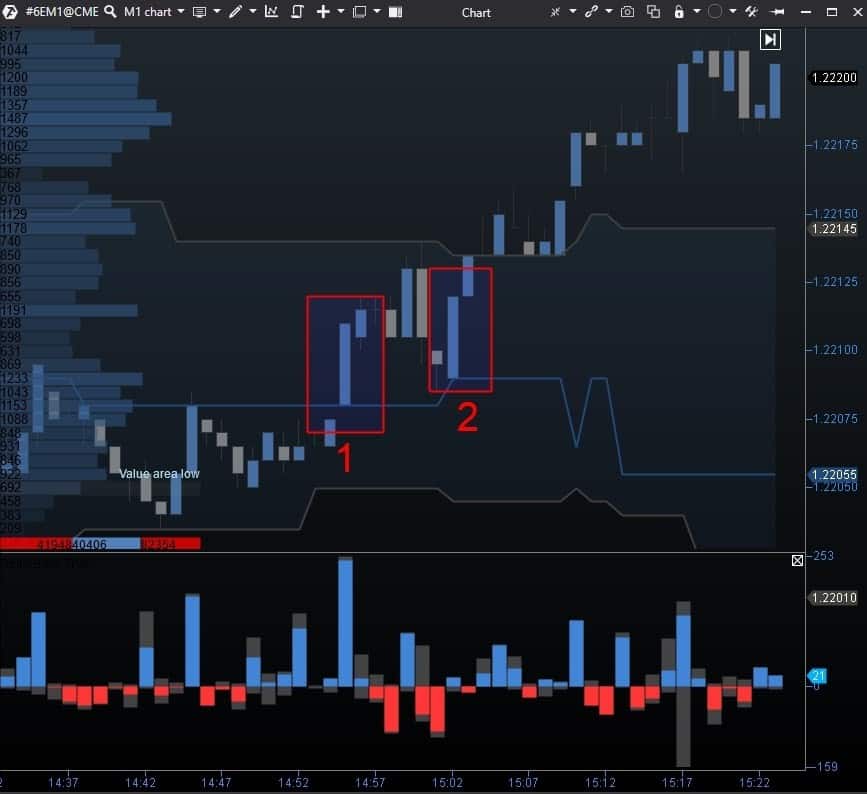
After that, a scalper can look for opportunities for entering into the market to execute a trade.
Let’s consider a level bounce example.
You should experimentally find optimum indicator parameters for every instrument, checking their efficiency on historical data.
What indicators could be used for intraday trading?
Intraday trading is calmer compared to scalping. Less trades are executed, trading signals are not so frequent but the number of trades may increase.During intraday trading, a trader may try to catch the impulse, which lasts several hours. You need longer time-frames for this, for example, M5-M15.
The Cluster Search and Big Trades indicators are good for intraday trading. These indicators show points of volume inflow into the market. You can understand who of the market participants – sellers or buyers – got into a trap based on the price reaction. These indicators can also show significant price levels for the market and stop loss activation points.
Let’s consider an example:
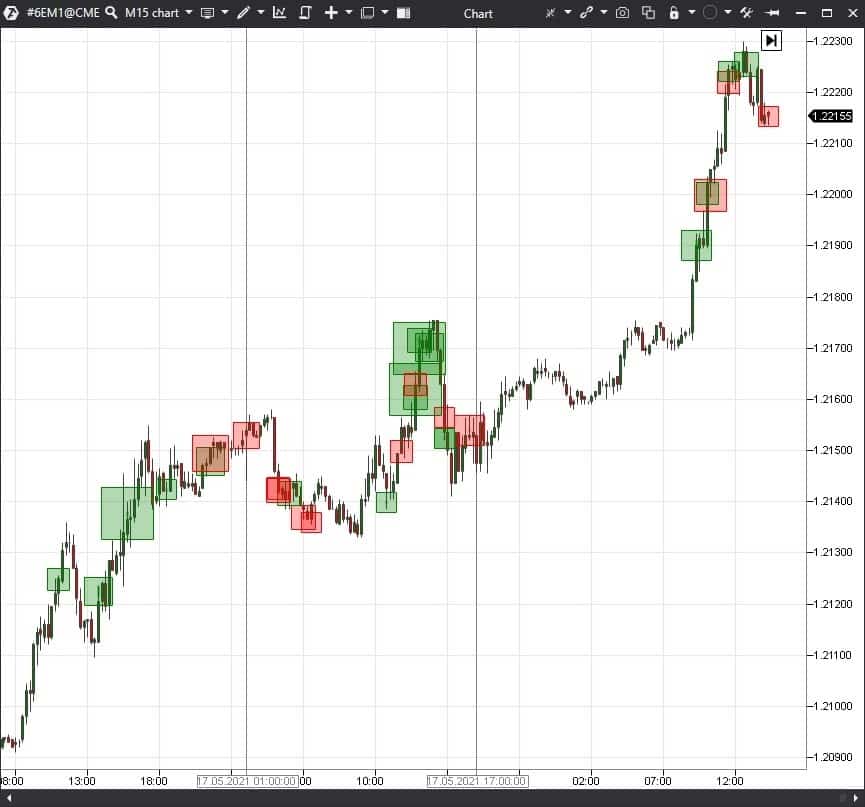
The price movement dynamics was different during these 3 days, but the Big Trades indicator clearly showed points of big traded volume, which served as the price support and resistance levels. Monitoring this indicator can help a trader to find places of correction completion and beginning of new impulses.
What indicators can help in intraweek trading?
When trading during a week, a trader tries to hold a trade for several days in order to take a strong impulse during a week. In order to execute such trades, you should analyse even a longer time-frame, for example, M30-D.The daily time-frame will take the least time and you will need only several minutes at the beginning of a day for market analysis. The TPO and Profile indicator is good for such trading since it allows analysing big volume accumulations and the price reaction to them.
Closing of a day plays a very important role in the market. There is an opinion that ‘novices open a day and professionals close it’. The Price Action trading approach deals with analysis of the price behaviour. A combination of the Price Action patterns with the Market Profile could help a trader to understand the situation better and make a correct decision.
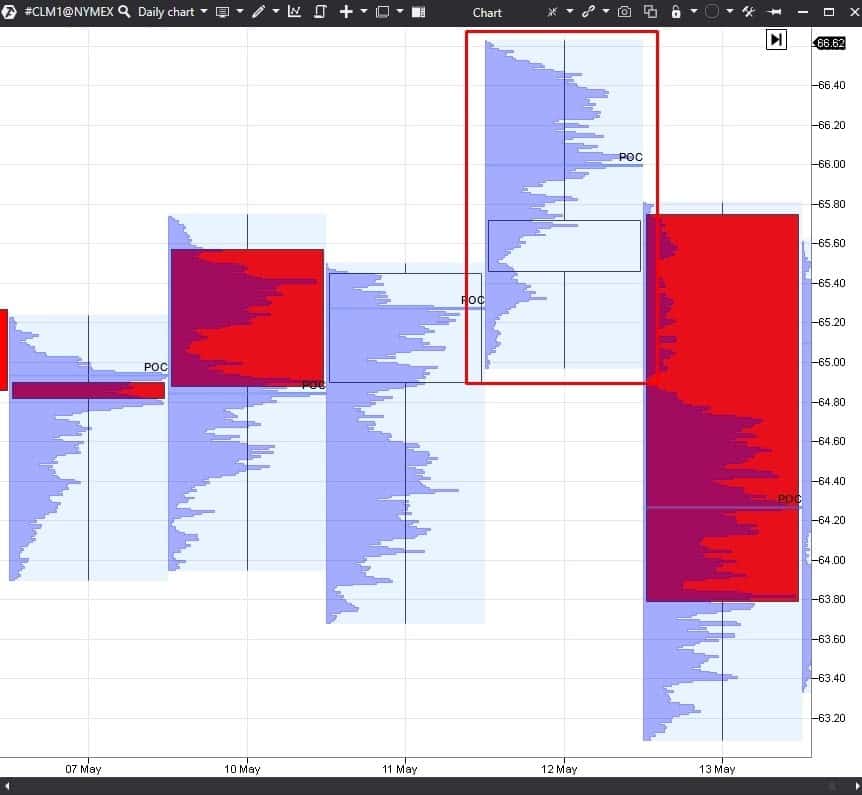
There are many various patterns but you can start with the simplest one for conducting analysis – it is a pin bar. This candlestick type is called Hammer in candlestick analysis. Let’s consider an example in the CL oil futures chart with the TPO and Profile indicator (daily time-frame).
Let’s consider one more example.
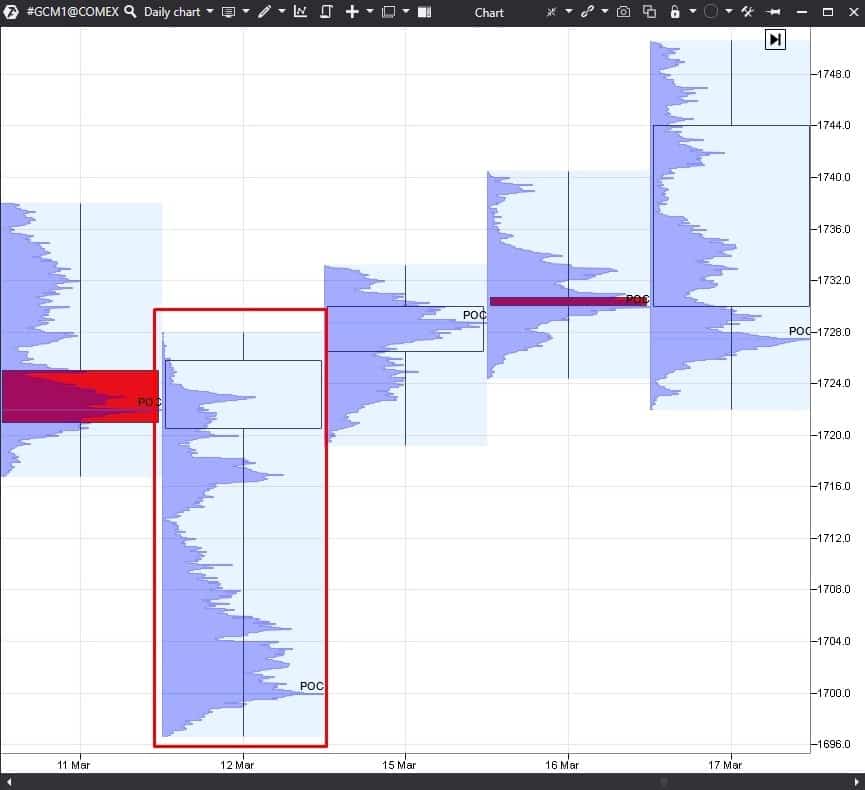
Of course, this pattern doesn’t give 100% guarantee of the further price movement direction, but the probability will be on your side if you use the Price Action patterns together with the Profile.
How to use this information in trading?
It will be easier for you to trade both during a day and on the daily time-frame when you understand in what direction the market would, most probably, move.
Conclusions. What to do in practice?
The first thing you need to do is to find your own trading style. If you have made this selection already, then you can start looking for proper indicators for trading:- The Dynamic Levels Channel indicator, which shows dynamic resistance and support levels, is good for scalping.
- You can use the Cluster Search and Big Trades indicators, which show strong inflows of volume into the market, for intraday trading.
- You can combine the Price Action patterns with the TPO and Profile indicator, which will help you to identify a probable price movement direction better, for intraweek trading.
There is no ideal indicator, but every indicator from the trading ATAS platform may help a trader to understand the market better and trade more efficiently.
Download ATAS free of charge to check how its indicators work in the markets you trade.
Information in this article cannot be perceived as a call for investing or buying/selling of any asset on the exchange. All situations, discussed in the article, are provided with the purpose of getting acquainted with the functionality and advantages of the ATAS platform.