CLUSTER CHART (FOOTPRINT) ANATOMY

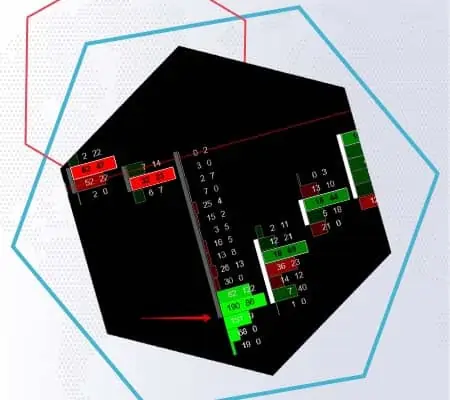
It had been impossible to imagine how a today’s cluster chart would look like before electronic trades were introduced, since exchanges and data suppliers had not provided all the required data. Today, online trading provides a completely new advanced flow of data from the exchange. Developers of trading platforms have got wide possibilities for creating […]

5 luchshih instrumentov

5 best ATAS instruments for searching for ‘managed money’

A big number of articles about trading is devoted to the subject of how to track actions of the ‘managed money’. We also wrote many times about it in our blog (for example, Catching major players in the act of doing). Despite this fact, the interest in the subject of searching for major players is […]

How to easily build significant levels with the help of the All Prices module. A step-by-step guide with chart examples

How to build significant levels with the All Prices module

Spread Tape Everything You Need to Know About Trading With the BidAsk Tape

Everything you need to know about trading with the Bid/Ask Tape

Bollinger Bands. BBands indicator

We start a series of articles about technical indicators. In this article, we will tell you about Bollinger Bands. They are better known as the Bollinger Bands indicator or just BBands.

What does Open Interest cover? Practice of use of the OI Analyzer indicator: description, settings and examples.

OI Analyzer indicator: what does Open Interest cover?

Volume profile types

Volume profile types