Main facts of the epic fall of the cryptocurrency market in 2021
35 days passed from the high on April 14, when bitcoin value was above USD 64 thousand, to the low on May 19, when the rate fell down below USD 30 thousand. Bitcoin lost more than 53% of its value during this period.
This article explains what fundamental events accompanied the bitcoin fall and the whole cryptocurrency market and how instruments of the trading and analytical ATAS platform could have helped to identify the market rate.
Read in the article:
- Coinbase is listed on Nasdaq.
- Frustration of the US Department of the Treasury.
- Elon Musk factor.
- Panic of May 19.
- Could the fall have been predicted? (Spoiler – yes).
- Conclusions.
Coinbase is listed on Nasdaq
In order to understand better under what conditions reduction from the high of about USD 64,800 started, we will provide a brief selection of headings of the main events in those days:
- April 5 – The Ripple cryptocurrency sharply grew in value, which was caused by the positive progress in the judicial hearing between the Ripple Labs managers and the US Securities and Exchange Commission (SEC) – the US financial regulator.
- April 9 – The news broke that the Grayscale trust fund (founded in New York in 2013) increased its investments up to USD 46.1 billion, which became possible due to the growing interest of major institutional investors in cryptocurrencies.
- April 10 – It was the first day when the general capitalization of cryptocurrencies exceeded 2 trillion dollars. The USD 1 trillion level was passed on January 6, 2021. Thus, it took a little bit more than 3 months to double the cryptocurrency capitalization.
Expert forecasts about the bitcoin growth to USD 100 thousand, the NFT boom and successes of ETH and other cryptocurrencies fuelled the bullish trend in mass media. The news about integration of cryptocurrencies into PayPal, Square and Visa / Mastercard payment systems was perceived with enthusiasm.
However, the main event of the middle of April 2021 was, of course, the direct listing of the Coinbase cryptocurrency stock (COIN) on the NASDAQ stock exchange.
It was known at the moment that:
- Coinbase took 11.3% of the cryptocurrency market by the volume of executed trades.
- The exchange had 56 million users, many of whom had American passports.
- Coinbase announced its general profit in the amount of USD 1.8 billion and trading volume of USD 335 billion in the first quarter 2021.
- The net profit for the first quarter 2021 was USD 730 million to USD 800 million (for comparison – it was USD 322 million for the whole 2020) and the corrected EBITDA was about USD 1.1 billion.
In such an atmosphere, the April 12-13 of the BTC/USD psychological level of 60k, under which the price fluctuated for 2 months, was perceived as a long awaited progress to the six-digit level.
However…
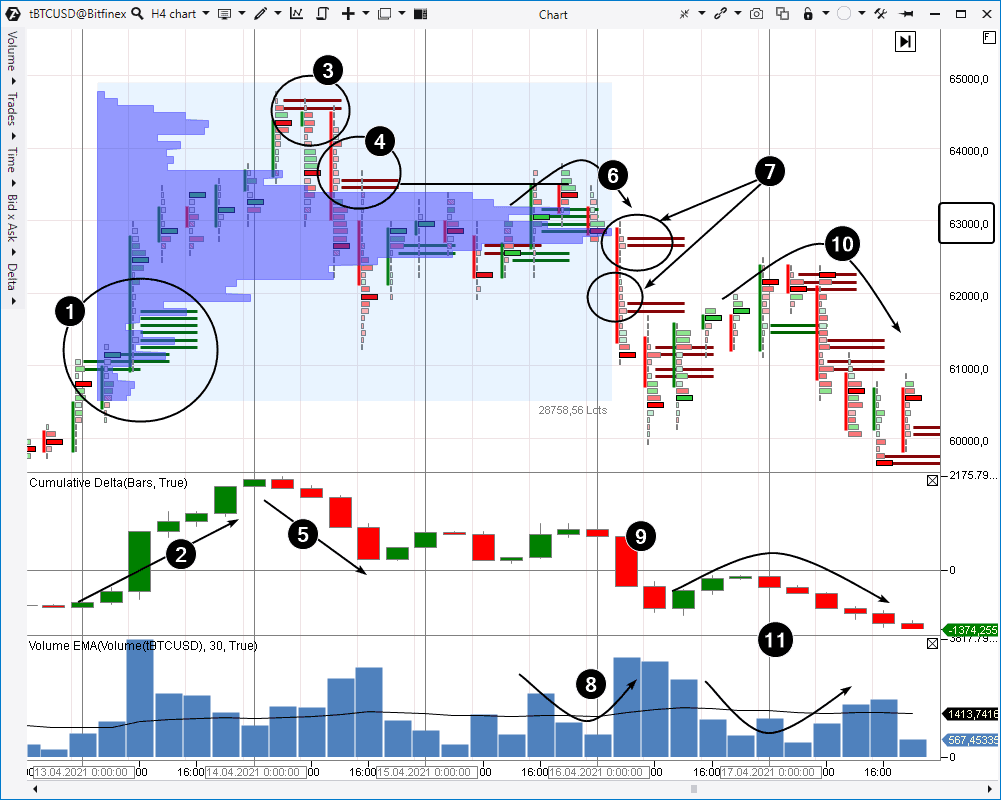
What did the cluster chart tell us? These are the data from the Bitfinex exchange. We added the Cumulative Delta indicator and Stacked Imbalances indicator, and also created an arbitrary profile for the period from April 13 to 15.
A powerful impulse took place on April 13 just on the eve of the Coinbase listing. The Imbalance indicator showed (1) superiority of buyers over sellers and the price increased along with the Cumulative Delta (2). Everything was wonderful until midnight.
On April 14 (namely on the day of listing the Coinbase stock – coincidence or not?) sellers emerged as it is seen at the first Imbalances indicator signal (3). Then there was one more signal (4). The price behaved in a clear bearish mode, finding support a bit higher than 61k (where a series of bullish Imbalances took place on April 13). The Cumulative Delta indicator also produced negative dynamics (5). This series of bearish indications should, at least, have got buyers’ attention.
After trading for some time between the strength (1) and weakness (3 and 4) signals, the price formed a balance in the 63k area as we can see it from the bulge (Point of Control) on the Profile indicator.
Where will the price move in the search for a new balance? It was an important intrigue and the volume analysis instruments helped to ‘foresee’ its solution.
The up movement in the second half of April 15 looked promising for bulls, because it started on the volume growth (6) and with the positive Delta.
However, then something, which could be interpreted as the Imbalances level test (4), happened. The price increase slowed down and volumes decreased as if the market freezed up at pause. We can see a more large-scale volume growth (8) at the next price decrease, which tells us about a powerful domination of sellers. It is confirmed by the Imbalance (7) and Cumulative Delta (9) indicator signals.
The chart provided important facts to believe that the balance around POC=63k was broken in favour of sellers and the price started to look for a new balance, which is located somewhere below. The market pointed (by its action) to a more probable bearish development of events.
However, POC was tested before that. Bouncing from the 60k support on April 16, the price increased to 62k and even a bit higher, where aggressive sells started again, which we can see by the indicator values (10 and 11).
Thus, the breakout of the 60k resistance, which investors in cryptocurrencies waited for during 2 months, was false. The price started to decrease below 60k, entrapping those who entered in a long on the background of positive news and local bearish impulse.
‘I will tell you the secret to getting rich on Wall Street. You try to be greedy when others are fearful. And you try to be fearful when others are greedy.’ Warren Buffett.
Frustration of the US Department of the Treasury
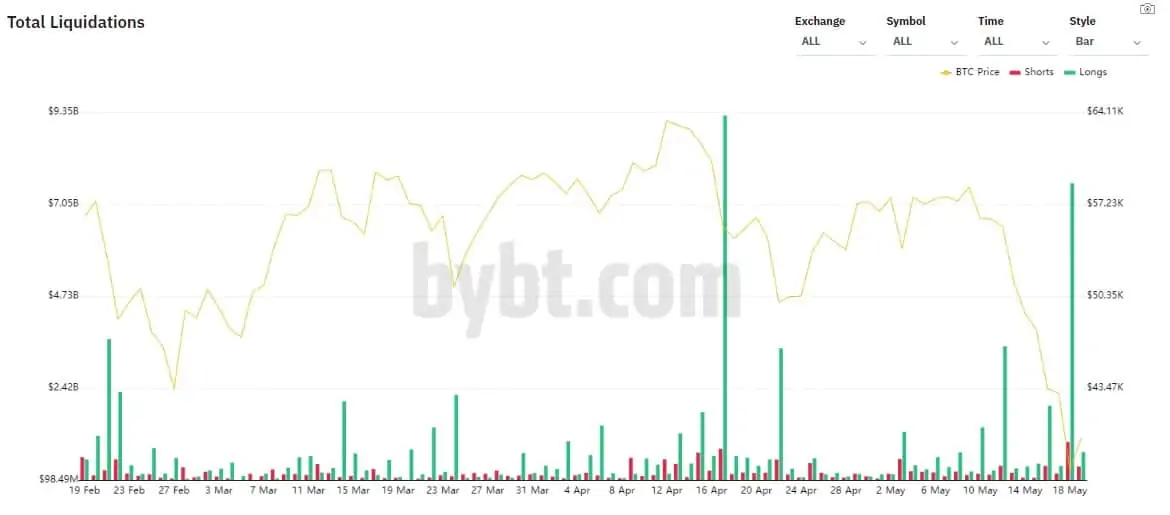
The BTC/USD rate decreased to about 51k during cryptocurrency trading on April 17-18 (Saturday-Sunday). A service, which monitors cryptocurrency trading by analysing the blockchain network, affirmed the largest liquidation of long positions (the biggest green bar in the histogram below).
Perhaps, those were losses of investors, who bought cryptocurrency on the background of positive news about the Coinbase listing. It looks like their demand led to the Open Interest peak on the cryptocurrency exchanges on April 14.
The decrease was 20% from the high of USD 64,800 to the low of April 18 (Sunday).
They wrote in mass media that the bearish rumors from the United States were the main driver: as if the US Department of the Treasury, headed by Janet Yellen (the former Federal Reserve chair), prepares claims against financial companies due to the bitcoin use in the money laundering schemes. However, there were no official announcements. It was also unclear what companies will be accused and in what schemes. Anyway, the rumors were sufficient for the market to be seized by a wave of sells.
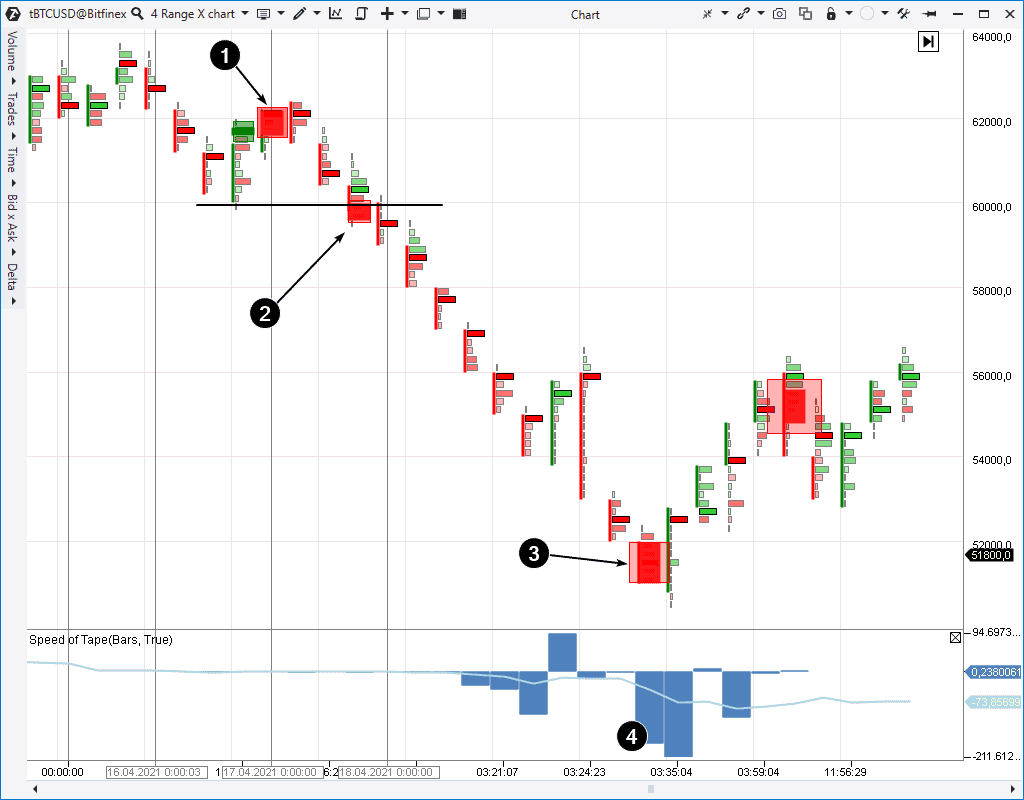
We added the Big Trades indicator and also Speed of Tape indicator in the Delta mode to the cluster chart below (frame = Range X), in order to show how the selling wave developed on April 17-18.
A series of big sells was registered in point 1 at the very beginning of the fall. Point 2 shows efforts of the sellers at the breakout of the 60k psychological support.
Red clusters show superiority of sellers over buyers during a majority of bars on the wave of sells on April 17-18, which reached its climax after the price moved below the 52k level. We can see how the Big Trades indicator worked (3) and the Speed of Tape indicator reached an abnormal rate of sells, which was nothing else but a panic.
Events of April 14-18 were a crucial point. After the Coinbase stock listing euphoria was sharply replaced by the unseen for many months wave of sells, it endangered the whole growing trend of the bitcoin price, which started in 2020.
Elon Musk effect
When analysing the chronicle of the cryptocurrency market fall on May 19, we cannot fail to mention the Tesla and SpaceX Head Elon Musk and his Twitter with 55 million (as of May 2021) subscribers. An expert study was carried out in February 2021, which confirmed the availability of a strong correlation between the Musk tweets and cryptocurrency rates.
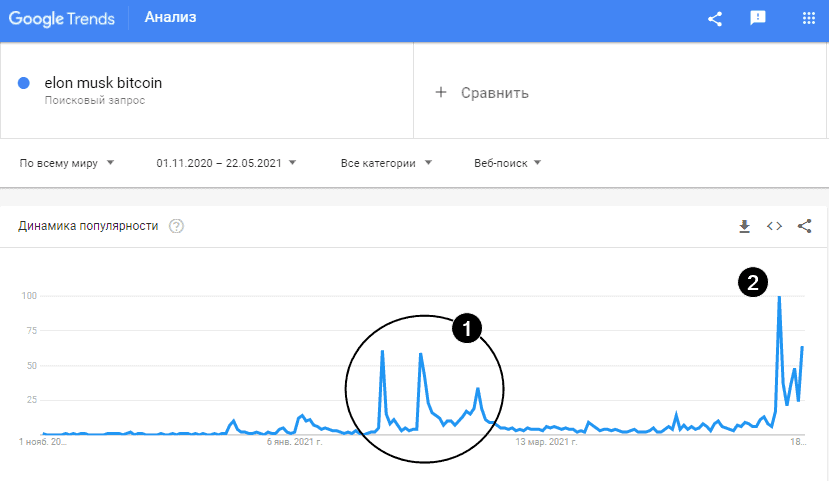
The Google Trends data confirm that there were 2 periods during January-May 2021 when the global network actively discussed Musk’s tweets about bitcoin.
Number 1 covers the first period consisting of 3 tweets when:
- On January 29 Musk added the #bitcoin hashtag to his Twitter profile. The cryptocurrency rate responded to it with up to +19% jump;
- On February 9 it became clear that Tesla invested USD 1.5 billion into bitcoin. It was also announced that Tesla plans to sell electric vehicles for bitcoins (these plans became a reality on March 24). This news helped BTC to rise to a new height approaching the 50k per coin level.
- On February 23 Musk tweeted that the bitcoin price seemed to be too high. As a result, the TSLA stock fell by 6% and bitcoin rate fell by more than 20% during 2 days. As a result of this tweet, Musk is not the richest man on Earth any more.
Number 2 covers the period when negative (for bitcoin) news started to appear (all of a sudden?) in the Musk Twitter. It’s interesting that it happened half a month after the bearish change in the BTC/USD market behaviour, which we described in the previous section.
On May 13 Elon wrote that Tesla stops accepting bitcoins as the means of payment for its vehicles because the coin mining is very dangerous for the environment (as if it was unknown when Tesla announced its decision to accept bitcoins).
The bitcoin price reached USD 45,900 on the peak of its fall on May 13 – the lowest level for more than 2 months.
From bad to worse, Elon started to blame bitcoin, supporting, at the same time, ‘his favourite’ meme-cryptocurrency – Dogecoin.
On May 16, answering a tweet of the @itsALLrisky user, Elon said that bitcoin will lose to the Dogecoin cryptocurrency ‘with hands down’, for which it is necessary to reach the progress in the Doge blockchain by size and time of the block in 10 times and reduce the commission in 100 times.
Musk’s opinion was immediately criticized. The BlockTower Capital founder Ari Paul blamed him, answering: ‘Bitcoin is slow and expensive because its priority is decentralization and safety’.
The MicroStrategy founder Michael Saylor also blamed Musk, writing: ‘The world needs a decentralized, safe and deflation storage of value, such as #Bitcoin, more than in a more centralized, less safe and inflation exchange environment, which you described above’.
The discussion grew up. Answering Peter McCormack, the host of the What Bitcoin Did Podcast, who called the billionaire’s support of the Doge token-meme ‘the ideal trolling’, Musk wrote that such topics were ‘unpleasant’ and it spurs him to risk it all with Doge.
The users started to suspect that Tesla dumped bitcoins. Musk answered with the meaningful ‘Indeed’, which made suspicions even stronger.
Later, Musk informed that Tesla didn’t sell bitcoins, but it supported the price, which was in the state of uncontrollable fall during May 15-19, only for a short time.
The bearish impulse was aggravated by the news from China, the Central Bank of which declared that cryptocurrencies cannot be used for the payment for goods and services.
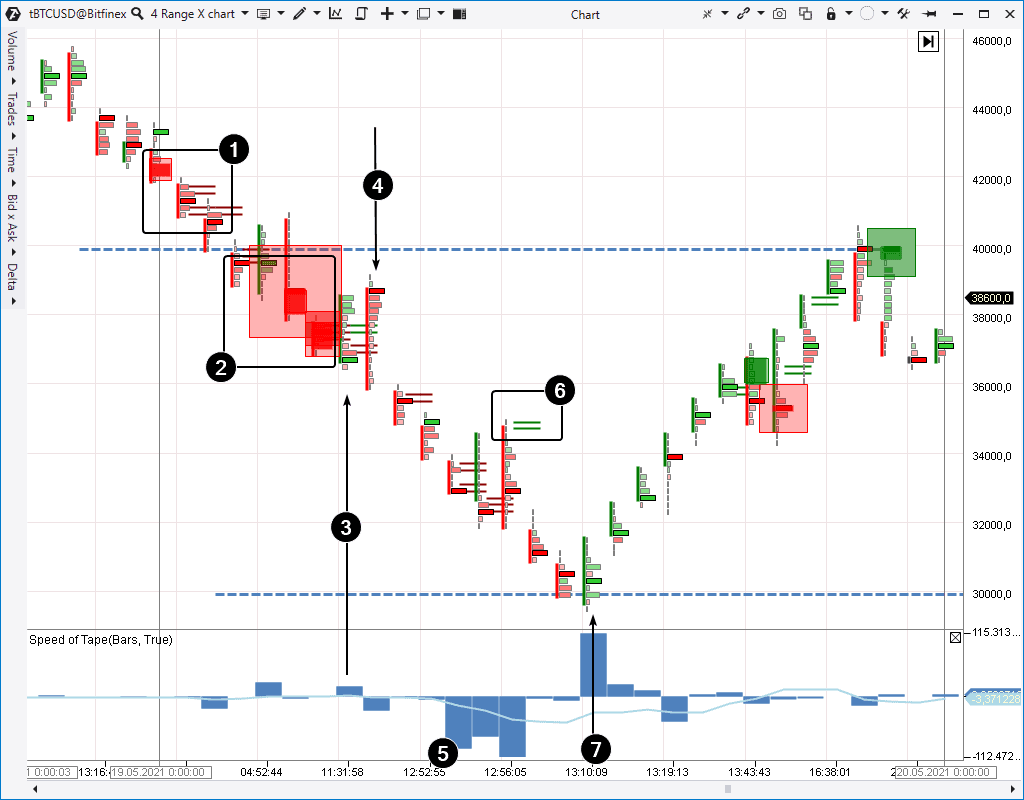
Look at the chart attentively. Accurate and powerful ATAS platform indicators help to track the course of the fall on May 19.
Number 1 shows the sellers’ pressure growth, which can be seen by the Big Trades and Stacked Imbalances indicators. It was an ‘acceleration’ before the breakout of the psychological support of USD 40 thousand.
After the price fell below 40k, there was a certain panic (2), but the effort to recover (3) didn’t attract the followers and the sellers that emerged at the USD 38,800 level (4) renewed the sheer fall.
Buyers tried to buy after the panic (5) and a bounce from 32k, but got into a trap (6).
A major buyer emerged (7) only after a short penetration under the psychological level of 30k and saved the situation. A huge splash of demand, which can be seen on the Speed of Tape (Delta Mode) indicator, formed the basis of the market recovery, in the course of which the bitcoin price epically returned back to the USD 40 thousand level.
Could the fall on May 19 have been predicted?
It’s rather ‘yes’ than ‘no’.
The cryptocurrency market was extremely overbought. Its capitalization increased from USD 300 billion to USD 2.5 trillion (more than 8 times!) in just a half a year, from November 2020 to May 2021. The fast-paced bullish trend attracted the capital of a lot of private and institutional investors, who were ready to take risks in order to make a profit.
A large-scale retracement was brewing.
Let’s address the volume and price analysis basics in order to find confirmation of its approach. We will conduct comparative analysis of the interrelation using 2 periods:
- the famous peak of the end of 2017 – beginning of 2018;
- the peak of April-May 2021.
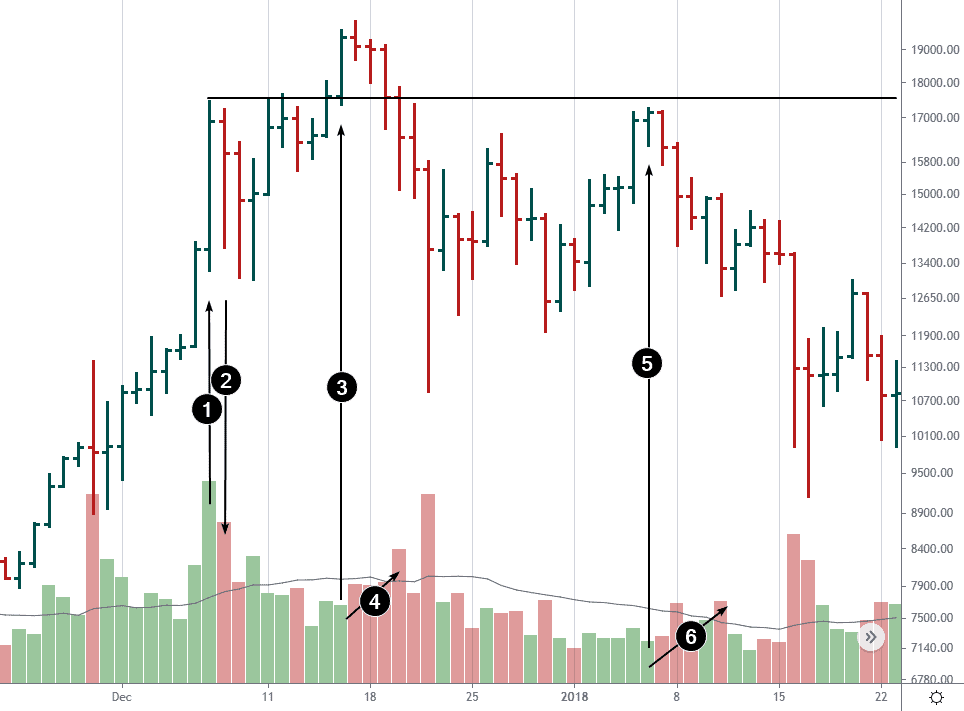
Period 1. The picture below shows averaged data on prices and volumes from cryptocurrency exchanges for the end of 2017 – beginning of 2018. We remember those days because the bitcoin price approached the psychological level of USD 20 thousand, which was accompanied by the increased public attention from all over the world and the ICO boom.
Note the volume splash.
The bitcoin price increased especially fast on December 7 – from USD 13,600 to USD 16,900 – by more than 25% (this bar is marked with arrow 1). It is important that the maximum trading volume was registered on this bar, which gave experienced traders, who use volume analysis, a cue that a buying climax took place.
There was a sharp price reduction the next day on December 8 (the bar is marked with number 2). The quotation reduced down to USD 13,700 during the trades on December 8. Judging by the bearish progress and high activity (expressed in a higher volume), it could have been assumed that major sellers entered the market. It confirms the idea about the buying climax on December 7. That is why we drew a horizontal line from the reversal high of December 7-8 (around USD 17,400), in order to track the market behaviour when (and if) the price approaches this level in the future.
The first approach took place on December 11-12 (it is not marked with an arrow), when the volumes were low, compared to the previous 5 days activity. It was a sign of a probable reduction of the buying pressure (demand deficit).
The effort to break the December 7-8 highs is marked with number 3. However, please, note the volumes – they are low, which is not typical for buyer efforts. As a consequence, the volumes started to grow on the next reduction (4), which was the bearish market sign. The buyers were shocked on December 22 by the reduction below the 11k level.
One more approach (5) to the December 7-8 highs’ level took place on January 6 and we again observe the volume reduction of the price growth. This is a demand weakness sign, which is confirmed by the volume increase, which means the pressure of sells (6). The chart, as if, tells us that USD 17,400 is too much for one coin. In the result it led to a long-term decrease of quotations down to USD 3,100 per bitcoin in December 2018.
The buyers managed to overcome the USD 17,400 level only in November 2020.
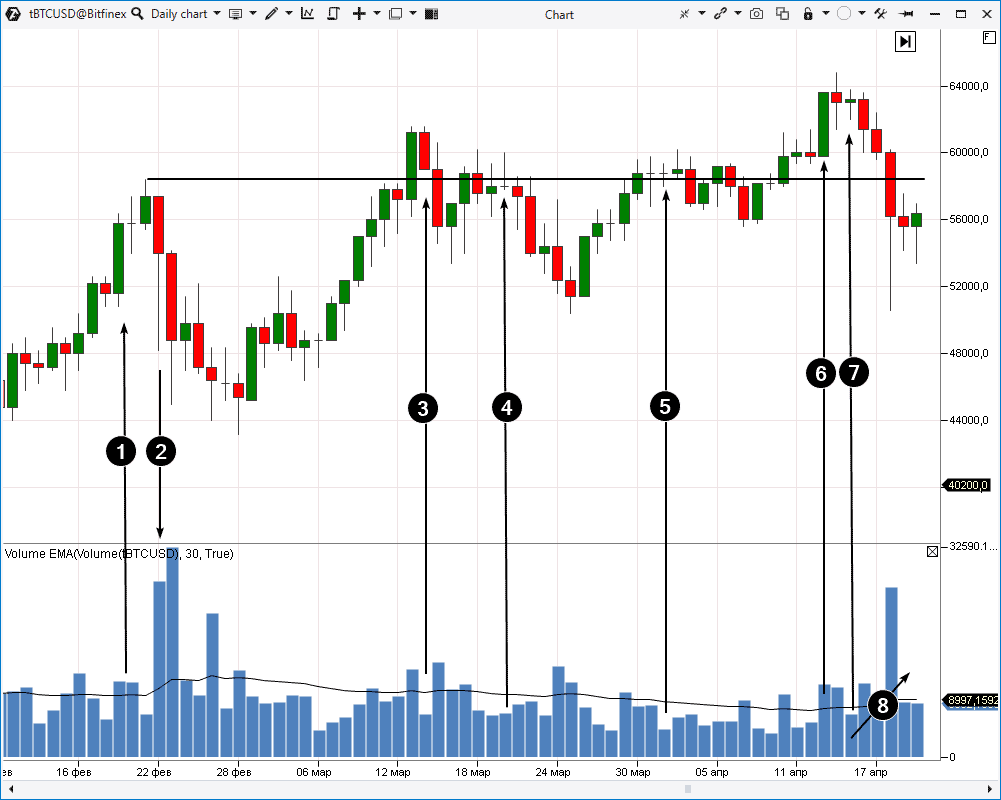
Period 2. Let’s have a look at the chart of the end of winter and beginning of spring in 2021. The data are from the Bitfinex exchange (daily period).
Let’s build a horizontal line from the February 21 high at the level around USD 57,300 and try to find common features.
In general, we see a similar situation with the main difference that on February 19, when the price fastly grew from 51.5k at the opening up to 56.3k at the high, average volumes were registered, which is not typical at all for a buying climax.
However, the further dynamics of the price and volume interaction is very similar to what took place in 2017-2018:
- emergence of a major seller (2);
- demand weakness on the breakout effort on March 14 (3). The price decrease the next day, along with the volume growth, confirms the bullish pattern of the market behaviour;
- low trading activity on the days marked with arrows 4 and 5, most probably, could also be interpreted as a deficit of buyers at the market peak.
Then we observe formation of a peak near 64k:
- breakout effort (6);
- demand weakness (7);
- seller pressure, which is seen by the price decrease at the growing volume (8).
We already described the formation of this peak above.
Conclusion
A thorough study of exchange charts could help you to make more objective decisions and be proactive without spending your resources on a gigantic flow of news, which is very difficult to follow.
Download the trading and analytical ATAS platform. Use its powerful instruments to:
- track the cryptocurrency market panic development on May 19, 2021, in more detail;
- study the indicator application in the course of volume analysis;
- use the obtained knowledge and discovered regularities for making profit from exchange trading of not only cryptocurrencies but also futures and stocks.
Information in this article cannot be perceived as a call for investing or buying/selling of any asset on the exchange. All situations, discussed in the article, are provided with the purpose of getting acquainted with the functionality and advantages of the ATAS platform.

