Tag Archive for: Delta in trading

Кумулятивная Дельта

Cumulative Delta Analysis

We devote this article for beginners to the Cumulative Delta. Why is it important? Why is it useful? What are specific features of the Cumulative Delta application for trading on the exchange? Read in this article: what the standard Delta, Bids and Asks are; what the Cumulative Delta is; what the Cumulative Delta shows; how […]

What is delta?

Delta and Cumulative Delta: how could they help a day trader?

The Delta term was introduced into trading in 2002 when the revolutionary Footprint chart was developed. Overall distribution of information technologies and the Internet, which also affected the trading sphere, served as an impulse for it. Namely at that time access to the data about real trading volumes on the exchange ceased to be a […]

HOW TO READ THE ORDER FLOW

HOW TO READ THE ORDER FLOW

We will discuss the basics of the topic in this article. This information may be well-known to some readers. But if you’ve got acquainted with ATAS recently only, this article will help you to figure out what to start from. Can you forecast the weather by clouds, pressure, and air humidity for a week? Or […]

How to analyze “Weis waves” with ruler and delta indicator

How to analyze “Weis waves” with ruler and delta indicator

After publication of the article about trading with the Weis Wave Indicator, we noticed your interest in this definitely engaging subject. That is why we decided to analyze some more relevant charts, which can be of interest to you.

End of Rising Market и Bag Holding

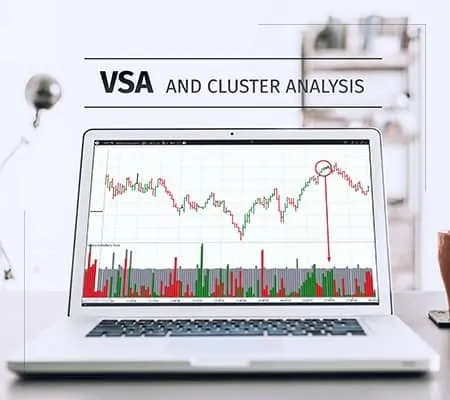
VSA and cluster analysis. The End of Rising Market

This is the first article in the series of publications in the ATAS blog on the VSA and cluster analysis topic. What is VSA? VSA – Volume Spread Analysis – is a universal approach to assessment of the strength and weakness of the market on the basis of analysis of the price and volume action. […]

Range bar charts. How to analyze the delta and footprint in the ATAS platform

Range bar charts. How to analyze the delta and footprint

How to use a cluster chart with an application of such a non-standard chart type as Range Bars? Try Range Bars if you cannot select a convenient timeframe. In this article we will analyze a footprint, built in the Range Bar chart, and you will see how useful it is to look at the same […]