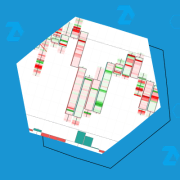

The hammer pattern in candlestick analysis is a candle with a narrow body and a long lower shadow. It is believed that a proper hammer appears after a downtrend and indicates the end of selling pressure and the start of buying activity. In other words, it signals a trend reversal from downward to upward. However, […]
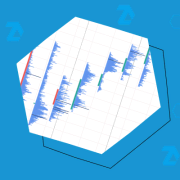
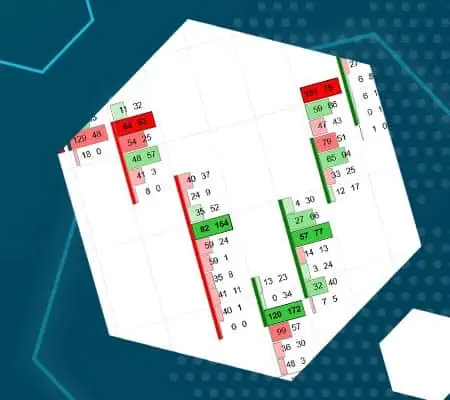
Footprint is a format of the exchange chart that accurately displays information about executed trades, including time, price, volume of buys and sells. This article aims to help traders gain a competitive advantage using footprint charts. Beginners will be able to quickly progress along the learning curve, while more experienced traders will find new ideas […]
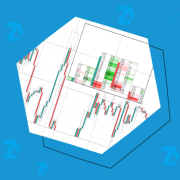
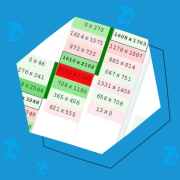
It had been impossible to imagine how a today’s cluster chart would look like before electronic trades were introduced, since exchanges and data suppliers had not provided all the required data. Today, online trading provides a completely new advanced flow of data from the exchange. Developers of trading platforms have got wide possibilities for creating […]
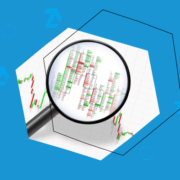
This article is mostly for those traders who have just started to study trading by cluster charts. A beginner should develop own understanding of how to read footprint correctly. We speak here both about training of visual perception, that is, how to find necessary information in the chart, and about training of analytical skills in […]
Footprint charts appeared about 20 years ago, however, there’s still little information on this trading subject on the Internet. And there are no printed books at all, although Footprint is an efficient and modern instrument. ATAS has 25 variants of cluster charts. They show the number of bids and asks, number of seconds and trades […]
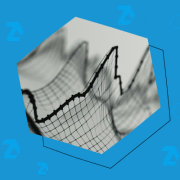
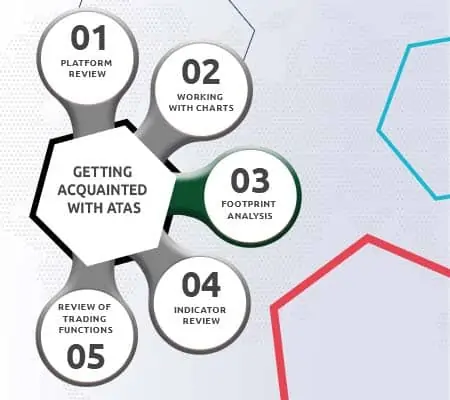
Traders used to apply only the fundamental and technical analysis in the 20th century. They didn’t see what took place inside the candles. The cluster analysis or Footprint emerged in the 2000s. In this article for beginners we will analyze: What Is Footprint and Cluster? Types of Footprint Footprint Patterns Buying and Selling Exhaustion Balanced […]