Tag Archive for: Footprint

Practice of footprint analysis. Patterns in the ATAS platform

Practice of footprint analysis. Patterns in the ATAS platform

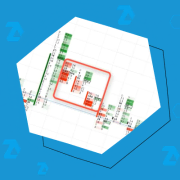
This article is a practical instruction for those who studies the market analysis with the help of such concepts as volume, clusters, footprint and delta. This method of analysis focuses on real powers that influence the price – efforts of buyers and sellers.

Trading patterns and clusters for M5

Searching candles patterns and clusters at M5 chart

Forex beginner traders tend to practice their initial knowledge opening small timeframe positions. Moreover, they usually use simple patterns, which use forex candles. This happens because: small timeframes, such as 5-minute ones, exclude long waiting. They allow immediate feeling of a faster heart beating when they see profit or loss fluctuations; forex patterns, built on […]

Как найти и торговать имбаланс

How to find and trade imbalance. Part 2

In the first part of this article we considered mostly introductory information about imbalances: what imbalances on the exchange are, how they are formed, what they are for, how to get and set them and the basic principles of use.

Range bar charts. How to analyze the delta and footprint in the ATAS platform

Range bar charts. How to analyze the delta and footprint

How to use a cluster chart with an application of such a non-standard chart type as Range Bars? Try Range Bars if you cannot select a convenient timeframe. In this article we will analyze a footprint, built in the Range Bar chart, and you will see how useful it is to look at the same […]

Imbalance - what is it?

Imbalance – what is it? How to find and trade imbalance.

Imbalance is absence of balance between buy and sell orders. It is a specific term, which is used in trading only. In everyday life non-correspondence or inequality is called disbalance. For example: improper automobile wheels balance is a disbalance, which results in their non-uniform wear; receipts are less than expenditures – it is a budget […]

How to combine the cluster analysis and volume levels in the ATAS platform

How to combine the cluster analysis and volume levels

In this article we will consider a combination of the cluster analysis and volume levels in the trading and analytical ATAS platform. The aim is to find specific patterns in the buyers and sellers behavior for detecting market entry points with a low risk. We will consider an intraday market of futures on the EUR/USD […]