

Dear friends! A historic event took place on April 20 – the May WTI oil futures traded at negative prices, reaching the level of minus USD 40. Yes! The oil price was MINUS FORTY dollars. Buying oil at such a price in real life would mean that you receive money for taking oil from the […]
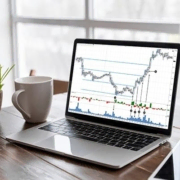
Perhaps you have heard the opinion that the trading is complex and footprint is complicated, that financial markets are only for the sharks who have big capital and best trading algorithms. The truth is that if you concentrate on the task complexity only, you will hardly be able to solve it. Sometimes, a complex thing […]
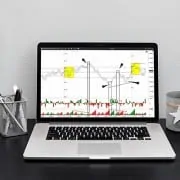
Let’s frankly admit that there is no ideal indicator for an entry into an exchange trade. If it were, there wouldn’t be hundreds and thousands of other indicators for an entry. To have a stable profitability each trader should have: Trading system. Properly studied instruments. Capital management rules. The indicators you comfortably work with belong […]
In his book ‘Trades About to Happen: A Modern Adaptation of the Wyckoff Method’ David H. Weis gives a simple but important figure. It is called Where to Find Trades. The Figure is accompanied by a comparison which you will easily understand if you are a fisherman. Weis writes that the fish bites better at […]
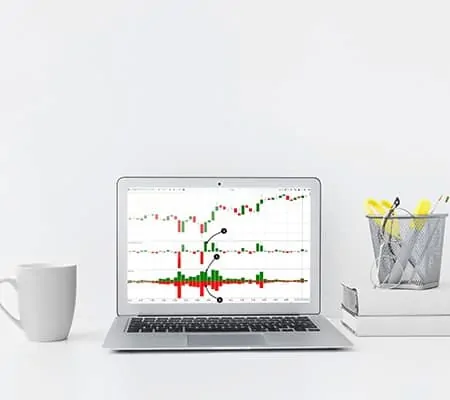
We devote this article for beginners to the Cumulative Delta. Why is it important? Why is it useful? What are specific features of the Cumulative Delta application for trading on the exchange? Read in this article: what the standard Delta, Bids and Asks are; what the Cumulative Delta is; what the Cumulative Delta shows; how […]
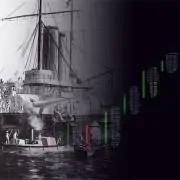
This war ended after just being started. From the first shot until the total victory of Britain, the Zanzibar troops managed to protect their positions for about 38 minutes. Zanzibar commanders definitely didn’t estimate imbalance in forces before they got into the shortest war in world history. Since buyers and sellers fight in the market, […]
Independent from what market you trade in, whether it is the Forex, futures or stock market, you will face absorption of minor market participants by major market participants every day. Today we will show you how this absorption looks like on a simple example of a Bid x Ask Volume Profile Footprint chart of the […]