Types of financial markets after globalisation
According to the data of the Brokernotes analytical agency for the year 2018, financial markets activated their development in the global scale. The number of traders has grown by 107% and in Oceania by 116% during one year. The rates of growth were not that fast in previous years. Who would have thought that there are 2 million traders live and work in Africa, the continent which is far from financial centers!
Development of technologies makes the difference. The wish to be independent of money is inherent in every human being. Financial freedom is financial freedom even in Africa.
Trading in the financial markets in the modern world requires:
- computer (or smartphone) with Internet access;
- start-up capital which could be quite affordable in many cases. For example, USD 100 is sufficient to start trading futures (what futures are) in some markets of the Moscow Exchange.
It’s not too much to become financially free, isn’t it? If you plan to start trading in the financial markets, we recommend you to read the following articles from our blog:
- Trading for beginners. First steps on the exchange.
- How to start trading on the CME for a beginner: capital calculation.
- How to become a trader from scratch. Interview with a professional trader.
Also pay attention to the current article in which we will tell you in brief about:
- financial indices;
- financial options;
- basic indicators of the financial market;
- best books on the financial analysis.
Financial indices
Financial indices are calculated values which are required to make assessments in the financial world. You can assess a lot of things, for example:
- growth or fall of the oil-and-gas industry;
- growth or fall of investments into an industry / country / company;
- growth or fall of the bond market;
- and so on.
Financial indices are used to conduct analysis of changes in a market or economy. For example, if the stock market index goes down, it means that you should keep away from investing into the stock market or to be very careful when opening long positions on some stock.
Here’s one brief example of the index analysis.
The above picture shows comparative characteristics of financial indices. It clearly shows that the financial technology industry (pink line) was the most stable one during the market fall in February 2018. It means that investments into this industry were more attractive than into others.
Do you know how many American stock market indices exist? About 5 thousand (!) according to Investopedia. You can find more information about indices in our special article Stock indices for beginners.
Financial options
When we speak about financial options, in most cases we speak about one of the two phenomena:
- Binary options – speculative non-transparent markets with a high risk of fraud, tailored for gamblers.
- Stock option – a security which gives the right (not the obligation) to buy/sell an underlying asset in the future.
For example, stock options are popular in Western markets. We will show you an example of the stock option code for better understanding by beginners.
- The ticker of the underlying asset (stock in our example). However, futures and other financial instruments could play the role of the underlying asset apart from stocks.
- The strike price. A trade will be executed at this price (USD 70) on the option expiration day.
- The premium amount for the option (USD 3.10). The option buyer pays this premium to the option seller.
- The option expiration date (in our example – December 17, 2011).
- Option type – call or put.
Is it clear or not quite? Read the following special articles in order to get acquainted with financial options in more detail:
If you are interested in binary options, you will not find articles on this subject in our blog. We do not recommend you to trade in the highly risky market of binary options.
Financial indicators
Do you look for financial indicators? Most probably you will need indicators for trading in the financial markets.
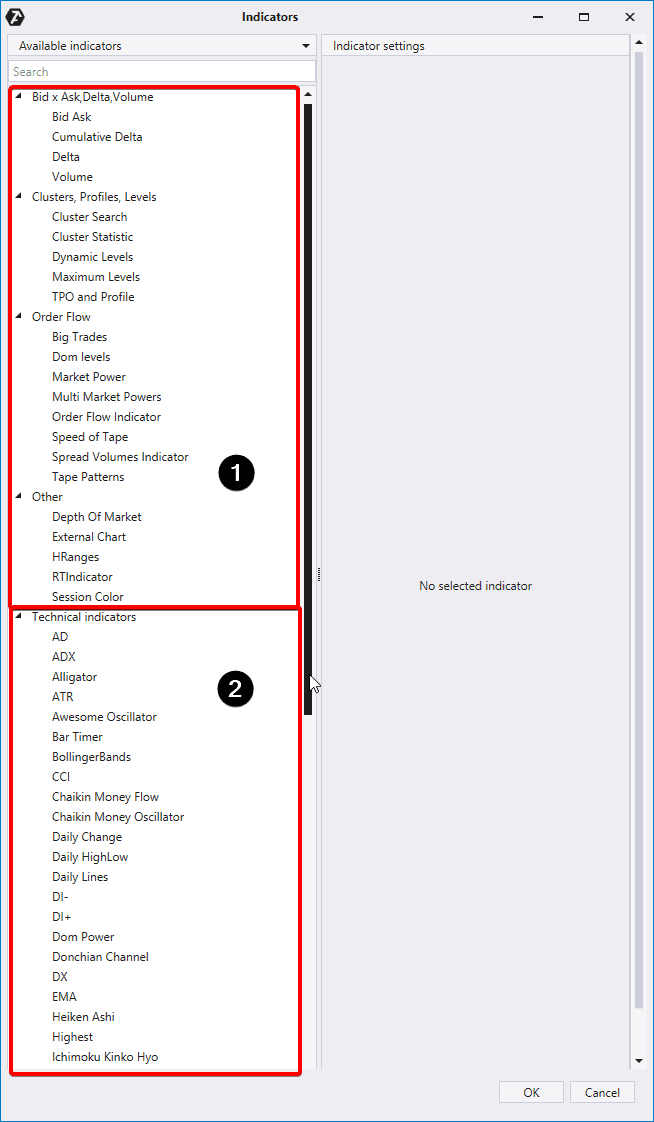
We, the OrderFlowTrading company, conventionally divide indicators into 2 types:
- Progressive indicators (for analysis of volumes and clusters);
- Classical well-known indicators.
That is why the Indicator Manager in our trading and analytical ATAS platform (download the free version right now) divides all available indicators into 2 conventional groups (see the picture above).
Let’s speak in brief about each group starting from the classics.
Google search produces these 7 most classical financial indicators:
- Bollinger Bands. John Bollinger (his twitter – bbands) bought his first computer in 1977 and developed the Bollinger Bands indicator in the first half of the 1980s. His “Bollinger on Bollinger Bands” (2001) book was translated into 11 languages.
- Ichimoku Kinko Hyo. It was developed in the 1930s by a Japanese analyst Goichi Hosoda. The author worked on improvement of his indicator for a long time and published the results only in 1968.
- Relative Strength Index (RSI). It was first published in 1978 and became popular due to the simplicity of its interpretation. Its developer is an American mechanical engineer J. Welles Wilder Jr. who also was engaged in the real estate business.
- Parabolic Stop and Reverse (SAR). It was also developed by J. Welles Wilder Jr. A specific feature of Parabolic SAR is that it assumes that the market is always in the focused movement. In other words, if a trader follows this indicator, he always has a position – either for buying or selling.
- Average Directional Index (ADX). You wouldn’t believe it, but this indicator also was presented by J. Welles Wilder Jr. in 1978. The ADX indicator is designed to send you a signal about the trend strength. If ADX is less than 20, the trend is weak. If it is more than 50, the trend is strong. However, you should always remember that ADX shows you the strength and not the direction.
- Moving Average Convergence Divergence (MACD). This indicator assesses convergence/divergence of moving averages and it was developed by Gerald Appel in the end of the 1970s. One thing should be noted in MACD: it consists of moving averages. It means that it is significantly behind the price, that is why MACD could be not the best indicator if you want to enter the trends from the very beginning.
- Stochastic oscillator. It is measured in percent and assesses impulse movement. Stochastic was developed by Dr. George Lane in the end of the 1950s. He was an active trader as well as a lecturer. George was the head of Investment Educators Inc. (an educational institution) where he taught (among other things) how to use Stochastic. This indicator tries to predict reversals by comparing the closing price with the price range.
As you can see, the above financial indicators are approximately 50 years old. They were developed in those times when the first computers became available for the market researchers. These indicators are still used by traders in combination with the classical candle analysis.
The computation capacity grows. And nowadays analysts have the improved possibilities for market assessment. Computers allow to build complex charts taking into account every tick very fast.
Thus, traders have access to:
- cluster charts or footprints with detailed information about trades at each level. The ATAS platform offers 25 footprint variants and 14 chart types, only 2 out of which are linked to time;
- interfaces for Smart Tape and/or Smart DOM trading.
Apart from new charts and interfaces, traders and analysts have got a possibility to use progressive financial indicators, such as:
- Cluster Search and Big Trades;
- DOM Levels;
- Stacked Imbalances;
- Dynamic Levels;
- Horizontal volumes and Market Profiles;
- and other indicators.
Summary
We will complete this article about financial markets with a brief discussion of the best books on the financial analysis.
Books for traders is an important element of training and development of an exchange trader. Here are several pieces of advice for those who are looking for books about exchange trading:
- The tasks of the authors of books for traders are not only to teach how to trade but also to sell their books. Moreover, quite often the priority task is to sell the book. That is why there are many publications which just repeat the same things and do not contain unique and useful information. When you select a book for reading, please, check:
– how competent the author is;
– what proofs of his/her competence are available;
– what practical value the book information has. - Take ideas from our article Trading books you must read.
- Read the chart. This recommendation is a bit unexpected. However, the chart, as well as the book, is a story line. The chart is a hard-boiled thriller about the struggle between buyers and sellers.
Taking the buy and sell information from the chart you may get the facts of successes or failures and of the market mood changes. Go through the charts of different historical periods and you will find out that sometimes the market offers trading opportunities with a low risk. We wish you to come across such opportunities as often as possible.


