Learn to combine different time frames in your analysis
One of the funny things about the stock market is that every time one person buys, another sells, and both think they are astute. William Feather
The most interesting thing is that they both can make profit. It is quite possible if they trade on different time-frames.
- How to use different time-frames?
- Why is it important to analyse different time-frames?
- What could trading strategies be when combining periods?
Read about all these things in this article.
Different time-frames show different pictures
Intraday and position traders see different information in the same charts because trend lines and indicator signals depend on time periods.
The market may simultaneously grow and fall in different time charts. If a weekly chart shows a bearish trend, while a daily chart shows the growing trend, it is difficult for beginner traders to understand what trades to open.
Charles Dow wrote that there are three main tendencies:
- long-term – measured with years;
- middle-term – measured with months;
- short-term – measured with days and shorter periods of time.
Markets significantly developed since the Dow times. They became global and speed of operations significantly increased, down to a split second (high frequency trading).
Any trader independently identifies his main time-frame and then specifies bigger and smaller time periods in order to increase chances for success trading by the longer trend and performing more accurate entries on shorter periods.
It is more efficient to identify the dominating tendency on longer time-frames.
| Period for working with trading signals | Bigger trend period |
| 1-minute chart | 15- or 30-minute chart |
| 15- or 30-minute chart | 4-hour chart |
| 1-hour chart | daily chart |
| daily chart | weekly chart |
After you identified the main trend, you can pass to the standard time-frame and filter out trading signals.
- If the main trend is bullish, it makes sense to select only buy signals.
- If the trend is bearish, it makes sense to select only sell signals.
You can reduce a number of trades and decrease commission fees and potential losses through combining the ‘trend’ and ‘signal’ charts. Of course, using this approach, a trader will miss some part of profitable trades against the main trend, but there is no guaranteed result in trading.
It is more efficient to select the trade entry point on a shorter time-frame after the signal appeared.
| Period for working with trading signals | Smaller period for entry into a trade |
| 1-minute chart | tick chart |
| 15- or 30-minute chart | 5-minute chart |
| 1-hour chart | 15-minute chart |
| daily chart | hourly chart |
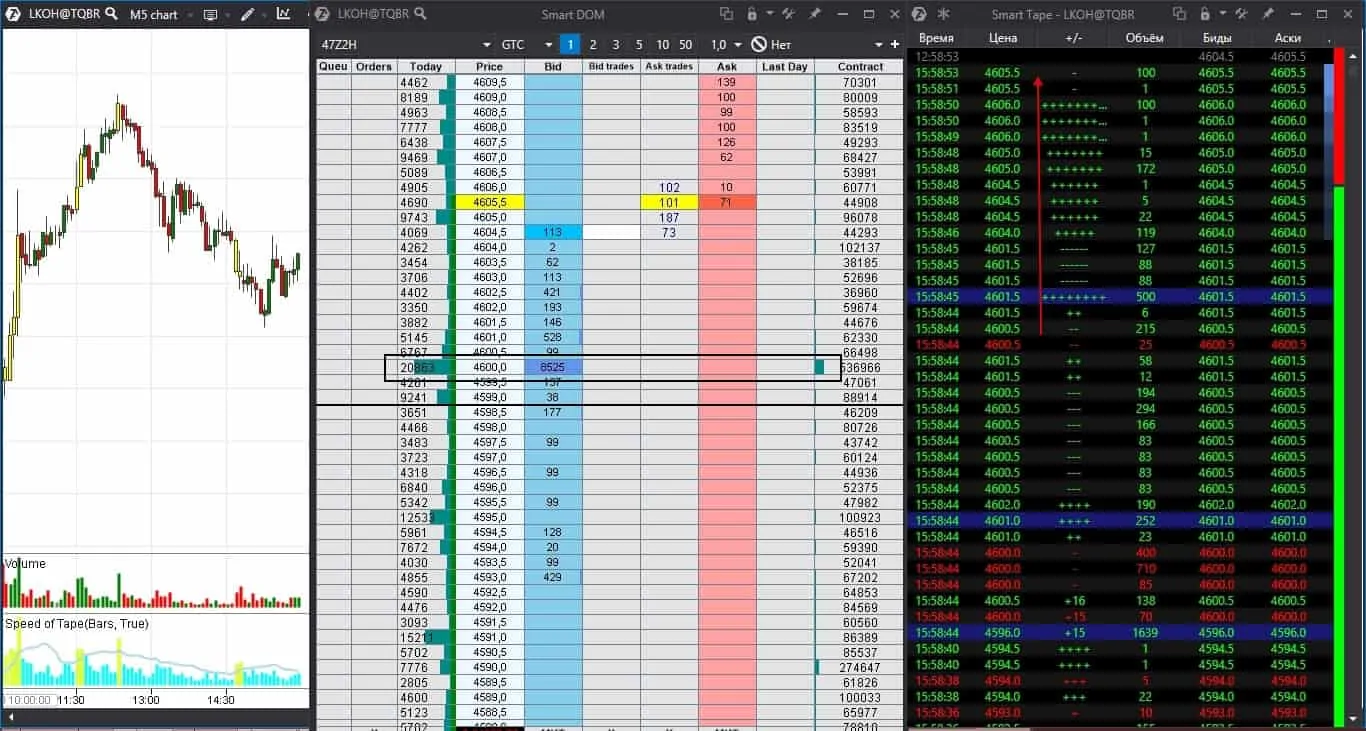
You can also use, apart from the charts, the Smart DOM and Smart Tape. for selecting the entry point. In the Smart DOM, you can focus on the profile step and big limit orders near these levels.
As regards the Smart Tape, traders should pay more attention to high activity of sellers or buyers – in other words, appearance of a big number of the same direction orders in a row. Especially, if these orders are big and are near significant support or resistance levels.
We marked the level, at which the number of traded positions sharply changes, with a black rectangle in the Smart DOM. Such projections are called the profile step (increment). A big limit buy order is posted at this level in the blue field.
Limit orders are not always posted in order to execute a trade. Sometimes they are posted to confuse traders or make them believe that market orders will not pass here (read about it in the article about spoofing). We see big market buys in the tape, which consistently raise the price from RUB 4,600.5 to RUB 4,606.0. Prices increase practically without delay and it is the sign of strength.
All together these actions inform traders that the price increase is expected and show the best entry point with the lowest risk level.
Trading strategy on combining time-frames
The most popular trading system, which combines time-frames, is, perhaps, the triple screen by Alexander Elder. It uses several time scales for trading signal filtration. See Picture 2.
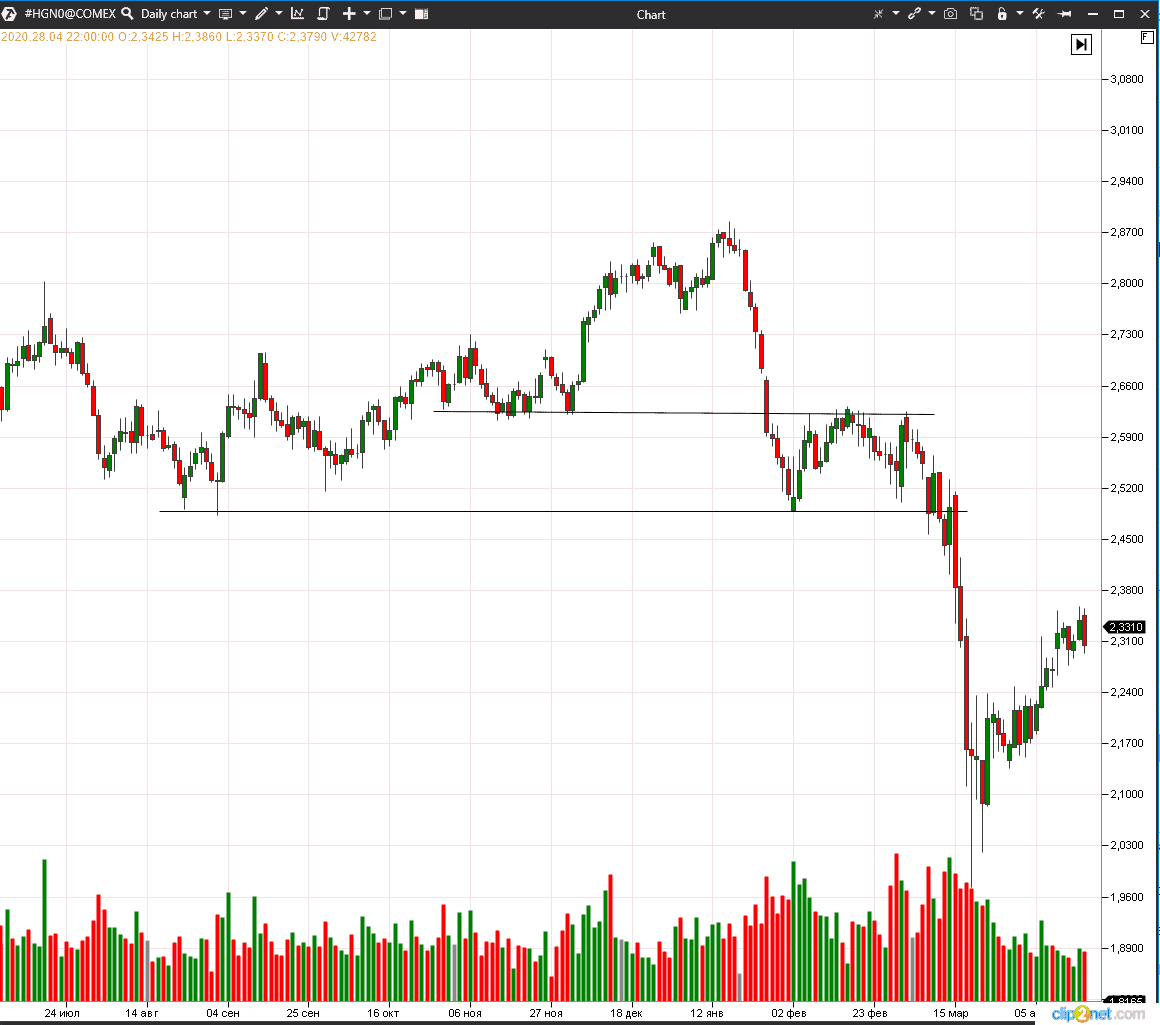
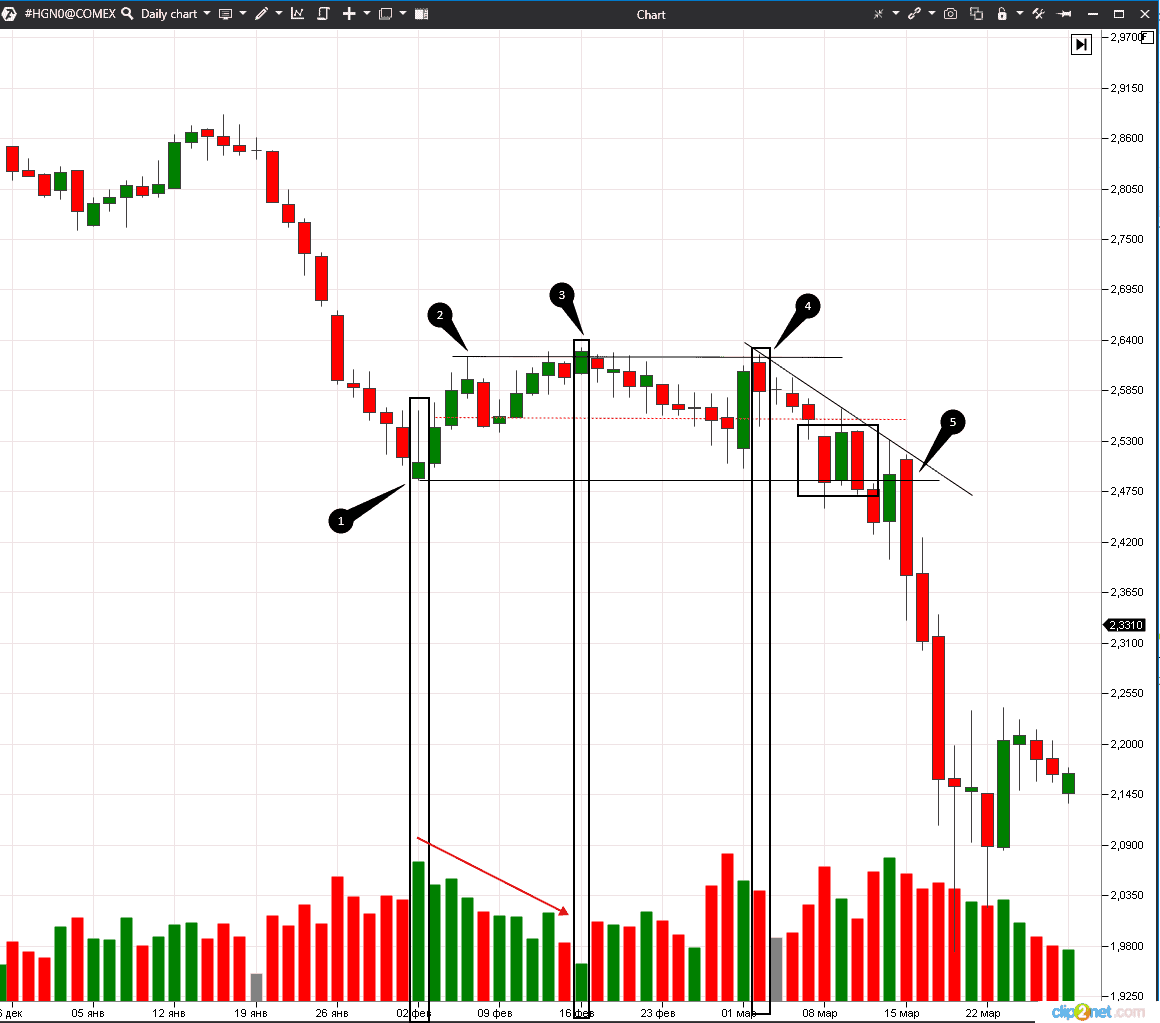
Investment and hedge funds work on long time-frames, since these organisations have money to slow down or accelerate the market. You cannot ignore their actions. The main trend makes sense when there are breakouts of consolidation areas or such technical analysis patterns as triangles or flags.
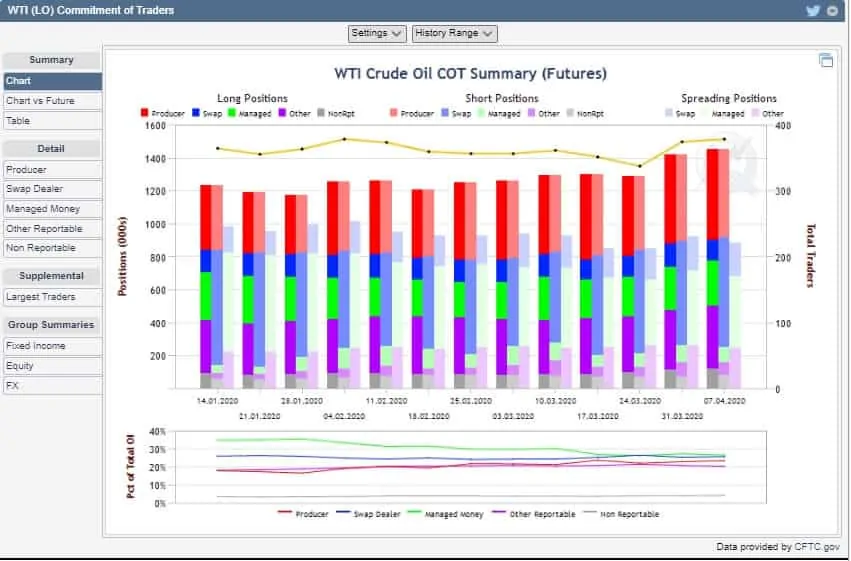
Open Interest data could be used, apart from big time-frames, for trade filtration in the futures markets. CME publishes data about Open Interest based on the results of a trading session. Additionally, the exchange provides statistics by trader types. See Picture 3.
Some players open positions for hedging and some – for speculations. For example, operators are major producers. They work with physical commodities in the real sector, that is why they minimize losses (they hedge risks) on the exchange rather than want to make a profit.
Operators may buy during the periods of long falls. They believe that the required commodity is cheap and they would use it in production some time later. Larry Williams explains in detail how to work with these data in his book for traders ‘The Definitive Guide to Futures Trading’.
The Moscow Exchange provides Open Interest data online and publishes resulting data on the number of long and short positions at the end of every trading session. The Moscow Exchange divides participants into legal and physical persons. It was noticed that physical persons act against the main tendency quite often. For example, the USD/RUB futures contract (Si) started to move down from March 31, 2020. The contract price moved down during 7 out of 9 recent sessions, but physical persons stubbornly continued to take long positions. See Picture 4.
Let’s analyse what took place with the USD/RUB exchange rate futures (Si) on different time-frames during the period from March 31 until April 10, 2020. See Picture 5.
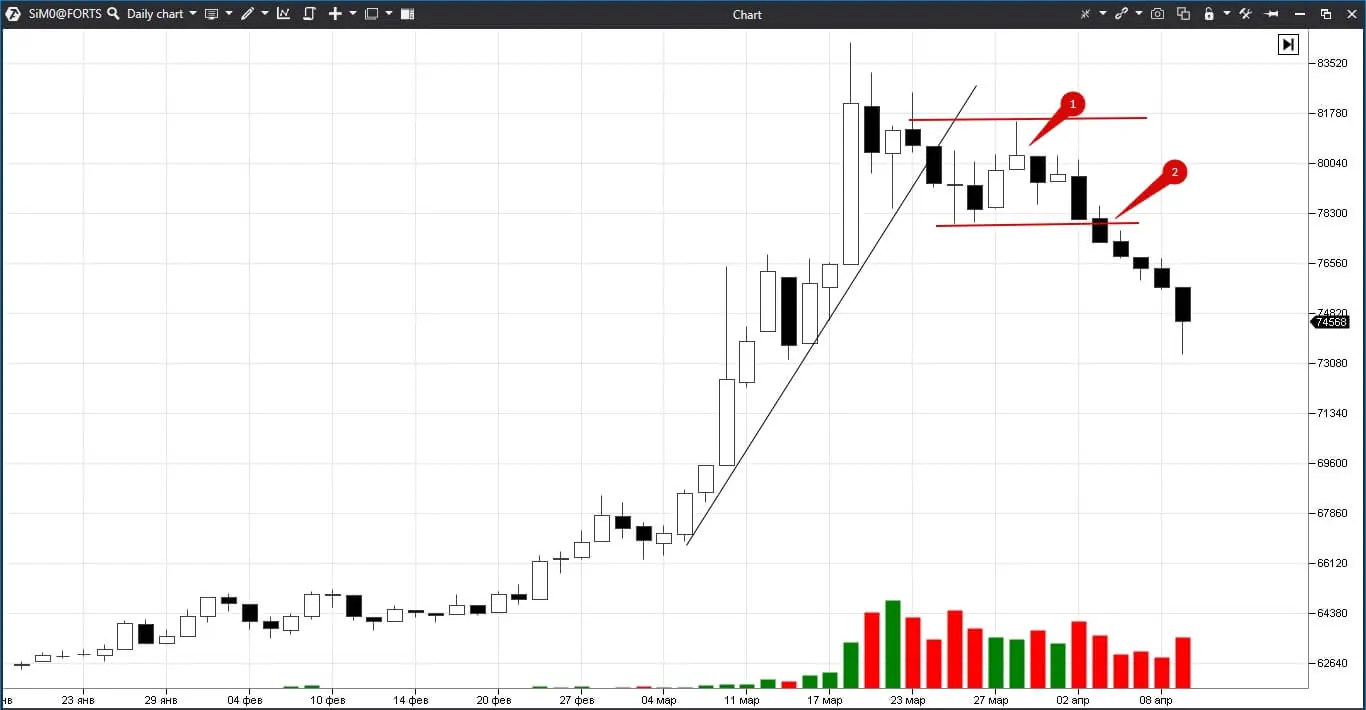
We built a trend line in the daily chart along the bar lows of March 5, 10 and 16, 2020. The trend was broken on March 24, 2020. A lower high was formed in point 1 and the price moved below the lower low in point 2. All these actions increased the probability of reversal at the peak. Aggressive traders could join the downtrend after point 1 and the more conservative ones – after point 2.
Let’s take 10-minute charts and use them as signal charts. See Picture 6.
Prices moved up and down on April 3, 2020. If a trader wouldn’t have taken into account the global down tendency, he could have both bought and sold. However, if a trader would have taken the down tendency into account, the risk would have been smaller while the profit – bigger.
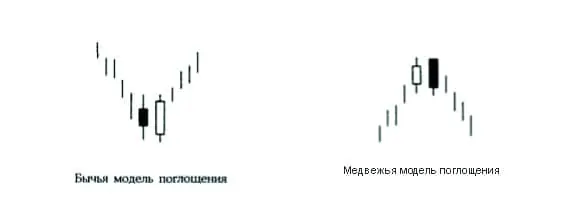
- We marked the first two candles of the trading session with a red rectangle. It seems that the price would reverse, since the white candle is bigger and closes near the black candle high. However, the global trend is bearish and the price moves down again.
- Short positions could be opened in points 1 and 2, posting a stop above the local high. It is impossible to pass below the previous low in point 3, that is why short positions could be closed or the stop could be moved closer.
- It is possible again to open a short position in point 3, since the price couldn’t move above the day’s high. However, the price bumps into the previous low again in point 4 and cannot break it.
- Short positions could be opened or accumulated in point 6 and 7 because these are lower highs.
The price didn’t return to the first high during the trading session and short positions could have been accumulated increasing the profit.
Let’s consider now the 10-minute chart as of April 9, 2020, with two OI Analyzer indicators. The first indicator shows what buyers do while the second shows what sellers do. See Picture 7.
The bar, which is marked with a red rectangle, shows us that sellers increase short positions and buyers close long contracts. Which means that both sell, which, in its turn means, that the price moved further down.
Summary
The global picture should be taken into account and optimal position entry points should be selected in order to achieve the stable and successful trading. Combining time-frames allows increasing the success probability and conducting trades within the trend, which develops on the longer period.
The modern trading ATAS platform will also help you to increase your competitive advantage and would allow you to trade with a higher efficiency.
Information in this article cannot be perceived as a call for investing or buying/selling of any asset on the exchange. All situations, discussed in the article, are provided with the purpose of getting acquainted with the functionality and advantages of the ATAS platform.

