Ideas for trading by the trend with Delta chart&Volume clusters
In this practical article, we will consider an efficient technique of trading by the cluster chart in the Graduated Volume mode. Besides, we will not use the classical time-frames as a period but the Delta chart.
Read in the article:
- how to set up the chart;
- advantages of working with the chart of this type;
- selling by the trend;
- buying by the trend;
- a bonus – video demonstration.
How to set up the chart
The chart is easily set up in 4 steps.
Step 1. Open the Chart module.
Open a new Chart module in the main ATAS window, select an instrument from the list and press OK. By default, the platform will open a 5-minute chart with the Fixed TPO and Profile indicator in the left part and DOM indicator in the right part.
We will now use these indicators in the current article, that is why we remove them with the help of the indicator manager (you can call it pressing the key combination of Ctrl+I).
Step 2. Set up a period.
As you know, the most popular periods for working with charts are based on equal time intervals. For example, every new bar/candle is built every 1 minute / 15 minutes / 1 hour / 1 day.
A big number of trading platforms do not offer a wide selection of periods for building charts. ATAS has much more freedom. Users can select various frame types, even absolutely unique ones.
We select the Delta period type.
How to do it:
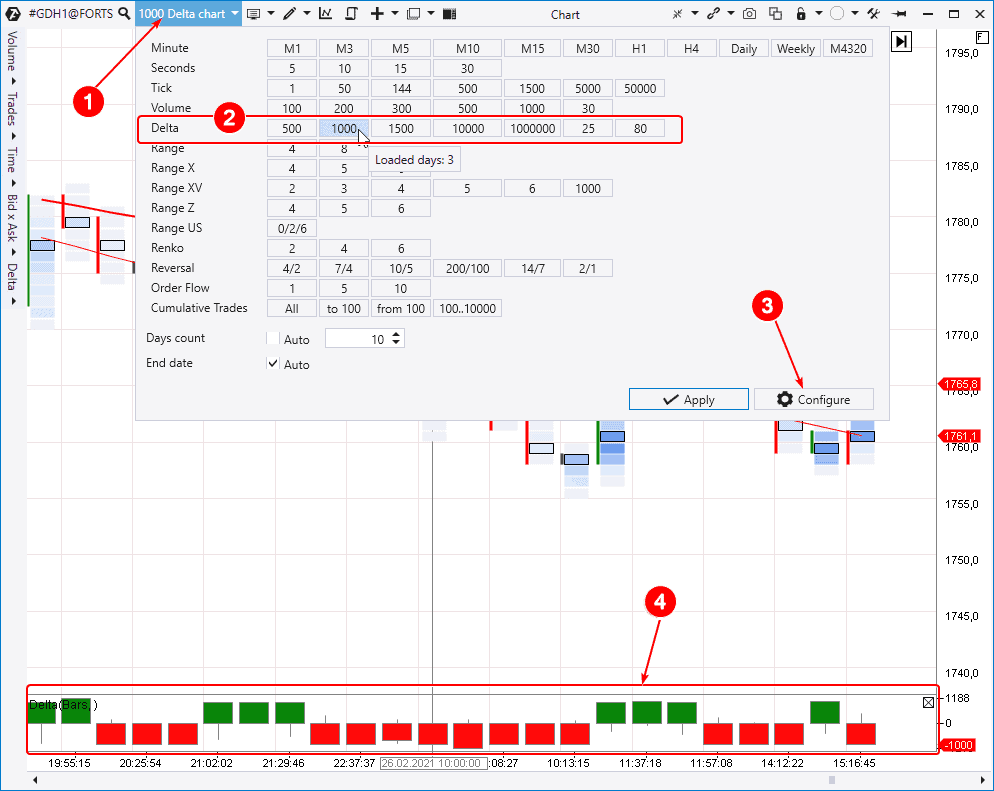
- Go to the panel for setting up periods (1).
- There is a big variety of periods but we need the Delta line. In our case, the data of gold futures from the Moscow Exchange are loaded in the chart. That is why we selected the 1000 value. Most probably, you will have to determine another value by trial and error for another instrument/exchange.
- If nothing suits you from the default values, you can add your own value through pressing the Configure button (3).
The Delta indicator in the lower part of the chart will take the ‘brushed-up’ form (4) after we select the Delta period of a certain value. All candles on the Delta indicator will be approximately equal to the selected value. It means that every candle/bar in the chart will be closed when the accumulated Delta reaches +1000 or -1000 from the moment of its opening independent of how much time it takes. Session boundaries could be an exception.
We want to remind you that Delta is an indicator, which splits the volume into ‘plus and minus’:
- minus – if a market sell is matched with a limit buy, in which case the trade volume value will be negative and red;
- plus – if a market buy is matched with a limit sell, in which case the trade volume value will be positive and green.
The indicator sums up volumes with plus and minus within the period. Thus, the Delta shows the balance of buyers and sellers. Those who post market orders are considered to be the aggressive side, which tries to gain the initiative.
If you do not understand what Delta is, we recommend you to read the following articles:
- What Delta is in the Knowledge Base.
- How orders are matched.
Step 3. Set up clusters
How to do it:
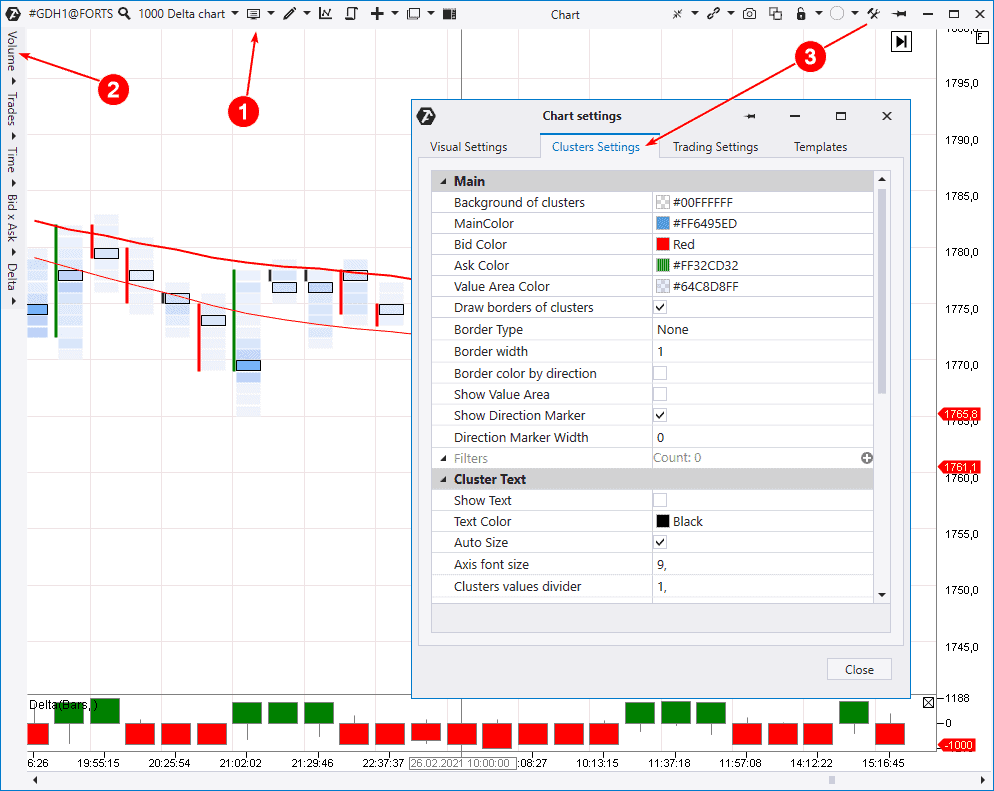
- Select Clusters in the respective item of the upper menu (1). Or you can expand the chart horizontally so that ATAS would automatically go into the cluster display mode.
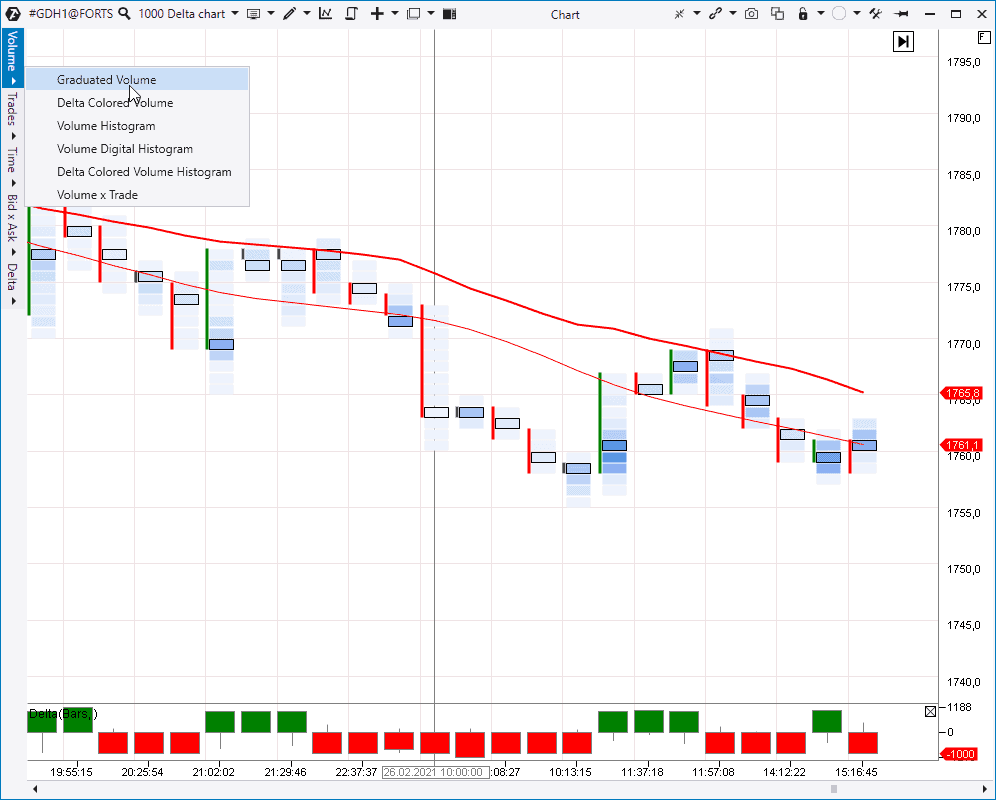
- When the cluster mode is activated, a menu appears to the left (2). Select Graduated Volume in the Volume mode (2). It means that ATAS will make those clusters bright, in which big volumes were traded.
- You can call cluster settings from the upper right menu (3) to ‘play around’ with colours and other parameters.
Step 4. Final settings.
Let’s add 2 indicators to the chart:
- the ‘good old’ lagging SMA (17);
- Hull Moving Average (HMA) – this moving average is also good but not so old and lagging. A trader named Alan Hall invented it and presented it to the public in 2005. We set up the period of 50.
We will use these 2 moving averages as the simplest method of identifying the current trend. Of course, MA is not a progressive method for making decisions. We rather use them here for demonstration of the ATAS platform functionality.
You should also pay attention to the fact that we used the Scale option for combining several levels into one. Thus, the cluster charts take a more ‘readable form’.
Advantages of working with this chart type
Advantages of the chart which uses the Delta data as a period (frame):
- Such a chart is oriented at the actual activity of buyers and sellers and, thus, at the forces, which really move the market.
- It filters out the flat in its own way. When there is no predominance of one of the sides in the market and trades are not active, new bars/candles do not appear.
- It is original. We are sure that the charts of this type are not common. Moreover, if you set up your own special Delta value as a period, you will get an absolutely unique chart. And it is very important to be different for achieving success in the exchange trading.
Selling by the trend
So, we set up the chart. Now, we will use some examples to see how you can use it for intraday trading on various instruments.
First of all, we will make an important announcement. We consider all trades individually. Our considerations do not take into account the general picture and fundamental background. To a certain extent, we simplify the process of decision making to show you how the ATAS platform functions operate. In real trading, you should take into account the general context and approach the decision making process with maximum responsibility.
Example. Selling by the trend.
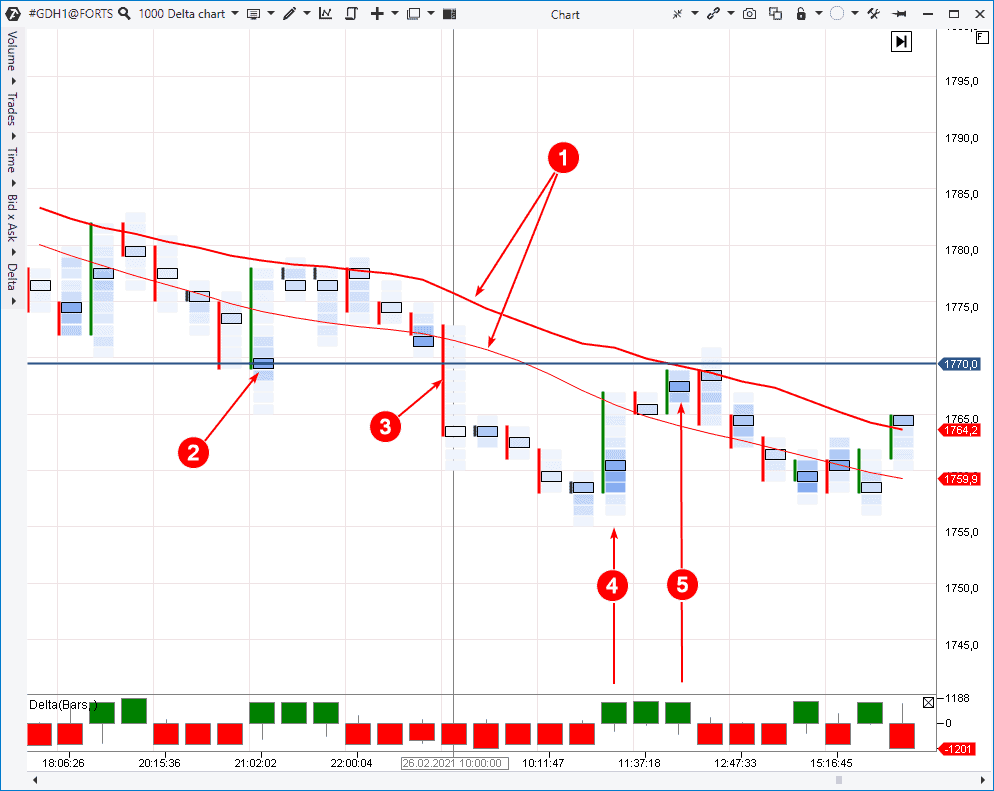
Let’s assume that a gold futures trader on the Moscow Exchange opened the chart on February 26 and saw that:
- moving averages are directed down (1), which points at the current bearish trend;
- the support level of 1770, where high volumes pushed the price up, was formed at the previous session’s closing (2).
The price broke down the support level of 1770 at the session opening. Consequently, a trader has grounds to form a setup for selling in the event of testing this level, which should now predictably play the role of resistance (the mirror level principle).
Candle number 4 points to the fact that this test would, most probably, take place and the trader should be ready for this.
Candle number 5 shows that the quotation closely approached the supposed resistance level and the trader needs now to get fresh facts, which confirm that the level of 1770 will work as resistance. Having tested it, the market will resume down movement.
Note that the Delta indicator on bars/candles is 4 and 5. Delta is green in both cases, which means that the Delta reached the value of +1000 contracts on these candles in the result of trading.
And now compare the difference between High and Low of candles 4 and 5. Candle number 5 is much more narrow, which means that, despite the same positive Delta, the quotation didn’t increase. In other words, the buyers’ efforts produce no result. It might be caused by actions of a major limit seller, who keeps down the further price growth near the resistance level of USD 1,770 per contract.
The next bar near 5 has a negative Delta and was closed at the lows. It already clearly indicates that the test took place and the trader has grounds to enter into the sells either on this candle closing or even earlier, acting more aggressively and proactively. Thus, the trader joins the downtrend, which dominated on that day.
His aim is to hold on as long as possible (the price reached the low at about 1720 per contract). How to post stop losses? It should be done based on your personal risk tolerance and your own rules of capital management.
One more selling by the trend.
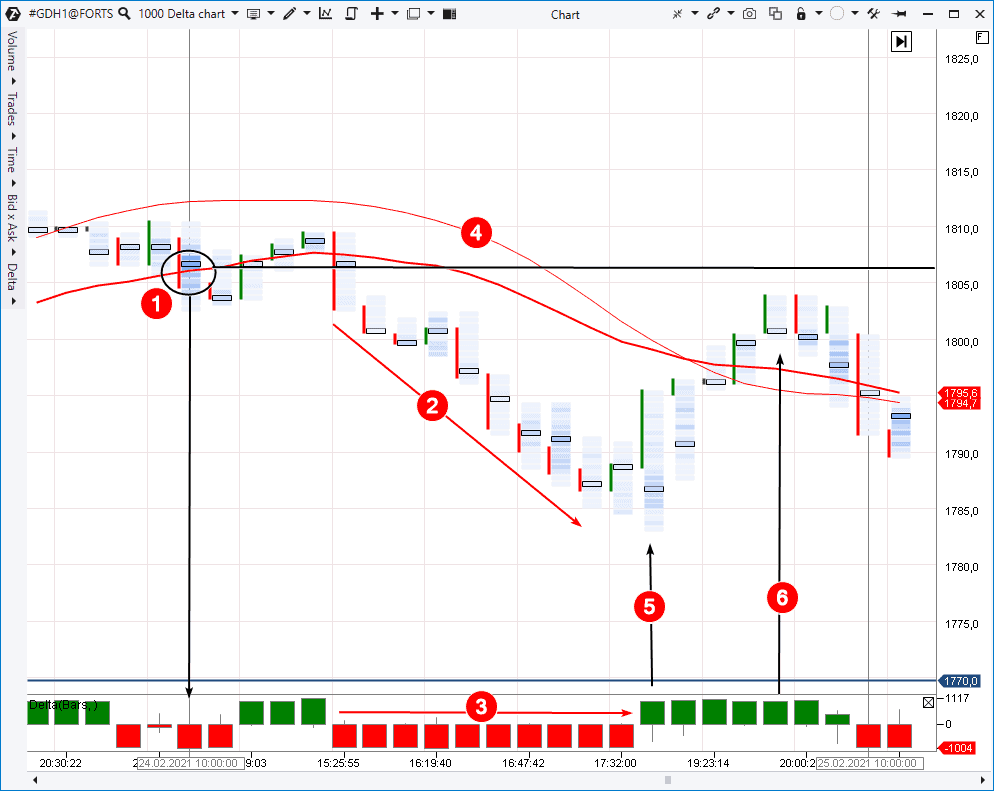
The same instrument (a bit earlier).
Let’s be less eloquent and outline main points.
A seller turned up (1) at the session beginning, which you can see from the red Delta and bright cluster. We lay down a level from the cluster (a bit above 1805).
We get the following as the direct consequence of the seller turning up:
- price decrease (2);
- a row of red bars (3), which warns about disruption of the preceding uptrend;
- both MA reverse down (4).
We are waiting for a test and notice the beginning of an upwave (5) on the green Delta.
The price closely approached the level of 1805, but the bar is narrow (6). The flow of market buys doesn’t result in fast increase as it was on the bar (5). It means that the market is near resistance.
Despite the positive Delta, the next bar after number 6 is closed lower and the maximum volume level – also lower. Now the trader has sufficient grounds to enter into the short.
Buying by the trend
The logic is similar to the previous examples. The only difference is that we do not sell – we buy.
Example. Buying by the trend.
It is the NASDAQ stock index futures market.
We changed cluster settings a bit – the Delta parameter for the chart is 500.
The chart displays a volatile period for an American session.
Let’s assume that the trader is attracted by the price increase, moving averages ‘lift their heads’ (1) and the task is to join the positive market mood and it makes no difference what factors caused it.
The trader notices an extremely high splash of volumes on candle 2. Besides, as we see, a candle with a tail was formed on the Delta. It means that a serious fight of buyers and sellers was going on at the level of 12900 per contract. The demand forces finally won and the price stayed above the level of 12900 during the next several bars.
The trader builds a horizontal support line of this level since he has sufficient grounds to believe that this is a good price for buying a contract with a short stop. What happens next?
The price approaches the round level of USD 13,000 per contract on candle 3. Buying volumes are very high. However, the price decreases on the next candle. It means that buyers have certain problems. Candle number four confirms the problems since the negative Delta and closing at lows point to a probable beginning of a rollback from the key resistance.
But the trader remembers about the strong level of 12900 and he’s got an idea to buy the contract at this price as soon as he receives a confirmation signal.
Such facts appear in the cluster chart on bar number five. We see that the Delta indicator changed its colour from red into green, besides the Delta has a tail on candle number 5. It means that buyers started to fight near the support level. Having seen it, the trader gets a chance to enter into the long expecting that the rollback is over and the uptrend will resume.
Example. Buying by the trend.
Let’s have a look at the Sberbank stock futures market to see how the described logic works.
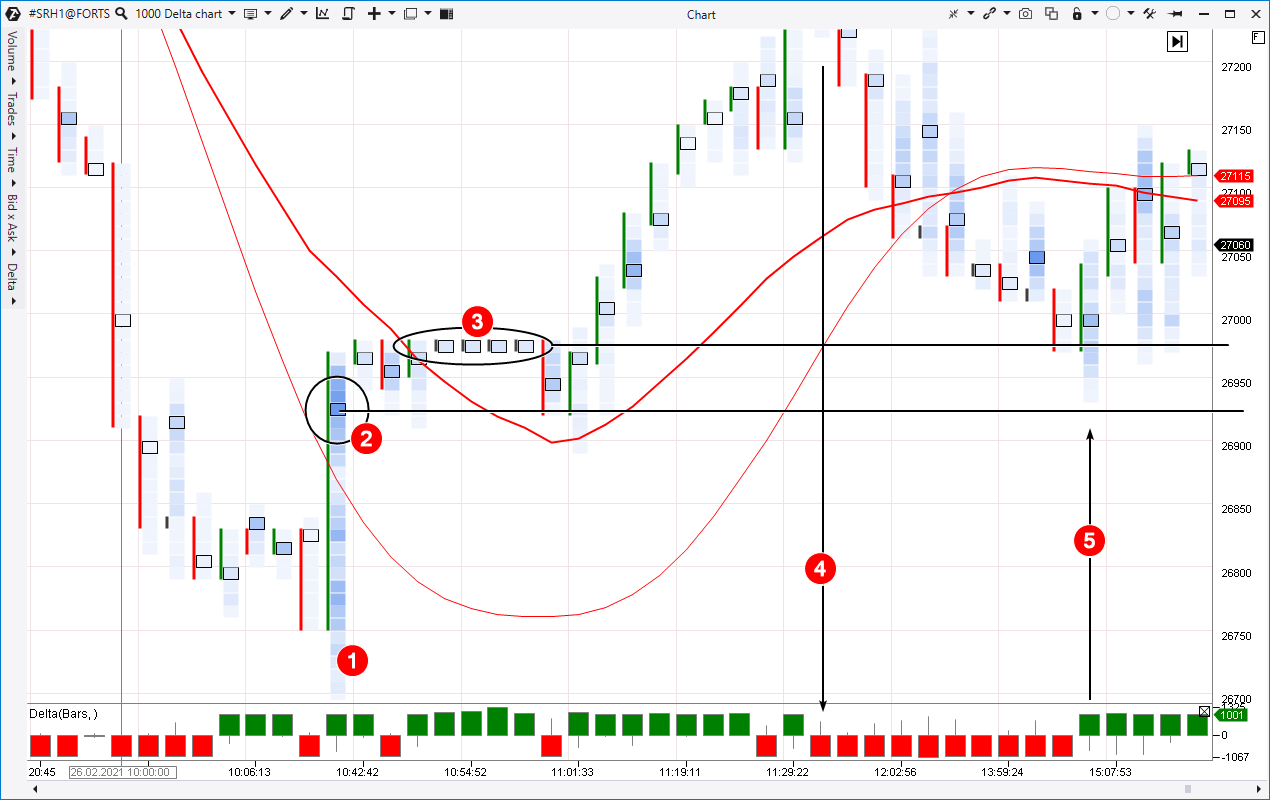
We use Scale = 10 and Delta = 100. The data is from the Moscow Exchange.
This session started with a fast fall but everything changed completely on bar number 1. It is a very wide bar. Judging by the Delta indicator tail, we understand that there was a fight between buyers and sellers inside the bar and, in the end, buyers turned out to be stronger since the Delta is positive and the candle closed at the high.
We build a horizontal level from the cluster with the biggest volume (2). The price consolidates above the laid down horizontal level. It is a positive sign.
The far it goes, the more interesting it gets. We see the appearance of a ‘train’ of bars of minimum height (3). Most probably, it is a series of big buys, which were performed very fast. Whatever it was, the market reaction is positive because it goes up before long. We build one more horizontal support level (since it points at availability of the buyer) from accumulation of these trades.
Demand exhausts on bar number four (unfortunately, this takes place outside the picture) and bears try to regain control, which they possessed at the session beginning. While the price moves down to laid down levels 2 and 3, we get grounds for entering the long on a test of the specified levels.
You should concentrate maximum attention at bar number 5. Judging by the Delta tail, there is a fight there, which buyers are winning. The bar closes at peaks. We are a bit confused by the fact that the lines of moving averages already look down, nevertheless, the picture seems to be more bullish and the built levels, basically, should push the price up. It will be a justified buy (with a reasonable risk level), for example, with the help of the buy limit after the bar, on which the change by Delta took place.
Conclusions
Your logic could be built in accordance with the general plan:
- look for a trend (impulse);
- look for a rollback within the trend (you can add Fibonacci retracement levels);
- enter, based on signals of the rollback completion.
It is quite a classical approach but you can significantly increase your confidence and efficiency with the use of the progressive functions of analysis from the ATAS platform.
You will have to determine Scale and Delta settings for the chart by trial and error. Take profits and stop losses are posted on the basis of individual preferences with respect to the risk.
If you found this article interesting, share it in social networks or leave your comment.
Download ATAS for playing with the Delta frame and Graduated Volume in the markets you prefer.
Information in this article cannot be perceived as a call for investing or buying/selling of any asset on the exchange. All situations, discussed in the article, are provided with the purpose of getting acquainted with the functionality and advantages of the ATAS platform.

