Introduction
Getting Acquainted With ATAS is a series of 5 articles designed for those interested in volume analysis but who have yet to try the platform in action. Each article in the series consists of two parts: a video overview and a text section. We recommend starting with the video and then using the text material, enhanced with screenshots and links to helpful resources, to reinforce your knowledge.The first article covers an overview of the platform.
Here, we will briefly explain:- what ATAS can do;
- how to start using the platform;
- what components are included.
Part 1. A Video Overview
Part 2. A Text Description
In this section, we will cover: If you have any questions, feel free to contact our support team, we will be happy to help.HOW TO DOWNLOAD THE PLATFORM
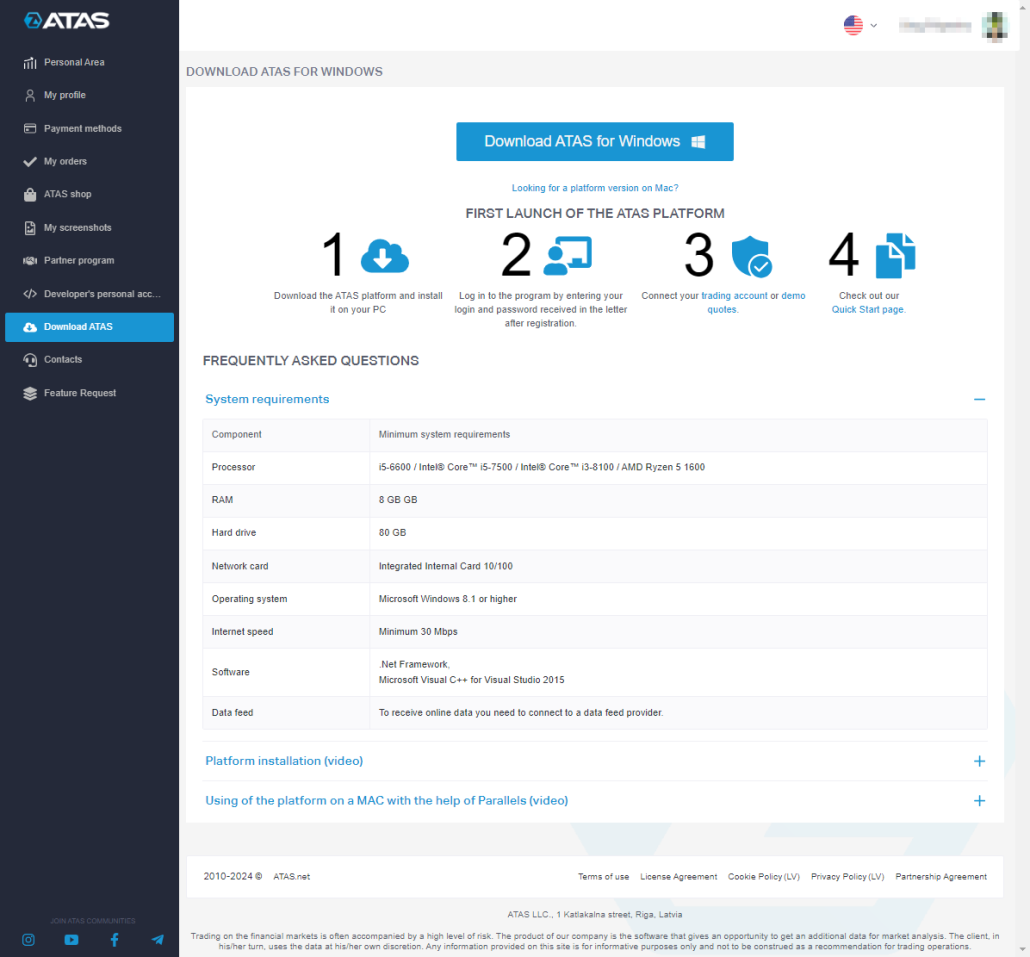
It is easy with three steps:- Visit atas.net.
- Register by providing your current email.
- After registering, log in to your account. In the Download section, you will find a link to download the installer.
- License pricing. Licenses are often available at a discount during promotions.
- ATAS YouTube channel. Webinars with professional traders, and video overviews of ATAS platform features.
- ATAS blog. Useful articles on trading and volume analysis.
MAIN WINDOW OF THE ATAS PLATFORM
Upon loading, the Main Window opens. This is where the management of all modules and elements of the platform takes place.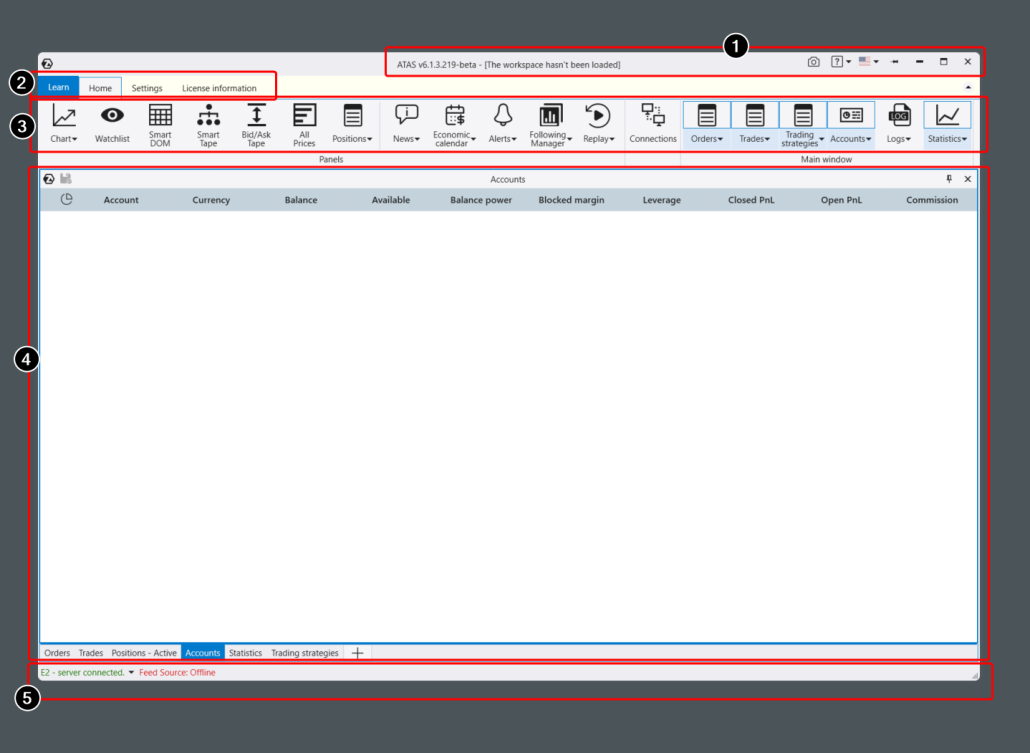
| Top Bar (1) | Main Menu Tabs (2) | Main Menu Buttons (3) | Workspace (4) |
| Here you can find: | There are four tabs: | For example: | |
| Program version and workspace name (if loaded); Help menu; Interface language selection button (languages available include English, Spanish, German, Russian, and others); Screenshot creation button with subsequent online upload. | Learn. Educational materials on volume analysis and using the ATAS platform. Home. Frequently used buttons. Settings. Tools for platform customization (colors, workspaces, time zones, and other settings discussed below). License information. Duration and type of active license. | the Chart button opens the chart module, the Connections button opens the connections manager window. The set of buttons changes when switching tabs. | This is where you can organize your trading journal and view account data, trades, and positions. You can also add charts and other modules here. |
LEARN TAB
The Learn tab in the main menu (highlighted in blue) offers helpful tutorials on using the platform and basic information about tools for volume analysis.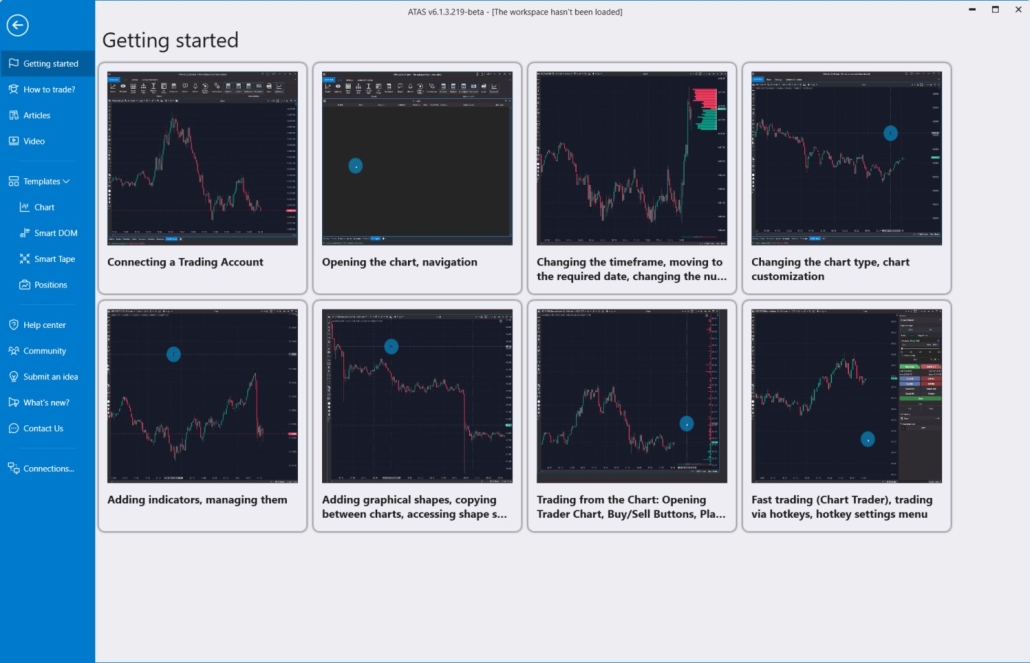
- watch animations showing how to perform basic actions (e.g., opening a chart, connecting quotes);
- learn how to use indicators;
- read helpful articles and watch videos about trading for beginners;
- use pre-installed templates;
- reach out to support or join the community.
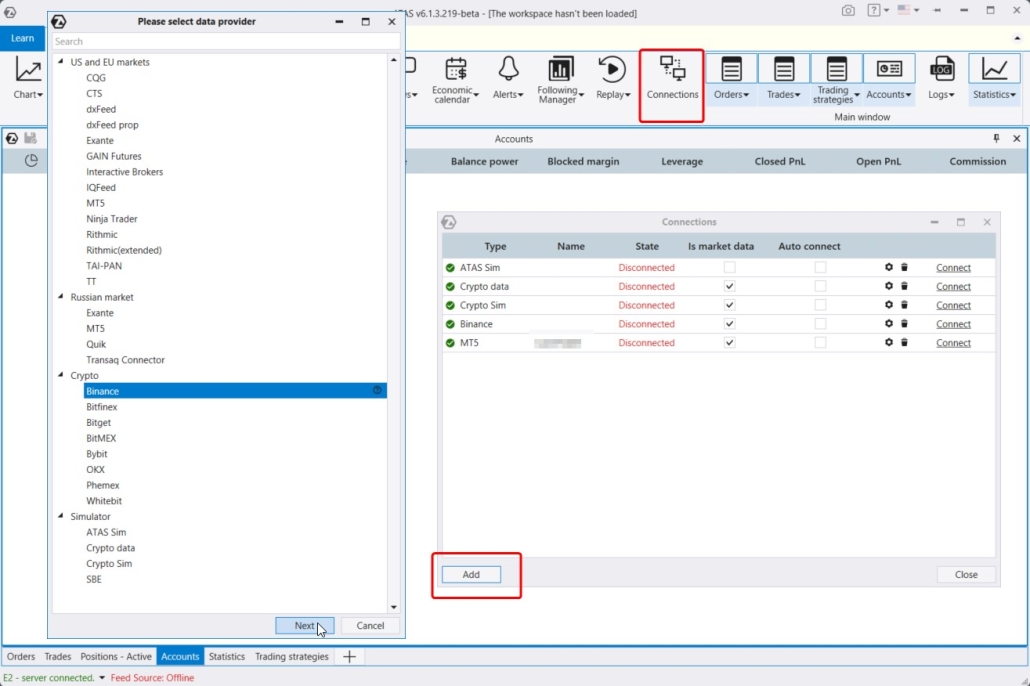
CONNECTING QUOTES
ATAS connects to its servers to load historical data. To receive real-time data, you need to set up connections with exchanges/brokers. To manage connectors, click the Connections button. In the window that opens:- Click Connect to activate an existing connection;
- Click the Gear icon to configure the connection;
- Click Add to create a new connection.
SMART DOM MODULE
DOM stands for the Depth of Market. The Smart DOM is a specialized module for working with the order book. In the Smart DOM, you can see limit buy (1) and sell (2) orders.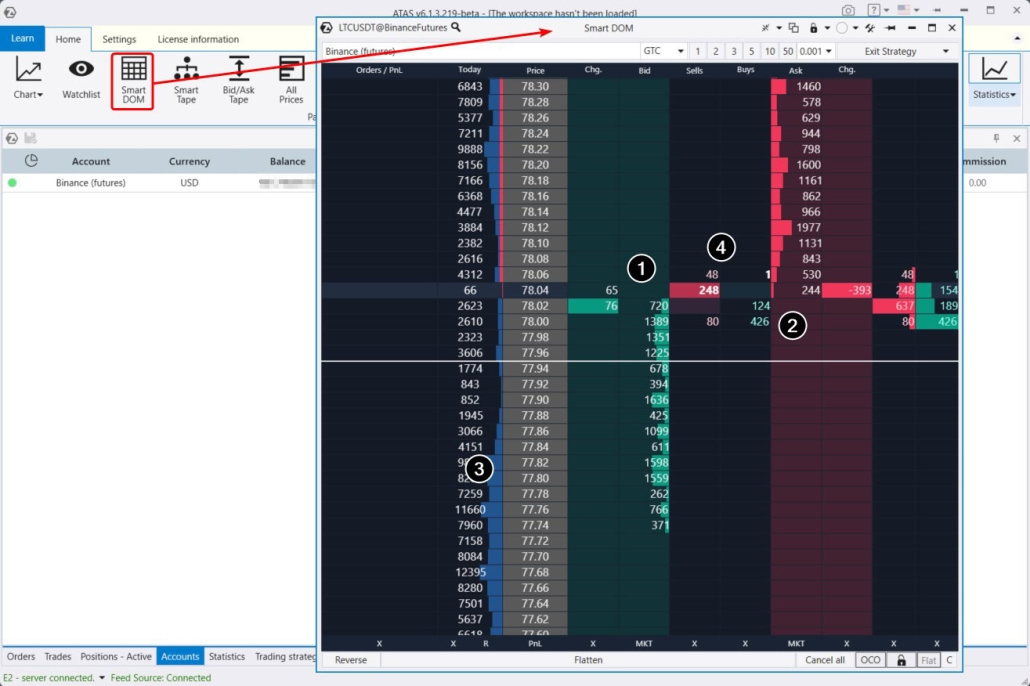
- displaying profiles (3);
- showing your open trades and orders;
- tracking executed trades on the exchange (4);
- saving and loading various templates.
- the top panel includes account selection, trade volume selection, and an exit strategy function;
- the bottom panel has buttons for reversing or closing all positions.
SMART TAPE MODULE
The Smart Tape is an advanced time and sales ticker, providing data on recently executed trades in a familiar columns format—Time, Price, Volume, etc. Unlike similar tools, the Smart Tape module in the ATAS platform presents data streams in an easy-to-analyze format by grouping similar orders (aggregation algorithm).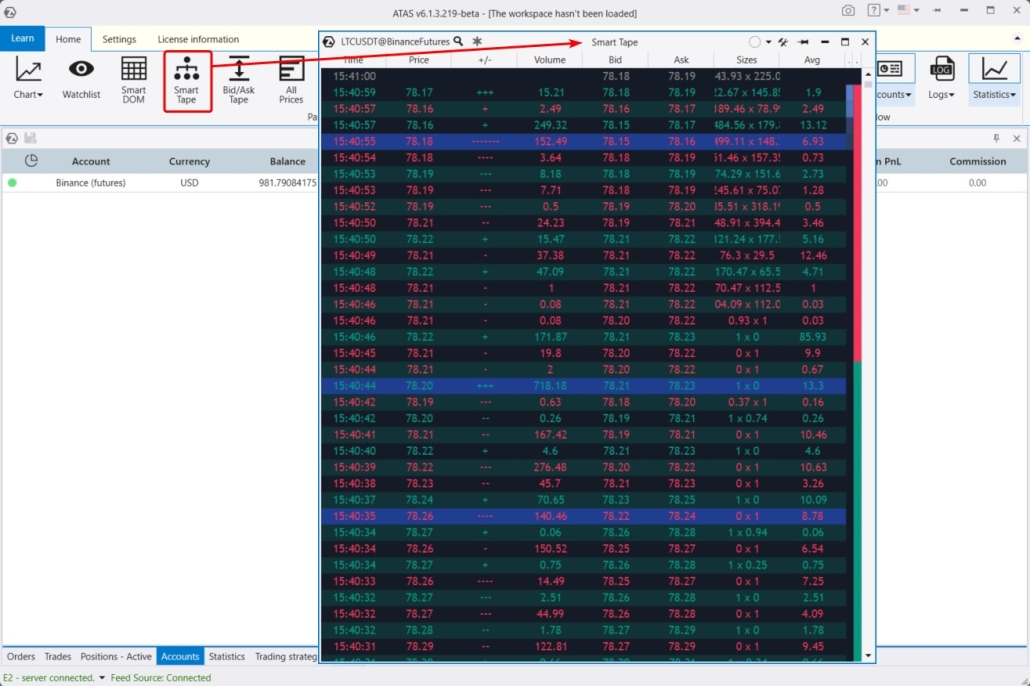
- Red text indicates market sells, while green text indicates buys.
- Blue text highlights out-of-spread trades.
- The +/- column shows the number of consecutive Up/Down ticks. For example, if the price was 100 and the next trade is at 101, you will see a “+”. If another trade occurs at 101, the “+” remains. If the following trade is at 102, it changes to “++”. If a trade occurs at 101 afterward, you will see a “-“.
- a “freeze tape” button that enables you to pause the tape to analyze specific sections closely;
- filters to eliminate market noise;
- indicators for tape speed and buying/selling strength;
- flexible customization for colors and templates.
BID/ASK TAPE AND ALL PRICES MODULES
The Bid/Ask Tape module, also known as the Spread Tape (highlighted as 1), shows buys and sells within the spread. While the spread remains constant, buy trades accumulate in the print. This presentation style is useful for clearly identifying the balance between buyers and sellers, helping you see who has the initiative.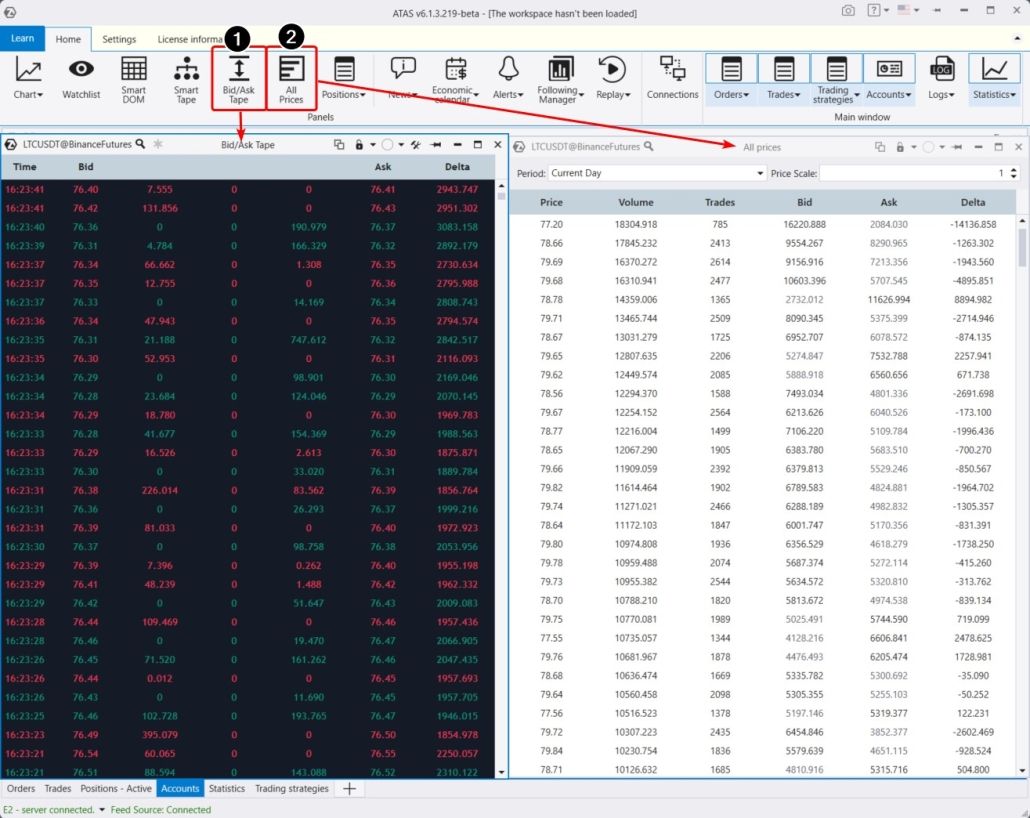
- How to Use the Spread Tape
- Spread Tape in the Knowledge Base
- Overview of the All Prices Module in the Knowledge Base
- Article: Creating Key Levels Using the All Prices Module
ALERTS AND ECONOMIC CALENDAR MODULES
The Economic Calendar module is a tool designed to help you keep track of fundamental events that might impact financial markets. It lists dates and times for the release of key statistical data, like inflation rates, unemployment figures, GDP growth, central bank interest rate decisions, and other important economic news. Traders use this calendar to plan their trading activities, aiming to reduce risks during expected volatility spikes, as significant news releases can greatly influence the prices of currencies, stocks, and other financial instruments.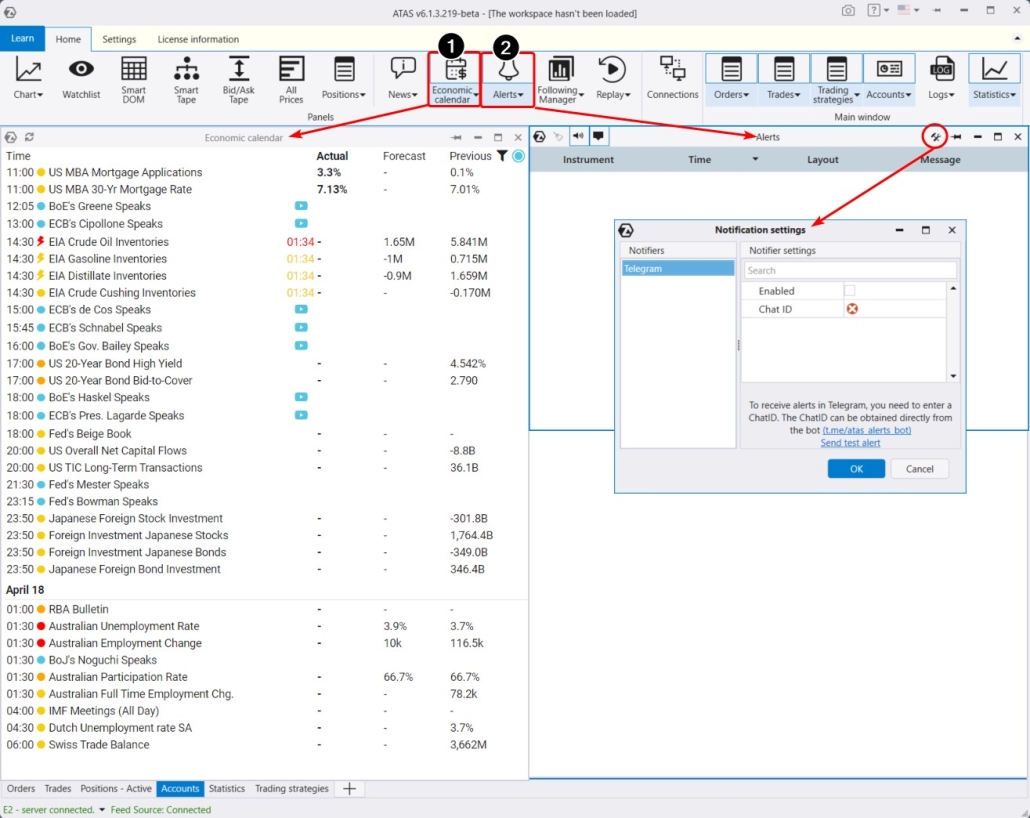
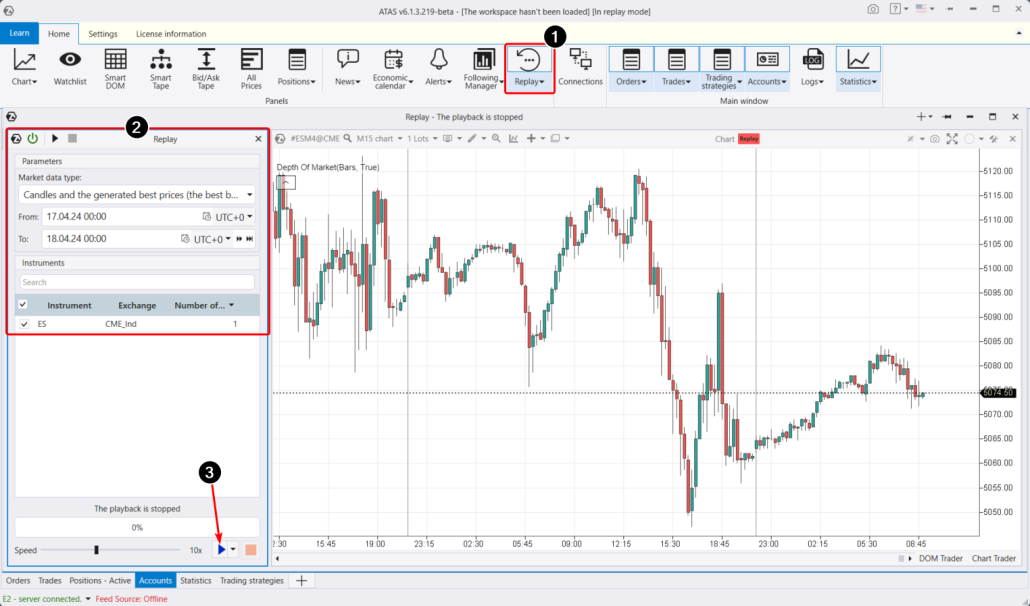
Market Replay Module
The Market Replay module is a tool that enables traders to practice their trading skills without risking real money. This feature is often referred to as a simulator or trading trainer. With ATAS Market Replay, you can:- replay historical data as if the trading were happening in real time.
- trade on a demo Replay account.
- supports cryptocurrencies, futures, and stocks;
- allows you to adjust playback speed;
- works with chart modules, Smart DOM, and others;
- supports footprints, indicators, algorithmic strategies, and other tools from the ATAS arsenal.
CHART MODULE
This is probably the main module and there is a lot of information about it. To make it easier, we have divided it into 3 sections: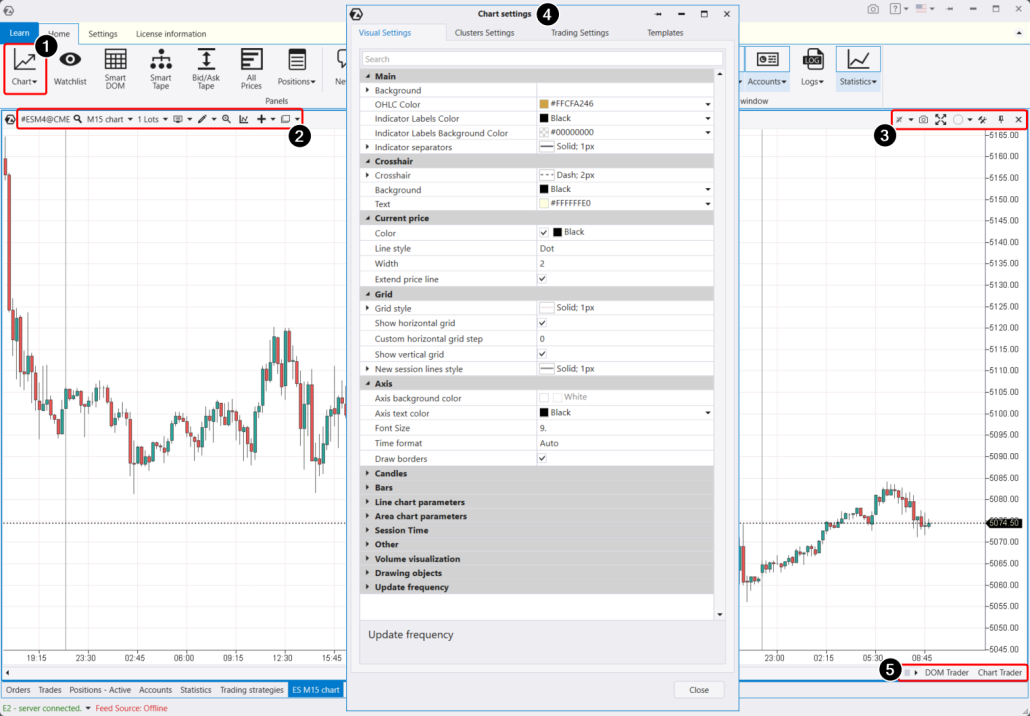
- upper left menu (2);
- upper right menu (3);
- settings manager (4);
- lower right menu (5).
Overview of Chart Module Settings and Menu
Settings in the upper left menu enable you to:- Adjust the timeframe (including custom and unique ones).
- Set the chart type.
- Activate drawing objects (lines, profiles, labels).
- Add/adjust indicators (both classic and advanced, totaling over 100).
- Connect automatic chart strategies (here you can access developed trading strategies for algorithmic trading).
- Activate the magnifying glass.
- Use chart templates, which can be stored in a list or saved as separate files on your hard drive.
- Adjust the vertical scale (level of detail).
- Take a screenshot of the chart. After pressing, a browser page will automatically open with a link to the screenshot.
- Assign a group to the chart.
- Expand the chart to full screen, close it, or pin it.
- Access the tool manager.
- Launch the Chart Trader panel for trading.
- Launch the DOM Trader software for scalping.
- Visual settings (change background, text, candles, lines).
- Cluster settings (cluster background color, text size in clusters, and many other parameters discussed in the third article).
- Trading parameters settings, where you can change marker colors for trades, positions, and other visualizations.
- Template settings.
CLUSTER CHARTS
To switch to cluster chart mode (footprint), you can use several methods: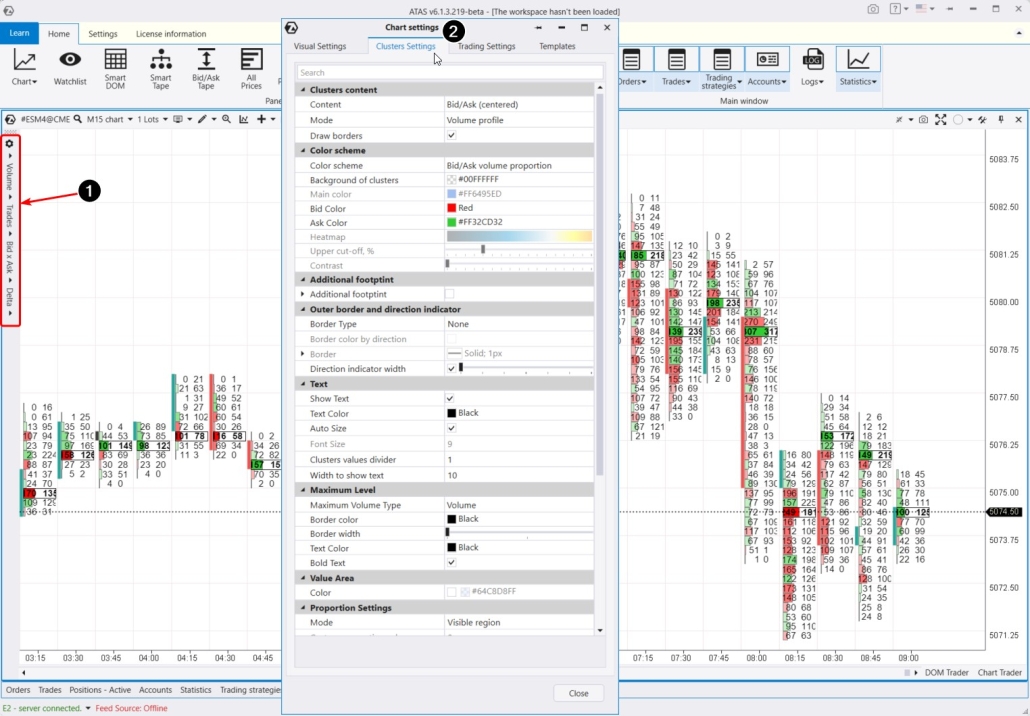
- Content – select the information to display within the clusters;
- Mode – choose different ways to display this information;
- Color Scheme – select color schemes, including gradients;
- Level Settings (Point of Control, Value Area);
- Proportion settings.
- Getting Acquainted With ATAS. Cluster Charts
- Article on Cluster Analysis
- Cluster Chart Settings in the Knowledge Base
Indicators
You can open the indicator manager in several ways:- By pressing the keyboard shortcut Ctrl+I.
- From the top menu bar.
- By right-clicking to open the context menu and selecting “Indicators.”
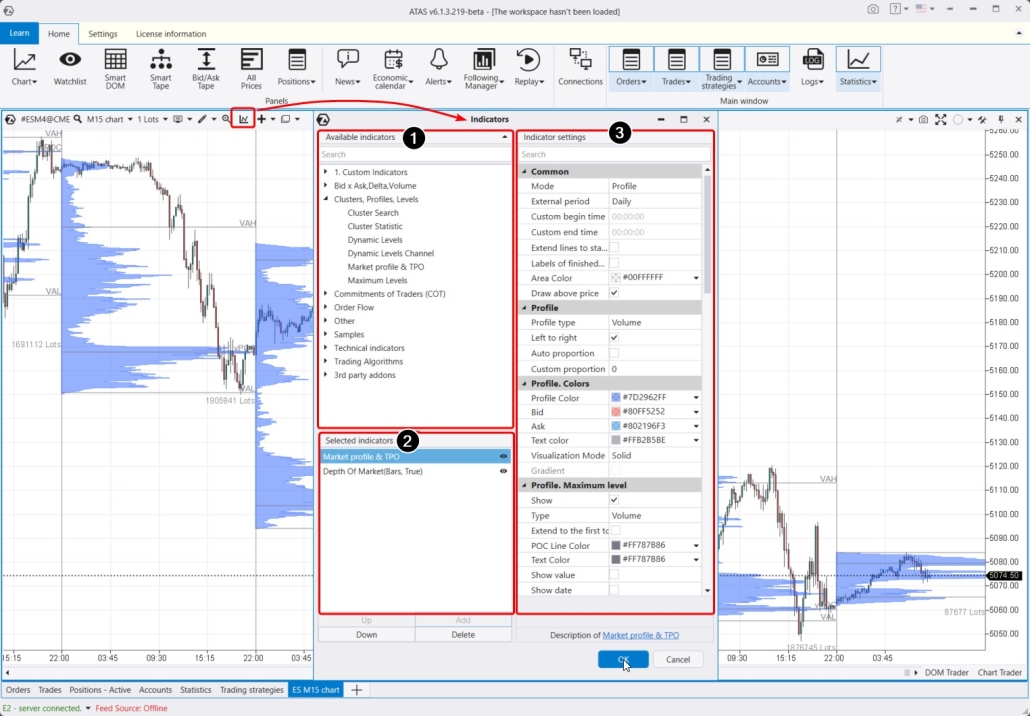
- Bid, Ask, Delta, Volume. This group includes indicators for vertical volume, delta, cumulative delta (which shows the dynamic change in the balance of buyers and sellers).
- Clusters, Profiles, Levels. This group features the powerful Cluster Search indicator for working with clusters. It also includes volume profile and its derivative indicators for dynamic levels and maximum levels, as well as cluster statistics.
- Order Flow. This group includes the Big Trade indicator, which detects large trades in the tape and displays them directly on the chart, whether aggregated or individual. There is also the Dom Levels indicator, which shows order book levels directly on the chart. Market Power, Speed of Tape, Tape Patterns, and Order Flow Indicator are derived tools from the tape used to analyze the order flow. The Speed of Tape indicator is particularly noteworthy.
- Other. This group includes the Depth of Market, the External Chart, which displays candles for the selected period over the regular chart. Then you can find user-created custom indicators, RTIndicator, and HRanges. You can set session colors and differentiate sessions by colors.
- Technical Indicators. This group contains classic indicators such as RSI, MACD, and CCI, as well as the margin zones indicator. The Open Interest indicator (for Moscow Exchange futures) shows real-time trader entries and exits. These indicators can be combined with volume analysis indicators.
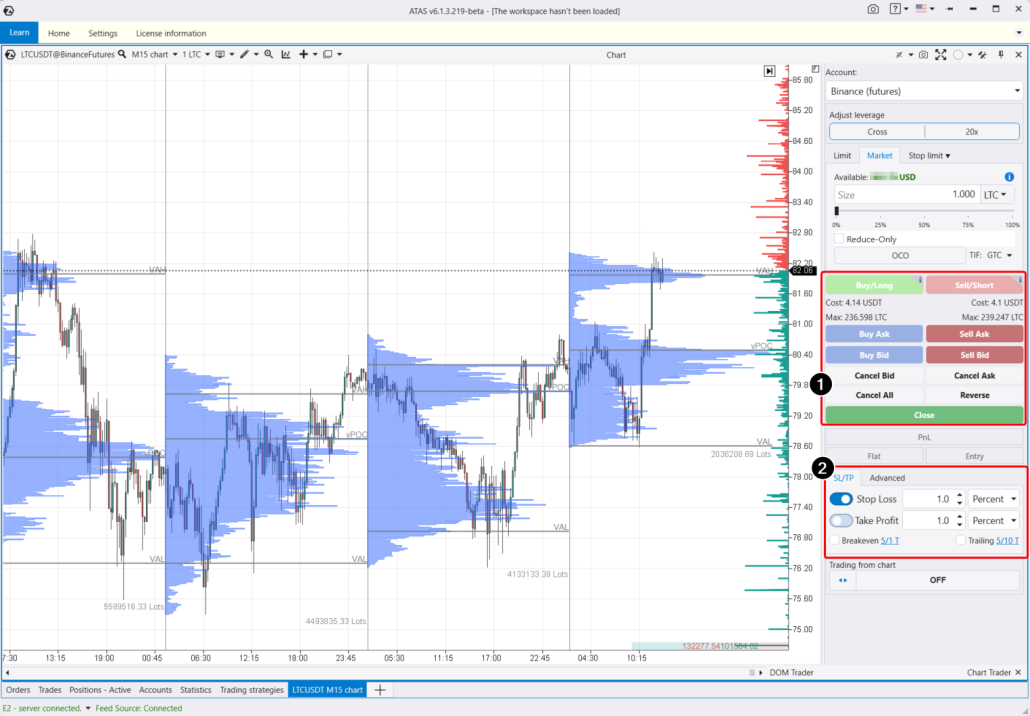
Chart Trader Panel
Chart Trader is a trading panel that can be activated in two ways:- by clicking the corresponding button in the bottom right menu;
- by pressing the Ctrl+T key combination.
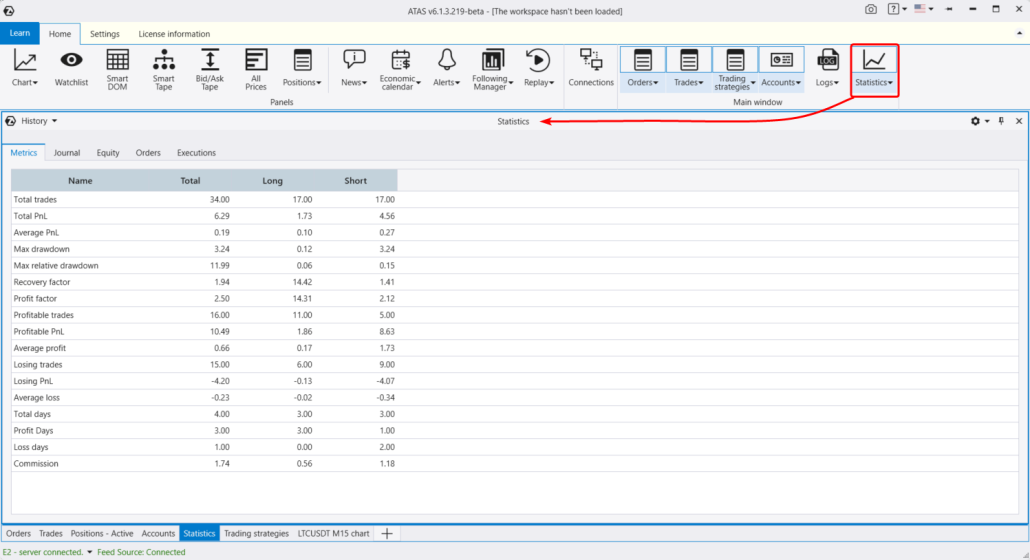
- their trade journal,
- the Equity curve,
- order information and execution details.
SETTINGS TAB
To conclude the article, let’s explore the remaining items in the main program menu.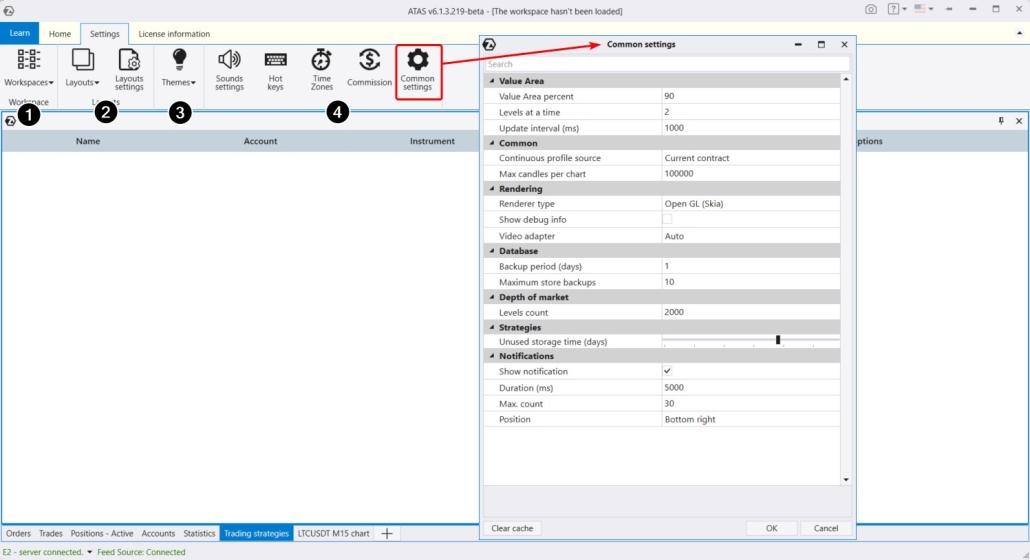
- Workspaces, which are created during platform use and saved upon shutdown.
- Layouts. You can add charts and platform modules to the layouts and switch between them for quick loading of selected windows. This is helpful for users with limited monitor space.
- Color theme. You can choose between light and dark themes.
- Additional settings.
CONCLUSIONS
You have taken your first steps toward mastering the ATAS platform. It is perfectly normal if you feel overwhelmed by its complexity and depth upon reading our introductory article on ATAS. We have provided a brief overview of a rather complex software product. Progress step by step, using the “Getting Acquainted With ATAS” series articles as your guide. If you have less than a year of experience in financial markets, you will learn a lot from these materials. In upcoming articles, we will provide detailed descriptions and instructions to answer all your questions and help you build a comprehensive understanding. What is next? Download the ATAS platform demo version and start practicing with its capabilities. Keep exploring the introductory materials by moving on to the second article Getting Acquainted With ATAS. Working With Charts.Information in this article cannot be perceived as a call for investing or buying/selling of any asset on the exchange. All situations, discussed in the article, are provided with the purpose of getting acquainted with the functionality and advantages of the ATAS platform.