We already published similar articles:
- How to combine the cluster analysis with the CCI indicator?
- How to combine the volume analysis with the MACD indicator?
- Cluster analysis and the Bollinger Bands indicator.
The present article is the final one in the series of the technical indicator publications and now we will speak about how useful the RSI indicator could be.
Read in this article:
- what RSI is, its description and calculation formula;
- how to trade using the RSI indicator – examples;
- results of the trading strategy with the use of the RSI indicator;
- the RSI indicator and cluster analysis.
What the RSI indicator is
RSI stands for Relative Strength Index. However, there could be some confusion with the name.The matter is that the ‘relative strength’ phrase, as a rule, assumes comparison of two exchange instruments. The goal of the comparison is to find out which one of them is stronger. For example, it is possible to compare:
- the biotechnology industry stock index and the financial industry stock index;
- an individual share and general stock index of the market;
- the USD index and the AUD index.
Such a comparison allows to analyze the relative dynamics of the prices of various instruments. If the stock acts relatively stronger than the general market, it belongs to leaders and, most probably, would be recommended for buying.
However, the RSI (Relative Strength Index) indicator doesn’t compare any different instruments. It is calculated exceptionally on the historical data of the price of some instrument – whether it is a stock, index, cryptocurrency or oil futures.
RSI indicator. Description
The ‘New Concepts in Technical Trading Systems’ book was published in 1978. Its author is J. Welles Wilder Jr.
In fact, RSI is an oscillator, which fluctuates in its values from 0 to 100. RSI is an impulse indicator, which runs the recent price values through its formula in order to assess the conditions of overbuying or overselling the stock, bond, futures or another asset.
Read in our Knowledge Base how to add the RSI indicator to the chart. This is how the RSI indicator looks like in the Brent oil futures chart (the chart period is 15 minutes).
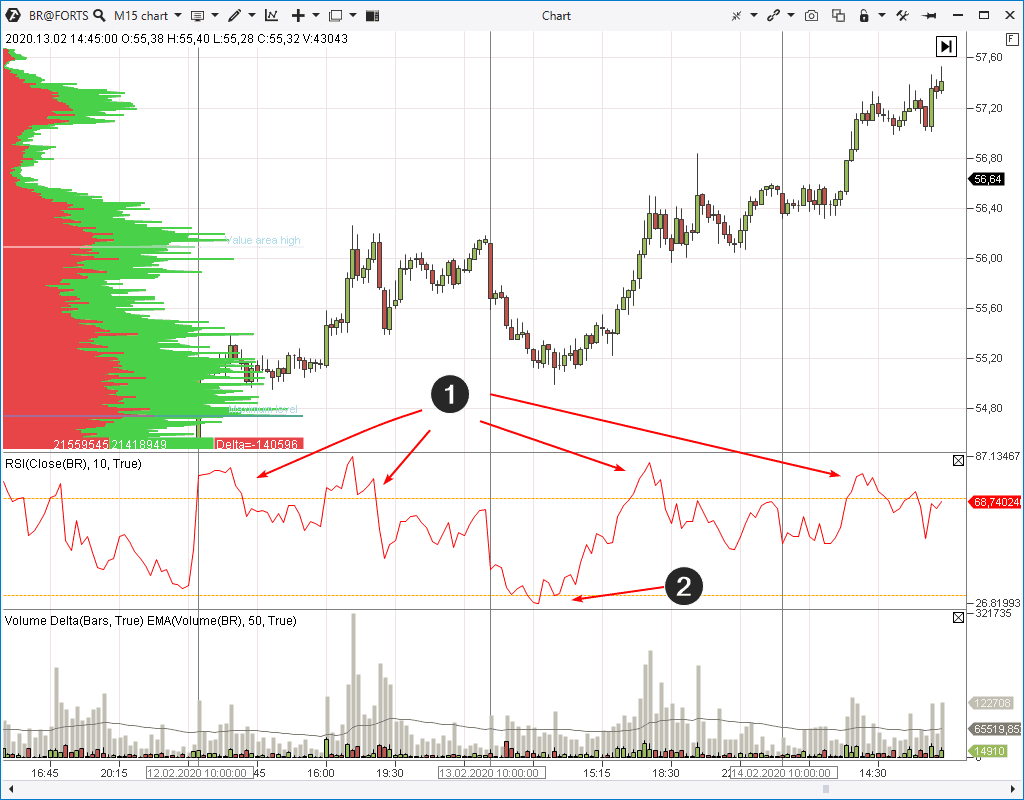
- The instrument is overbought (overvalued) if the line moves above the value of 70.
- The instrument is oversold (undervalued) if the line moves below the value of 30.
In this case, a moderate uptrend was in the oil futures market and the indicator moved in the overbought area 4 times. It showed that the instrument is oversold only once.
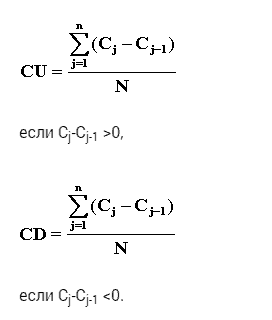
The RSI indicator formula
The following formula is used for calculating the RSI indicator: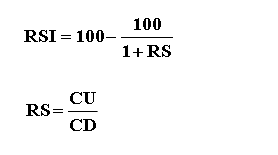
- CU(n) – is an average value of the positive closing price changes (C – close) for ‘n’ previous periods.
- CD(n) – is an average value of the negative closing price changes (C – close) for ‘n’ previous periods.
The average value is calculated by the following formula:
Setting the RSI indicator
The RSI indicator has very simple settings.- Period. This parameter identifies how much data should be taken into account. The longer the period, the less historical data are used and the slower the indicator changes its value. The standard value of the indicator period is 14.
Incoming data, which are used in the calculation. As a rule, the closing prices (C – close) ‘get into’ the formula, however, the following could be applied in the calculation: opening prices, OHLC, typical price (HLC/3) or some other incoming data (we will show you below).
The RSI indicator signals
The picture below shows the RSI indicator typical signals, which you can use for building your own trading strategy.The upper part of the picture is the bitcoin chart (15-minute period; the data are from Bitfinex), the AAPL stock chart (day period) is bottom left and the Moscow Exchange Brent oil futures chart is bottom right.
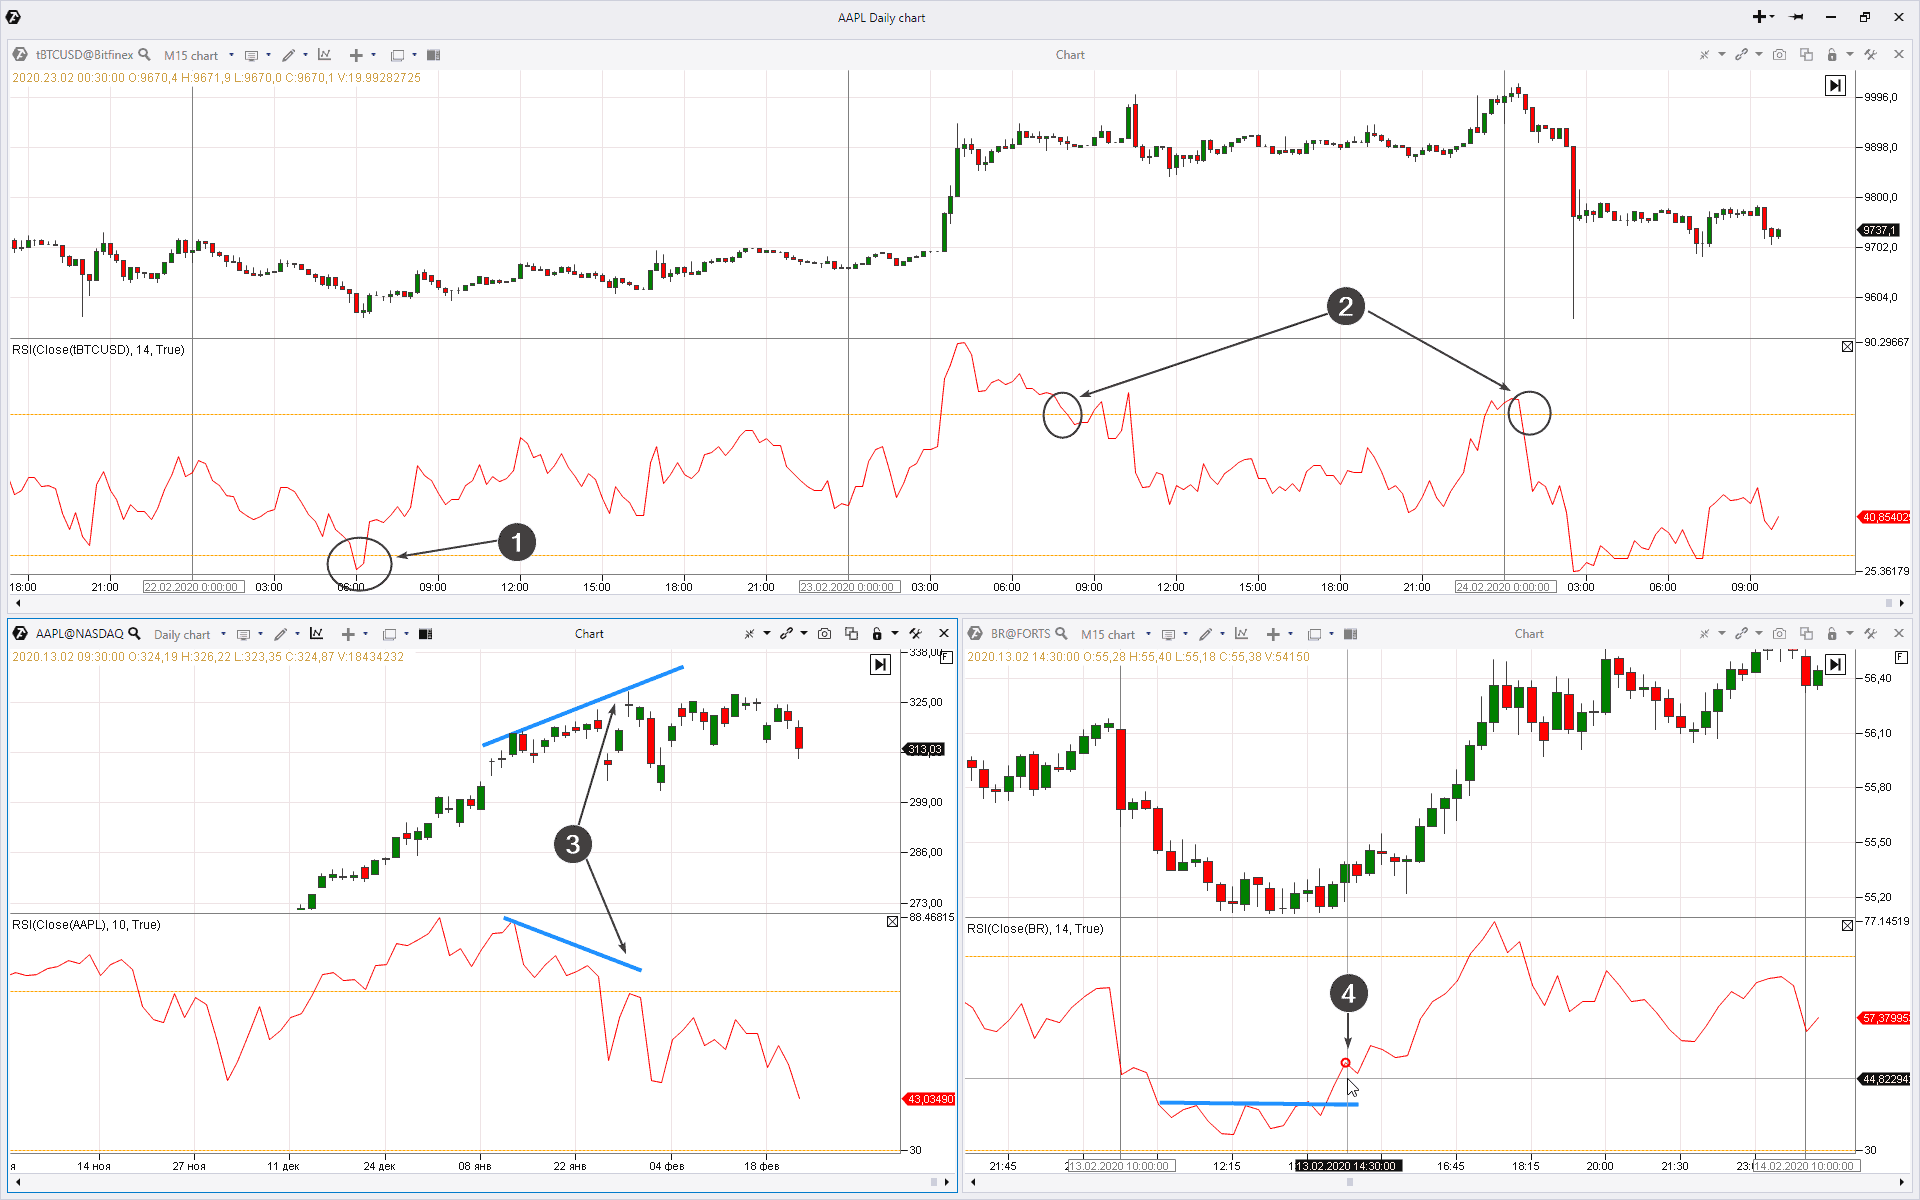
- Buying when exiting the oversold area.
- Selling when exiting the overbought area.
- Divergence. If the price forms new highs and RSI points to the descending highs, it is a sign of the trend weakening.
- Buying after breaking the trend line, built by local extreme points.
These are not all the variants of the RSI indicator application. Every trader selects his own indicator settings and also the signal type (for example, crossing the zero line) so that RSI would help in trading with maximum efficiency.
Testing on the RSI strategy history
The RSI developer assumed that the indicator would be used subjectively, in other words an analyst should have certain skills in order to apply RSI in a combination with other indicators or patterns rather than automatically.However, RSI still could be used as the only trigger for entering and exiting the market.
Robert W. Colby describes one experiment in his ‘Encyclopedia of Technical Market Indicators’. The idea of the experiment is testing the trading strategy with the use of the RSI indicator.
Here are the experiment results.
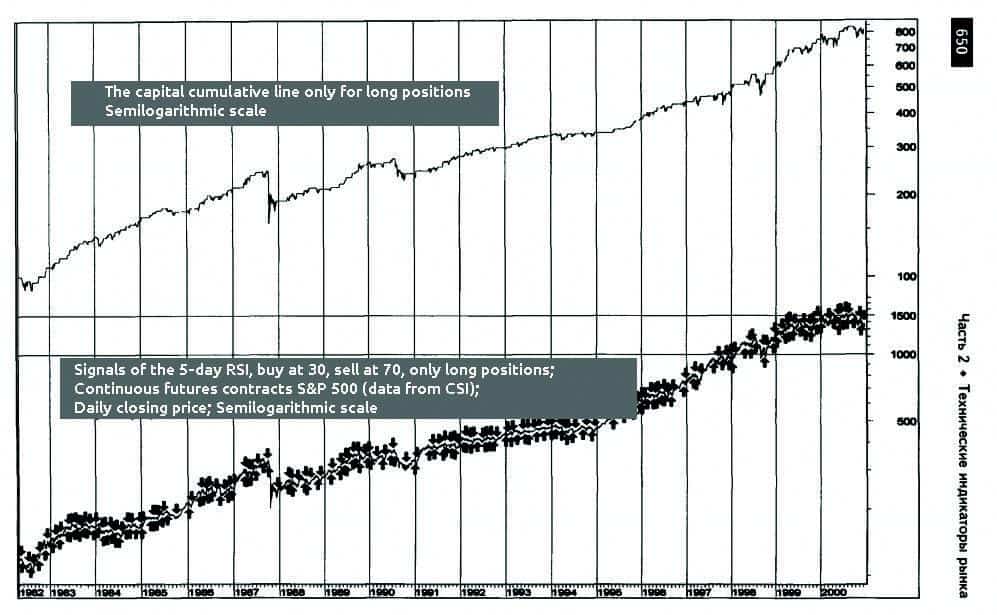
- enter into a long when RSI (5) moves to the area below 30;
- exit from a long when 5-day RSI moves to the area above 70;
- enter into a short – never.
As you can see, RSI allows acceptable buys of falls in the globally growing market. The experiment showed that the indicator signals were profitable in 86% of cases.
Acting in accordance with the described strategy, an investor could make USD 717, initially having USD 100, during 18 years (1982-2000).
Application of RSI and the cluster analysis
How to use the RSI indicator in a combination with the cluster analysis. We will show it through an example. The picture below shows the Brent oil futures chart with a 30-minute time-frame. The RSI and Cluster Statistic indicators were added to the chart.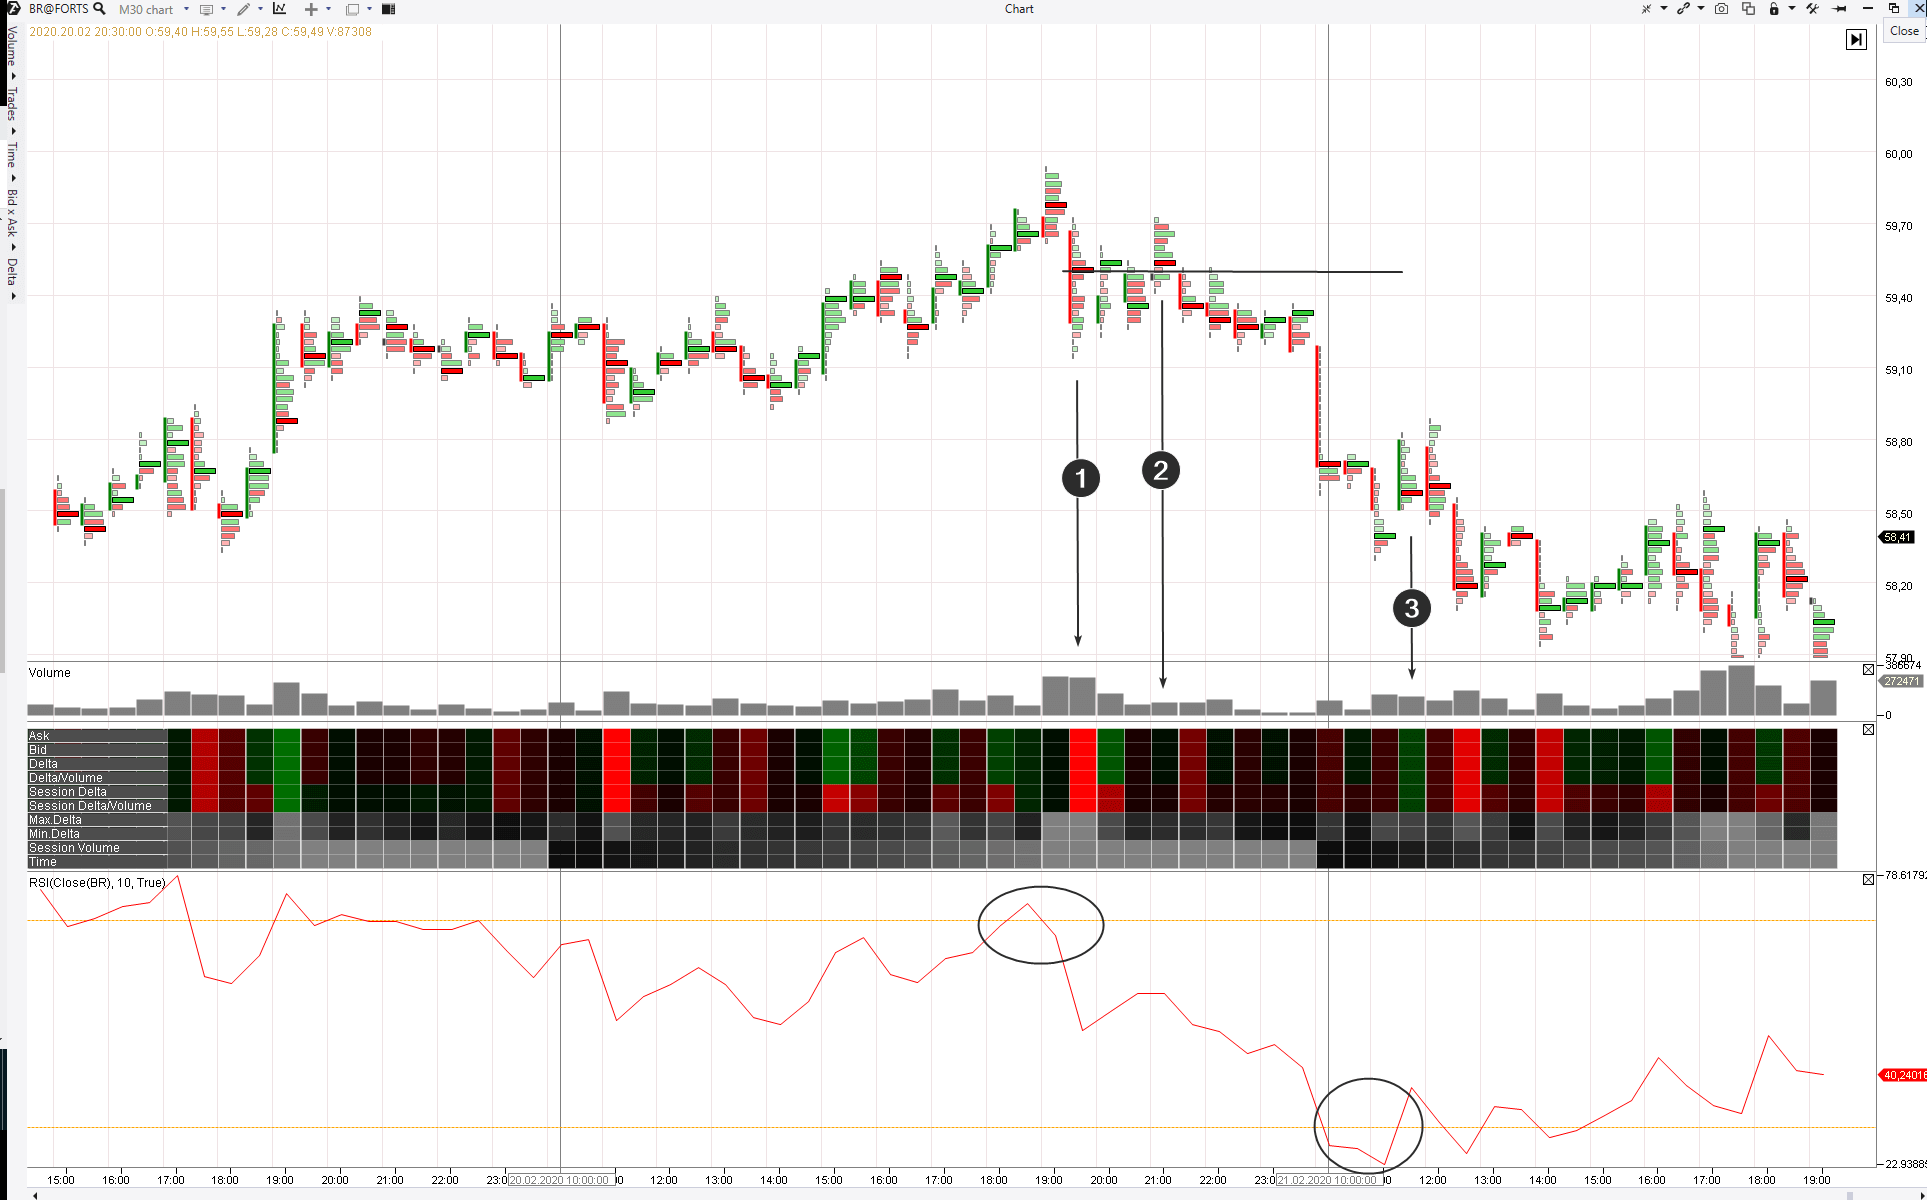
The first signal – for selling – appeared simultaneously with the ‘red flash’ on clusters (arrow 1). These bright red clusters mean executed sell orders. Which means that a serious seller successfully pressed the market pushing the price down. The RSI indicator signal looks logical in a combination with this fact.
Arrow 2 points to the growth effort over the level of the maximum volume of that candle, where the ‘red flash’ appeared. The volume is small on the growth effort. Most probably, it means the demand weakness. This indication confirms the market vulnerability. So, according to our estimate, the sells in the 59.50 area had positive chances for a profit.
The second RSI indicator signal – for buying – appeared the next day. The morning down gap played an important role in the signal appearance. However, let’s look at the clusters. Is the RSI exit from the oversold area accompanied with the ‘green flash’ (buyers’ activity)? It is evident that not. It is not a surprise that a potential buy on this signal soon turned out to be a loss.
Nonstandard use of RSI
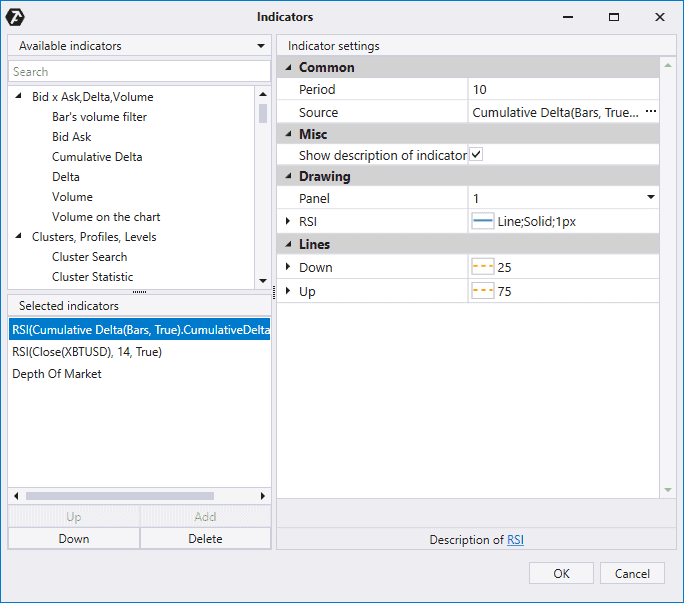
ATAS platform provides a multitude of creative solutions for the market analysis and strategy building due to its flexibility. We will show you now a lifehack on the basis of the RSI indicator.We will add two RSI indicators to the chart with the same period of 14, but with different bases.
- One indicator is calculated on the price basis (standard RSI).
The other one – RSI on Cumulative Delta – takes the Cumulative Delta data as the basis.
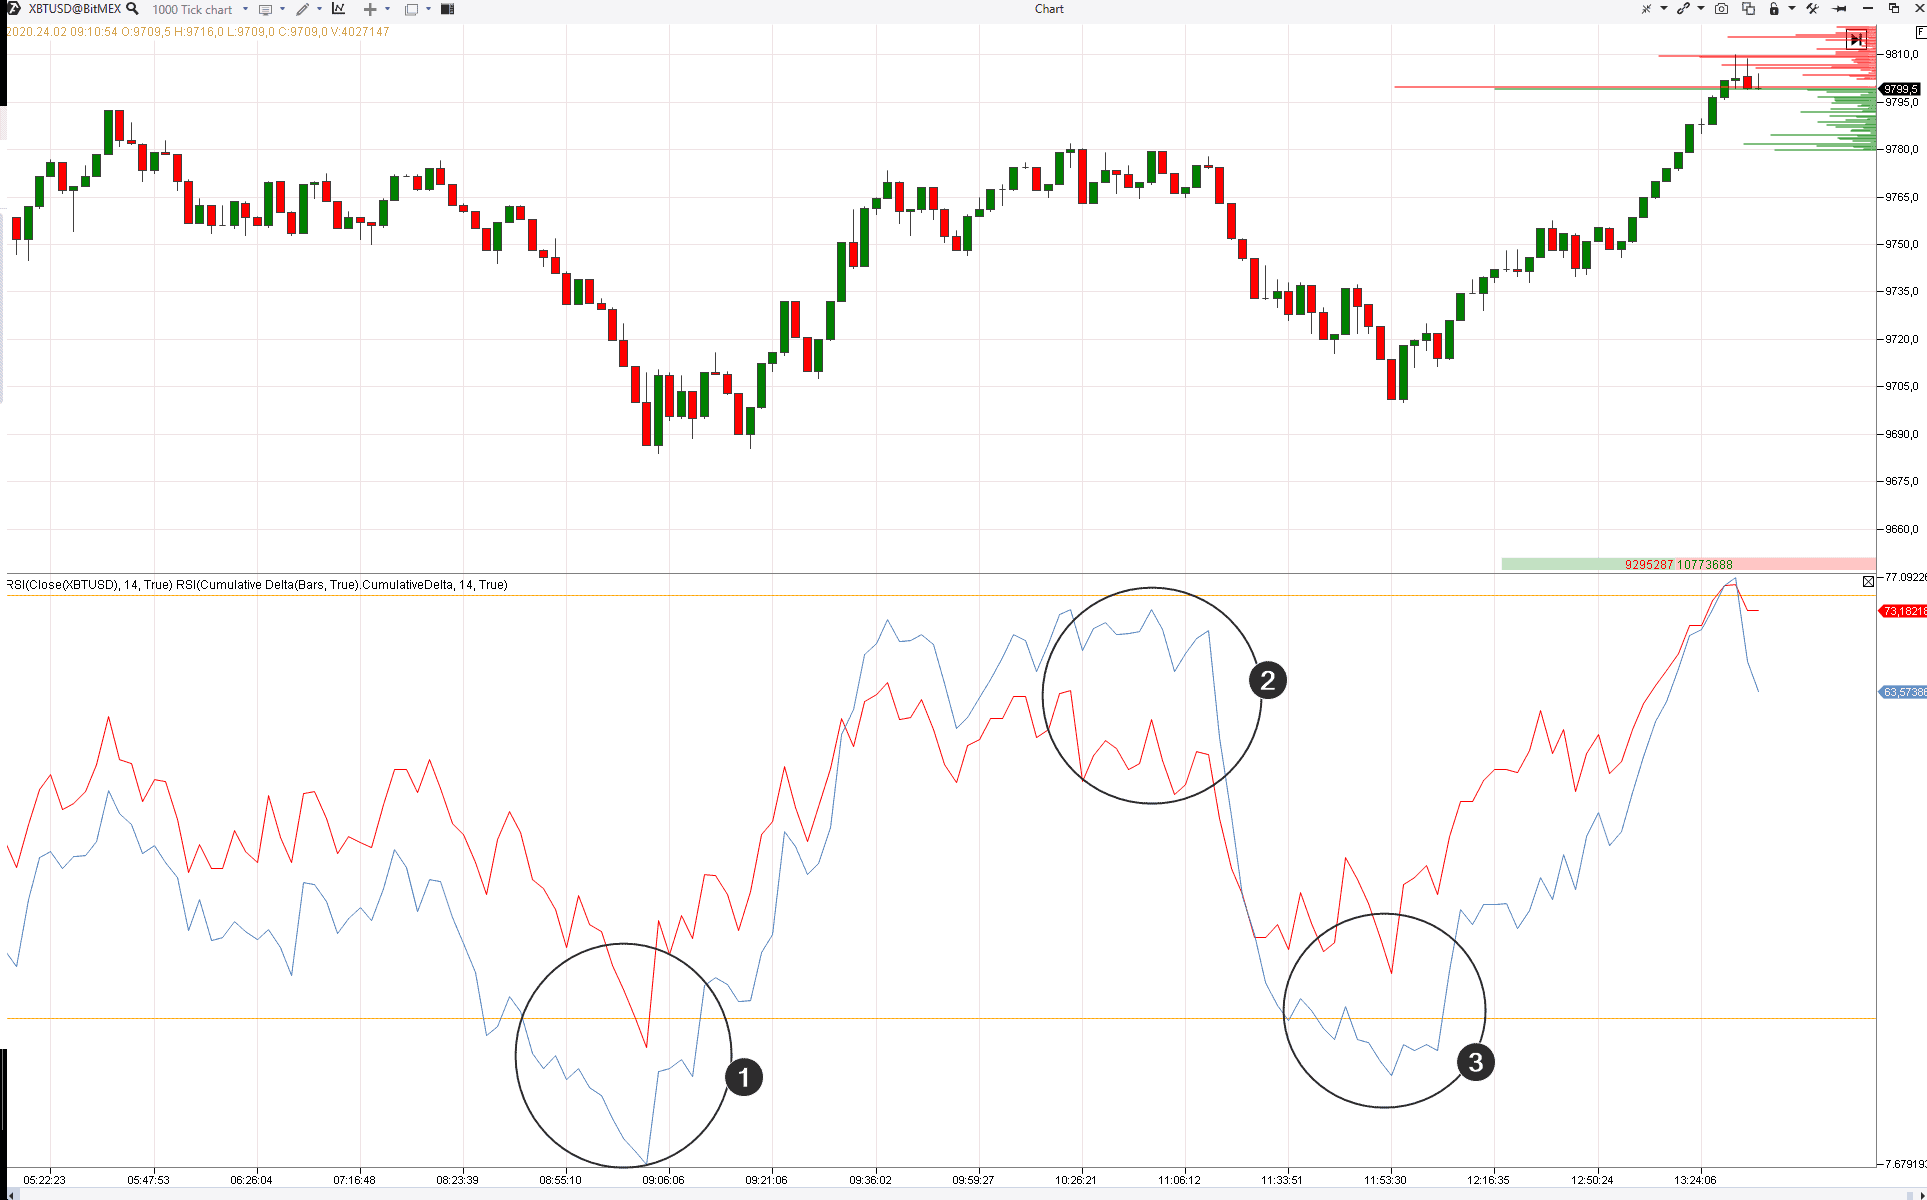
- At this moment, the blue RSI on Cumulative Delta moved deeper into the oversold area. The red RSI turned out to be higher.
- The situation is opposite when it is closer to the overbought area. RSI on Cumulative Delta moved higher, forming a breakaway from the red line.
- The situation from item 1 repeats itself.
There is an idea for building the trading strategy:
- to buy a contract when the blue line moves downward from the red one in the oversold area;
to sell when the blue line moves upward from the red one in the overbought area.
Something important lies in the basis of this strategy – the law of effort and reward.
If there are mass buys in the market (the blue line moves upward, since the cumulative delta grows) and the price slows down in its growth (the red line goes behind and moves down forming a break with the blue one) it means that the buyers’ efforts do not produce a result. Why? Perhaps, a major limit order seller keeps prices down and, meeting a flow of buys, builds a short position. In other words, the market met resistance.
The same is below, near the oversold area. The pressure of sells (the blue line moves down) doesn’t correspond with the progress of the price decrease (the red line stays higher and forms a break with the blue one). It testifies to availability of a powerful hidden buyer and probable low.
Summary
RSI is one of the most popular among hundreds or thousands (or even dozens of thousands) of indicators. Practically all books on technical analysis contain description and application of the RSI indicator. However, popularity is not always equal to efficiency.If you want to use the RSI indicator in your trading, make sure that this would strengthen your trading advantage. Download ATAS and learn how to find profitable setups. Let’s the trend accompany you whether with or without RSI!
Information in this article cannot be perceived as a call for investing or buying/selling of any asset on the exchange. All situations, discussed in the article, are provided with the purpose of getting acquainted with the functionality and advantages of the ATAS platform.