Можно ли совместить индикатор MACD с объемным анализом?

How to combine the MACD indicator with volume analysis

Read in this article: about the indicator developer; what the MACD indicator shows; MACD signals; description and application of the MACD indicator.

Volume Profile. Как работает индикатор профиля объема в ATAS?

How the Volume Profile indicator works in ATAS

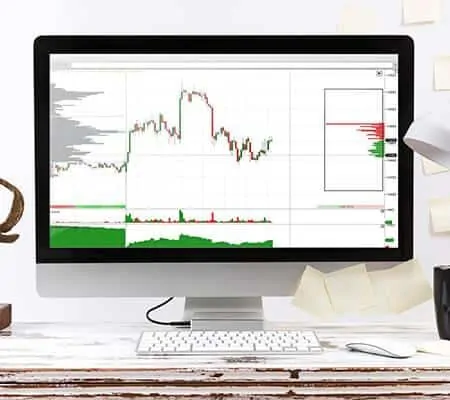
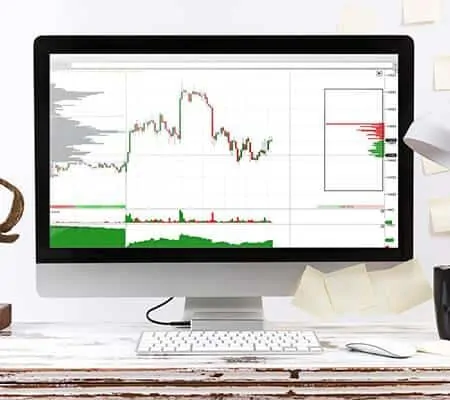
ATAS always tries to improve in order to provide the maximum of convenient and useful instruments for analysis and trading. An important and useful indicator – Market Profile – has been updated recently in the platform functionality. This article is a review of capabilities of the Market Profile in the form it has been available […]

Платформа для анализа котировок акций в реальном времени.

Platform for analyzing stock quotes in real time

In this article, we will speak about price quotes: what it is; where to view the quoting history; quotes in real time. Quote is the cost or price of a commodity. The word originates from the French ‘to number’ or ‘to mark’. Securities are quoted or numbered on the exchange and registered in the quotation […]

Which indicator fits best of all for an entry

Which indicator fits best of all for an entry?

Let’s frankly admit that there is no ideal indicator for an entry into an exchange trade. If it were, there wouldn’t be hundreds and thousands of other indicators for an entry. To have a stable profitability each trader should have: Trading system. Properly studied instruments. Capital management rules. The indicators you comfortably work with belong […]

Индикатор Dynamic Levels.

Analysis of Trading Levels With the Help of Dynamic Levels

Are you interested in the volume trading strategies? ATAS will help you. In this article, we will talk about one of the very useful indicators of the ATAS platform. Namely, we will speak about Dynamic Levels. Read in this article: What the Dynamic Levels indicator shows? The Dynamic Levels indicator review. Variants of application of […]

Открытый интерес. Как использовать в трейдинге?

Open Interest. How to use it in trading?

We already wrote in this article about what the Open Interest (OI) is and where and how it is formed. If you read that article, you know that the Open Interest is formed only in the forward markets (futures and options). Today we will continue to discuss the Open Interest. In this article we will: […]

Кумулятивная Дельта

Cumulative Delta Analysis

We devote this article for beginners to the Cumulative Delta. Why is it important? Why is it useful? What are specific features of the Cumulative Delta application for trading on the exchange? Read in this article: what the standard Delta, Bids and Asks are; what the Cumulative Delta is; what the Cumulative Delta shows; how […]

5 видов биржевых графиков для быстрого анализа акций и валют MOEX.

5 types of exchange charts for a quick analysis of the MOEX

If you want to find online exchange charts in Google to learn about the USD or EUR exchange rates or current price quotes of stocks on MICEX (Moscow Interbank Currency EXchange), the search system will give you the answer in the search results in real time. You even will not need to go to other […]

Volume analysis. Why volumes are important

Volume analysis. Why volumes are important?

Why do professional traders pay so much attention to the trading volume? What is behind the Volume indicator? Why is the volume analysis important? We will try to answer these questions in this article in the popular-scientific form. If you have never used the volume, you would, most probably, wish to try to include it […]

TPO графики в ATAS. Как торговать?

TPO charts in ATAS. How to trade?

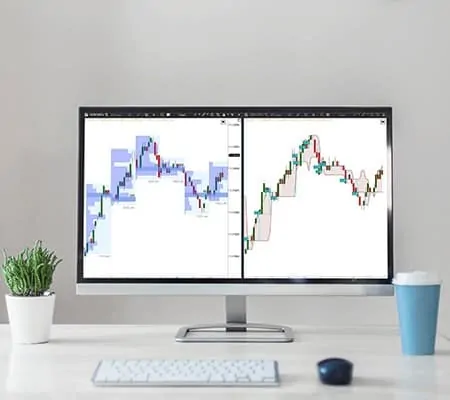
Many traders are acquainted with the Market Profile concept. In this article we will tell you about TPO. TPO is the basic concept of the Market Profile and for the first time it was applied by Peter Steidlmayer. TPO stands for: Time. Price. Opportunities. TPO appears in the chart as soon as the market touches […]