Setting of the Tape Patterns indicator and chart examples.
There are indicators the majority of traders know – for example, MACD, RSI and Delta. As a rule, you do not have to set up such indicators or their settings are very simple and consist of several steps.
There are other indicators, which traders do not use often, because:
- these indicators are not well-known;
- useless;
- traders do not understand how to use them;
- they do not want to ‘fiddle’ with settings.
This article is about Tape Patterns – a rarely used indicator
This indicator is not well-known but (since we write about it) very useful. The indicator works on all instruments/time-frames and will help you to get a competitive advantage during trading since it shows those signals in the chart, which the majority of other participants do not see.
Read in this article:
- what the Tape Patterns indicator shows;
- how to set the indicator up;
- examples of use.
Tape Patterns indicator
The Tape Patterns indicator takes data from the Smart Tape and marks areas in the chart by the set criteria.
The indicator doesn’t send magic signals for buying or selling by itself, but it significantly simplifies your work with the Smart Tape (what Smart Tape is). The tape moves very fast and even if you set filtration you can miss something important. Besides, it is difficult for a trader to estimate the tape speed by sight, while the Tape Patterns indicator helps to track intensity and speed of volume emergence.
The indicator is in the Order Flow section. All indicators of this group analyse dynamic information. In other words, they analyse the market data, which change in real time. The Order Flow is meant, first of all, for intraday trading. Since the data volume is very big, the indicator shows data only for the current trading session.
Tape Patterns settings are rather flexible, but you would not be able to use the indicator mechanically and namely this creates some difficulties. It is important to understand what exactly to look for and how to use this information. Watch this video on our YouTube channel in order to study all the indicator settings. By default, the indicator marks the price levels on the chart by the set criteria with coloured squares. If you want to see detailed information about a number of prints, you should mouseover a specific marked area and press Ctrl.
The Tape Patterns indicator helps you to see:
- the minimum volume of each of the prints – use the Ctrl button in the window with detailed information;
- the minimum sum of all prints, which take part in the chain;
- how far one print is from another one timewise;
- relation of the volume in one print chain with respect to another chain – you can compare sizes of different areas marked in the chart. If one square significantly differs from another one, it means that a bigger or smaller volume passed here;
- very fast formation of prints – as a rule, these are robots and high-frequency algorithms;
- formation of big single prints, that is the passage of big trades. A ‘big trade’ is identified for every instrument experimentally.
Significance of the dynamic indicator
In order to understand why such information is important for intraday traders, let’s compare the dynamic and static indicators.
Let’s assume that we have the previous day’s maximum volume level (POC) – it is the level, at which the biggest number of contracts or lots were traded in total for the whole previous trading session. It is a static indicator because it has already been formed and cannot change. The system summed up all the data at one price level (besides, the number of contracts they consisted of is not important).
It is important for intraday traders how many trades there were at what price level and of what sizes. The price level, at which 10 ticks by 100 contracts appeared, shows the interest from bigger players, than 100 ticks by 10 contracts. Although, the general volumes will be similar in both cases.
Besides, the managed money volumes are often formed very fast and a trader will not see them without special filters. For example, you should analyse differently the similar volumes, which were formed in 1 and in 5 hours. As a rule, the key volumes are formed fast and consist of big positions. Less significant volumes are formed long and may consist of a big number of small trades. However, there are exceptions from this rule. For example, trading volumes and volatility usually decrease on holidays and in summer.
Setting up the indicator
We will not be able to consider all multiple variants of setting up the Tape Patterns indicator in one article. Settings will be different for different instruments.
You will need to monitor the Smart Tape for some time, to know the daily average trading volume in the instrument and what trades for this specific instrument are big or small in order to be able to work with the indicator correctly and efficiently. You will need to ‘play’ with the indicator settings at different times of the day and on different days of the week.
Examples of the indicator use
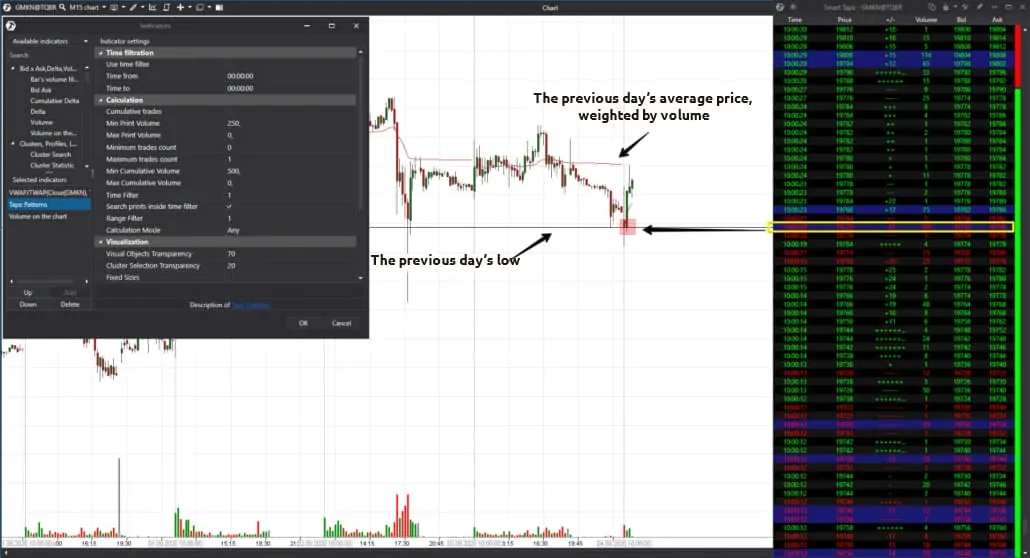
The first example is in the 15-minute PAO Nornickel stock (GMKN) chart.
We set up Tape Patterns in such a way so that we can see big prints. See Picture 1.
A big sell appeared at the previous day’s low, but the price didn’t move further down, which means that major buyers with limit orders stayed at that level. The price moved up and slowed down at the previous day’s average price level, weighed by volume – the VWAP indicator shows this level. You cannot sell mechanically by the indicator signal here, because the price reaction to emergence of big sells is important. Big sells, in this example, led to a reversal and intraday traders could have opened long positions with a potential take at the previous day’s VWAP level.
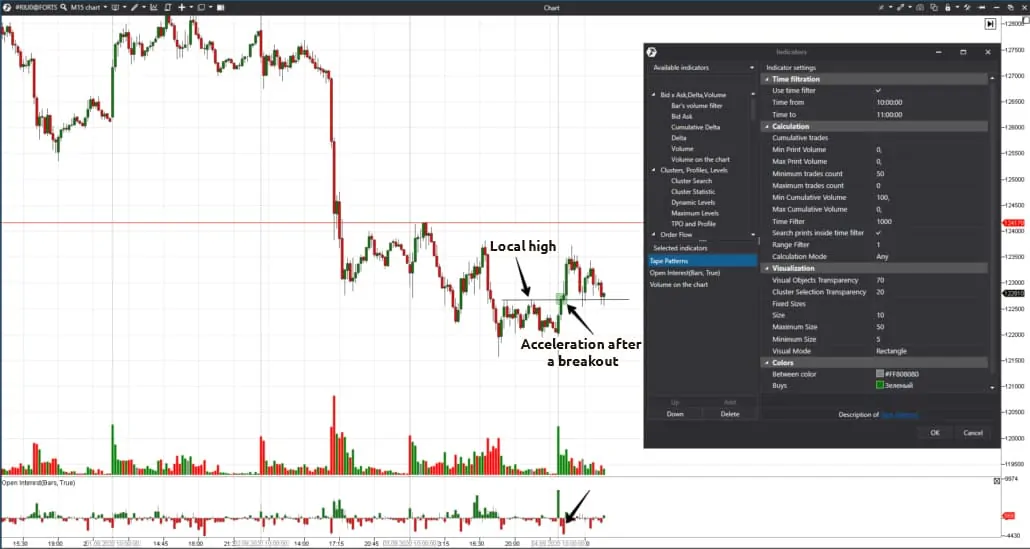
The next example is in the 15-minute RTS index futures (RIU0) chart. In this case, we use the Tape Patterns indicator to see the price levels, at which the Smart Tape accelerated during the first trading hour. To do it, we limited the time range from 10:00 to 11:00 and selected relatively small trading volumes. See Picture 2.
The tape accelerates when the previous local high is broken, however, not due to new orders but due to stops. We make such a conclusion because the Open Interest falls rather than grows. Stops of amateurs are posted behind local highs and lows, that is why the volumes are not big here. The breakout was false (how to trade breakouts), but intraday traders could have used the trading situation and opened long positions in order to catch ‘stop activation’. A potential take for this trade is the next local high or another signal of the trading system of a trader.
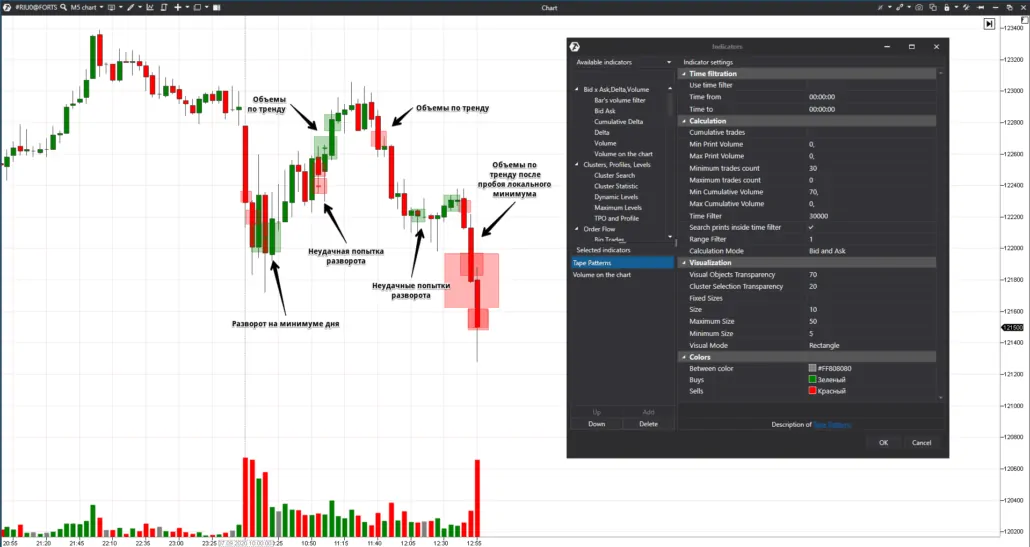
The third example is in the 5-minute RTS index futures (RIU0) chart. Note that there was a day-off in the American markets on September 7, that is why activity in the Russian market also was lower than usual. In this example, we set the indicator for filtering out small prints. See Picture 3.
Many signals appear with these settings. That is why a trader needs to understand the following to trade profitably:
- does the volume appear in the course of the trend development;
- or the volume ‘plans to reverse’ the price.
As a rule, the volume confirms the current trend on volatile bars and it is dangerous to trade against volatile bars. It is better not to open trades immediately after the appearance of the indicator signals on volatile bars but to wait for confirmation or market reaction.
Appearance of volumes in a flat or balance could warn about a reversal, in other words it is more efficient to trade against a trend. However, this trading style entails additional risks.
It makes sense to take into account that large volumes at the end of a trading session mean, as a rule, position closing by intraday traders. The OI Analyzer indicator could be additionally used in the Russian market in order to understand whether traders open new positions or close the old ones.
Conclusions
The Tape Patterns indicator will help you to work with the Smart Tape, but you will need to undertake some efforts to set it up correctly. This type of research should result in a bigger number of profitable trades.
Information in this article cannot be perceived as a call for investing or buying/selling of any asset on the exchange. All situations, discussed in the article, are provided with the purpose of getting acquainted with the functionality and advantages of the ATAS platform.


