
Stock and commodity markets sharply and rapidly fell in February-March 2020. Industrial enterprises in various countries had to stop and service enterprises haven’t worked in some places for several months after the panic caused by propagation of coronavirus. The bullish trend was replaced by the bearish one in less than a month. Such a sharp fall often starts with what is called the market correction. We will describe in this article what correction in the exchange market is.
Market correction - what is it?
There is no generally accepted definition of a correction. The majority of analysts believe that reduction by about 10% from the nearest price high is the market correction. 10% is not a strict number and the value could be a bit lower or higher.
In the event the price falls by more than 20%, analysts speak about the trend change.
Commodity markets, individual securities and complete industries and stock indices could be subject to correction. Correction in the stock market may last for days, weeks and even months. There is no average period for correction. Everything depends on the time-frame, on which you observe the chart.
According to Yardeni Research company, correction takes place in the American market a little bit more often than once a year. The S&P 500 stock index correction periods since 2008 until 2020 are marked with violet vertical strips in the below chart. Lilac strips mark the trend change periods when the market fell by more than 20%. Earlier data could be found in the company study. See Picture 1.
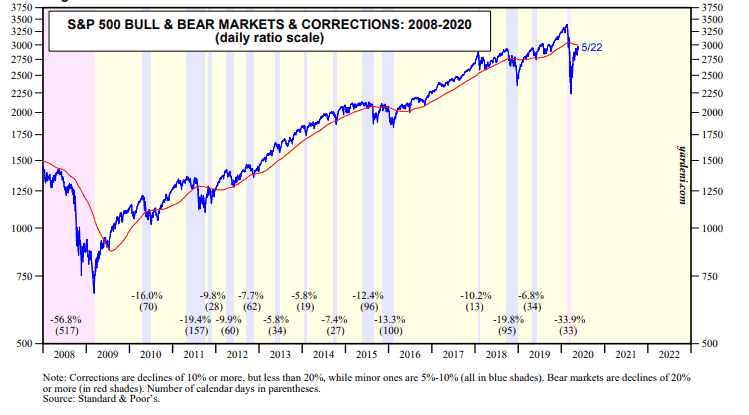
From the point of view of trader terminology, a correction could be only in the bullish market while a bounce takes place in the bearish market.
The market correction of 2020 technically wasn’t a correction, because the S&P 500 index fell by more than 33%. However, from the point of view of the recovery rate, the fall of stock indices in spring 2020 also cannot be called the bearish market.
Correction in the Russian Federation and United States stock markets
Correction of the Russian stock market differs from the situation in the American market because Russia is oriented at the export of natural resources and their prices fell to historic lows. Stocks of only 219 companies were traded on the Moscow Exchange in 2019. The RTS index fell by more than 50% from January to March 2020. The index returned back only a half of these losses during the period from March to May 2020. For comparison, the Nasdaq-100 index of high-technology companies practically recovered in May 2020 to the February highs.
It is impossible to predict when the stock market correction will end. It depends on political and economic factors. The current situation is aggravated due to coronavirus.
What leads to correction
As a rule, prices go down due to certain reasons:
- investor concerns. For example, investors are afraid that inflation will accelerate and the Central Bank will increase key rates – in this event, there could be a money outflow from the stock market;
- slowing down of the economic growth by macroeconomic indicators – for example, decrease of GDP or industrial production volumes;
- political events and military actions could also stimulate sell-outs. For example, the drone aircraft attack on the primary oil processing and oil refining plant in Saudi Arabia in the fall of 2019 resulted in a sharp oil price fall;
- algorithmic trading and speculative trading strategies. HFT trading has become very popular during the recent years. Some analysts believe that algorithmic strategies may result in a sharp market crash when robots start to sell or buy at low liquidity simultaneously;
overvalued financial assets. For example, when using the CAPE ratio (known as Shiller P/E ratio) it is possible to analyse how much stock indices are overvalued or undervalued. CAPE smoothes down cyclicity and takes into account inflation. Below is the chart of the S&P 500 stock index CAPE chart from 1881 until 2020. Several values were added to the chart every year – these quantities are specified on the lower horizontal axis. See Picture 3.
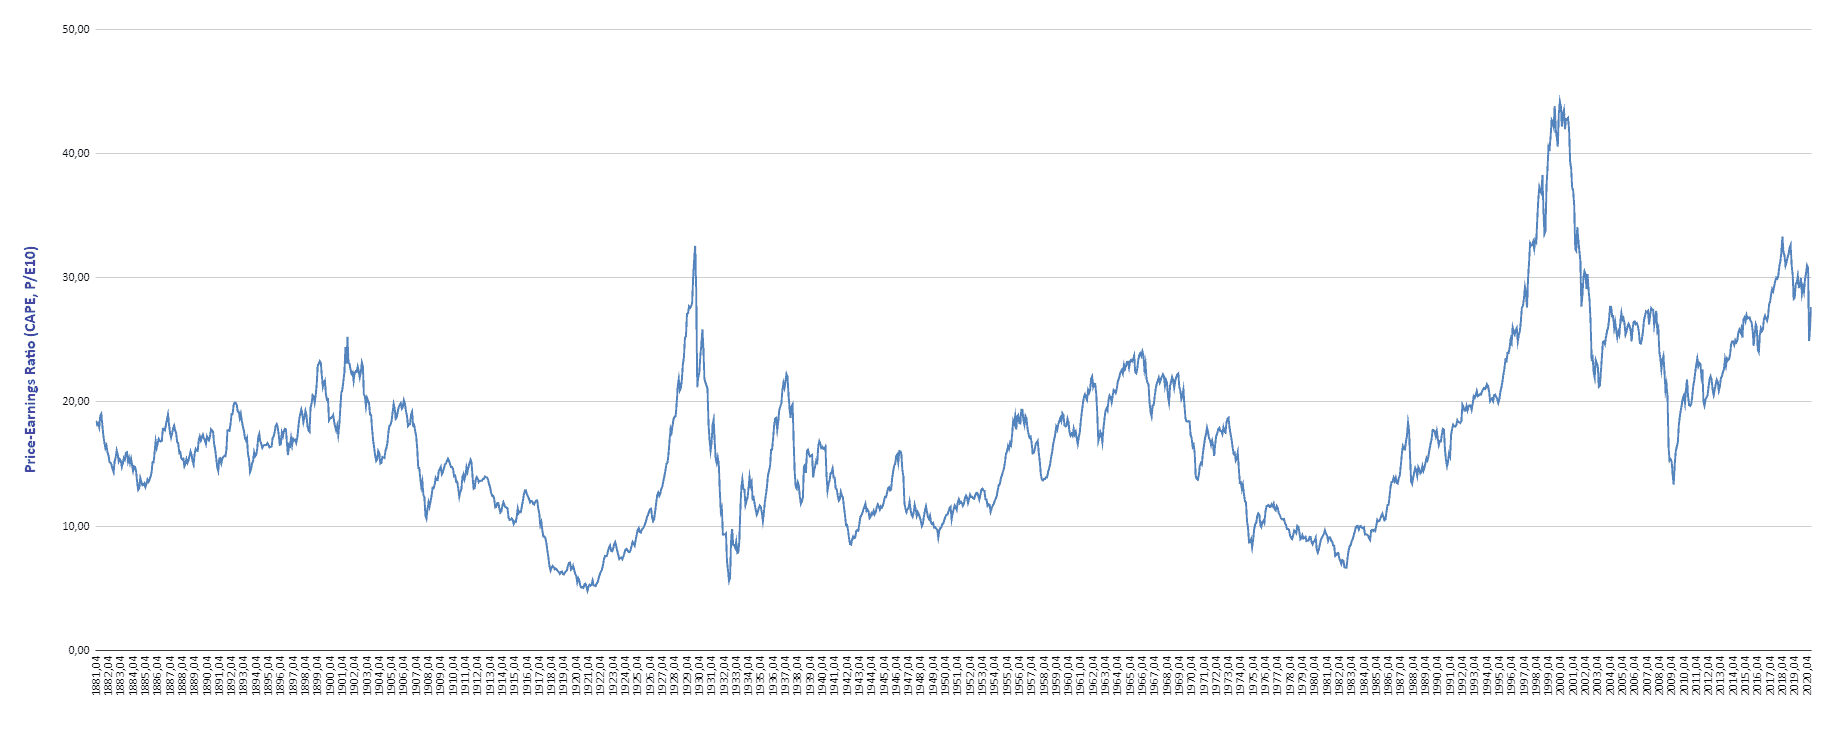
Overvaluation sooner or later leads to a correction, however, such a market correction is technical and, as a rule, doesn’t last long.
Types of corrections in the market
Seasonal correction takes place in the stock and commodity markets. It is connected with repetition of certain events and speculative price changes during them. For example, trading volumes traditionally reduce and trader activity falls in summer or on the eve of holidays. Sharp price fluctuations, connected with the liquidity decrease, are quite possible during such periods.Technical correction takes place due to a situational asset overvaluation or influence of important news. Technical correction doesn’t last as long as the regular one, but it takes place more often.
How to identify correction in the market
When prices reduce, traders and investors are interested in what level the market would make a correction to. There are no standard correction indicators, but it is possible to forecast the reduction size with the help of some technical analysis instruments:
- Fibonacci retracement levels. Many traders know that prices often slow down or reverse after passing certain distances – 23.6%, 38.2%, 50%, or 61.8%.
- Significant support/resistance levels, which can be seen on big time-frames also stop prices.
Lows of the Bollinger bands could be used as the trend correction indicator.
Examples of market correction
Let’s consider an example in the daily Microsoft stock chart.The stock was in the uptrend until February 2020. Small corrections occurred from time to time. We marked one of them with points 1 and 2.
Let’s measure the correction level with the help of the Fibonacci retracement levels and Bollinger bands. See Picture 4.
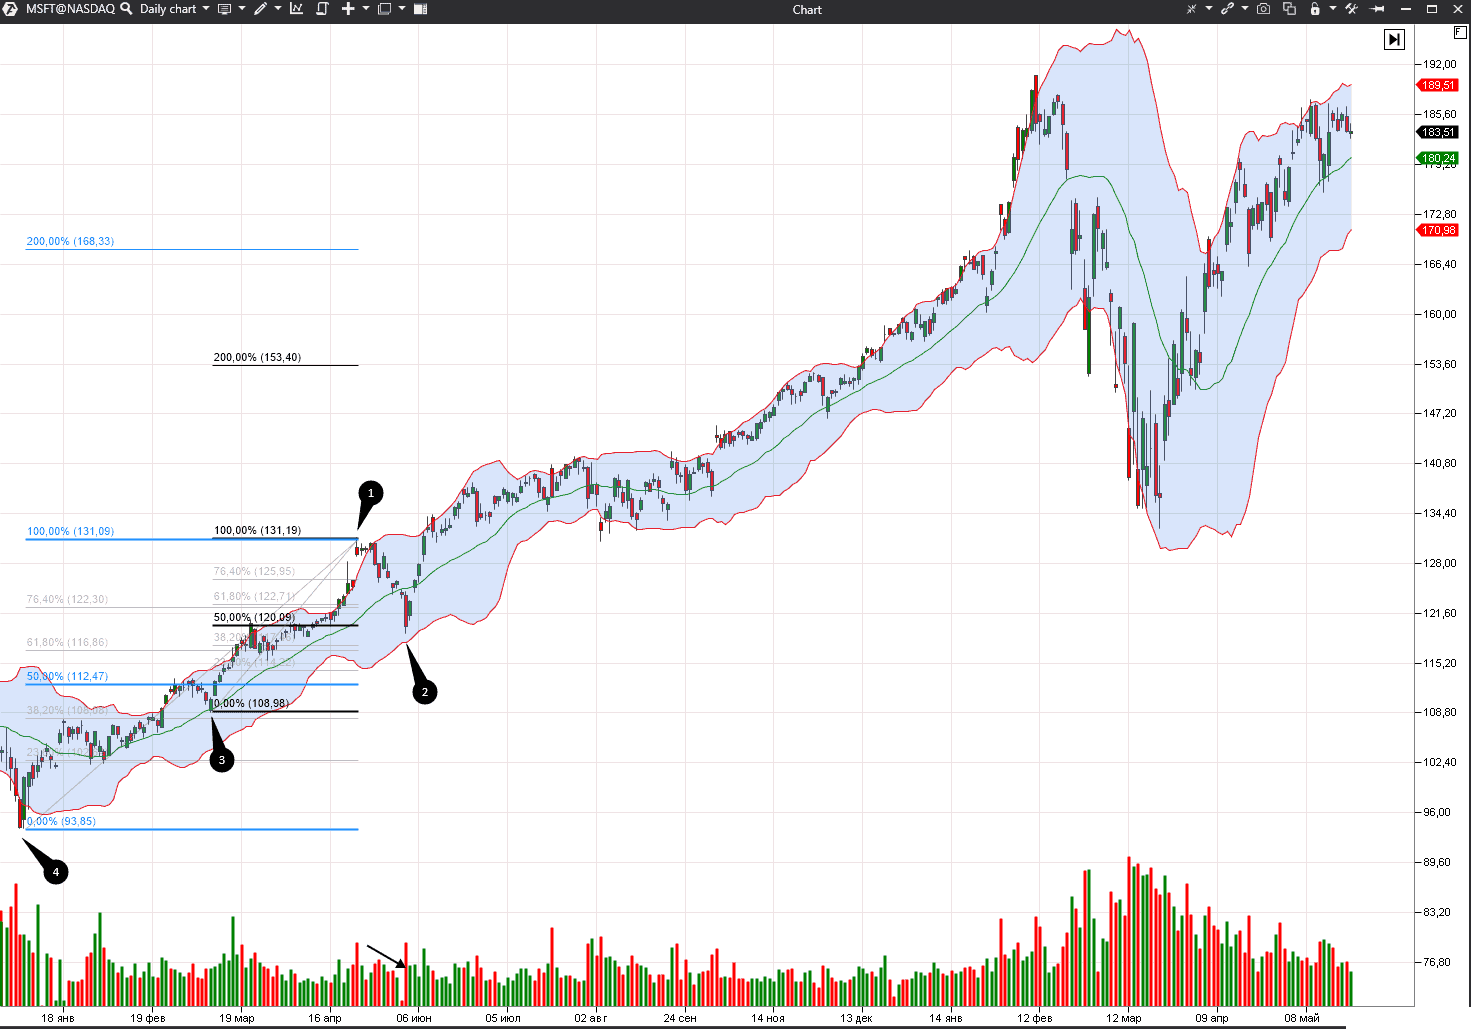
The correction low coincides with the 50% Fibonacci retracement level and practically reaches the lower boundary of 2% of the Bollinger bands. In the course of a correction, trade volumes and speed fall while volatility increases – this is what happened in our case.
Using chart analysis for identifying corrections
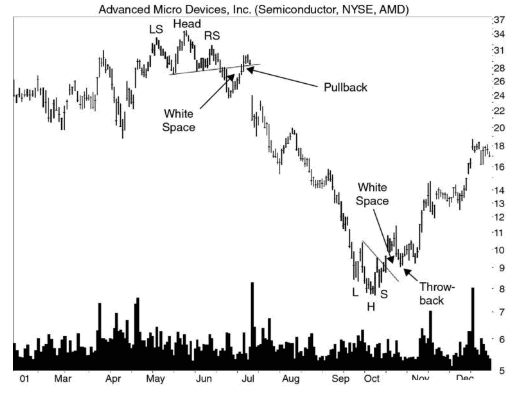
It is possible to use the levels of the chart analysis patterns (throwbacks and pullbacks are rollbacks during the bullish and bearish trends) for identifying corrections.For example, a correction to the ‘neck’ level may take place after the reversal ‘head and shoulders’ pattern, after which the price would continue to move in the breakout direction.
Example in the chart below is taken from a book of a chart pattern expert Thomas Bulkowski. See Picture 5.
Market correction and wave analysis
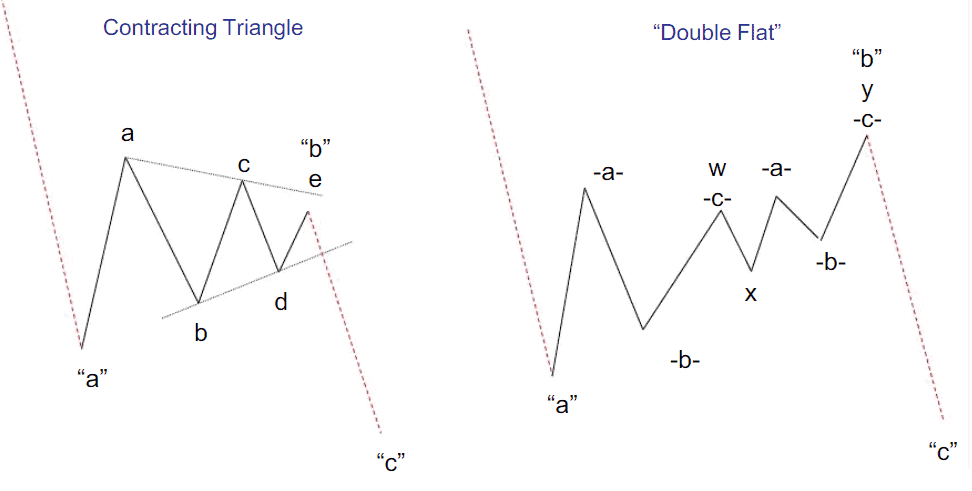
A market correction, from the wave analysis point of view, is a part of the wave structure. Correction waves, as a rule, alternate with impulse ones. The correction wave length should be less than the impulse wave length. A correction could consist of one or several waves.Two main patterns, which lead to a correction, are a ‘contracting triangle’ and ‘double flat’ from the point of view of wave analysis. The most efficient way of trading these patterns is a breakout. See Picture 6.
Pros and cons of correction
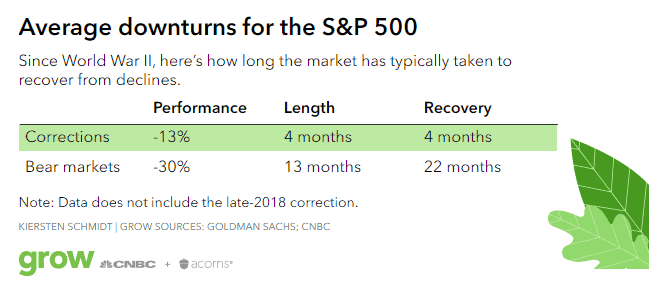
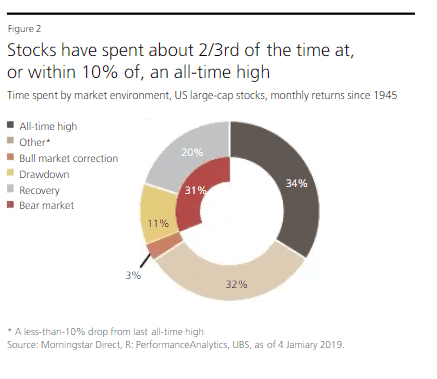
According to Morningstar Direct, the stock prices of the US big capitalization company stocks:- were at the high ⅔ of time during the period from 1945 until 2019 or within 10% from it;
- the bearish trend was observed during 31% of time;
- while the market correction only during 3% of time. See Picture 7.
| Advantages of market corrections | Disadvantages of market corrections |
| Decreases market overvaluation and the quote approaches the fair internal value of an asset. | Sometimes it is transformed into a trend change. |
| Investors may buy cheaper securities during a stock market correction. | It may cause panic among investors and provoke making wrong emotional decisions. |
| It leads to money losses of position traders and traders that use the credit leverage. |