
The exchange is located in the world-known historical buildings at 18 Broad Street and 11 Wall Street. These addresses became tourist attractions of New York and appeared in various movies many times.
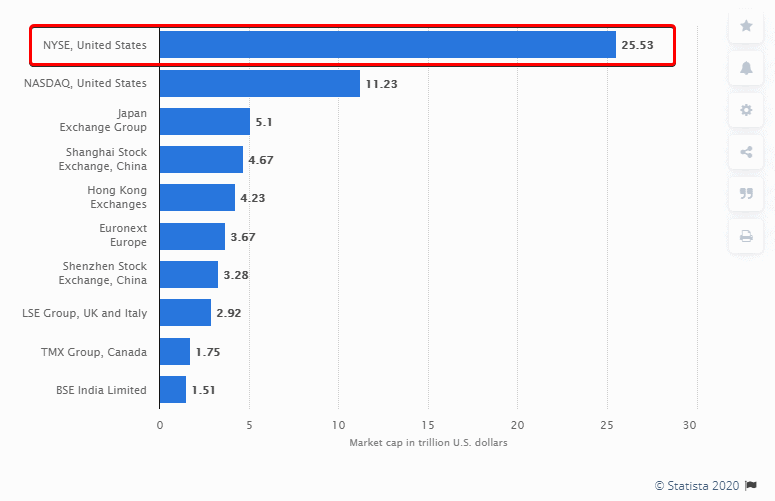
This exchange is considered to be the largest in the world since the market capitalization of all companies, which are quoted on the NYSE, is the largest one. According to Statista data as of April 2020 (and we want to remind you that it was the period of the stock market fall due to the coronavirus pandemic), the aggregate capitalization exceeded USD 25 trillion.
Frequently asked questions about the NYSE
When does the NYSE open? The working schedule of the New York Stock Exchange is from 9:30 until 16:00 (Eastern time) on working days of the week. The exchange doesn’t work on all official holidays. It also may not work on:- Friday if a holiday is on Saturday,
- Monday if a holiday is on Sunday.
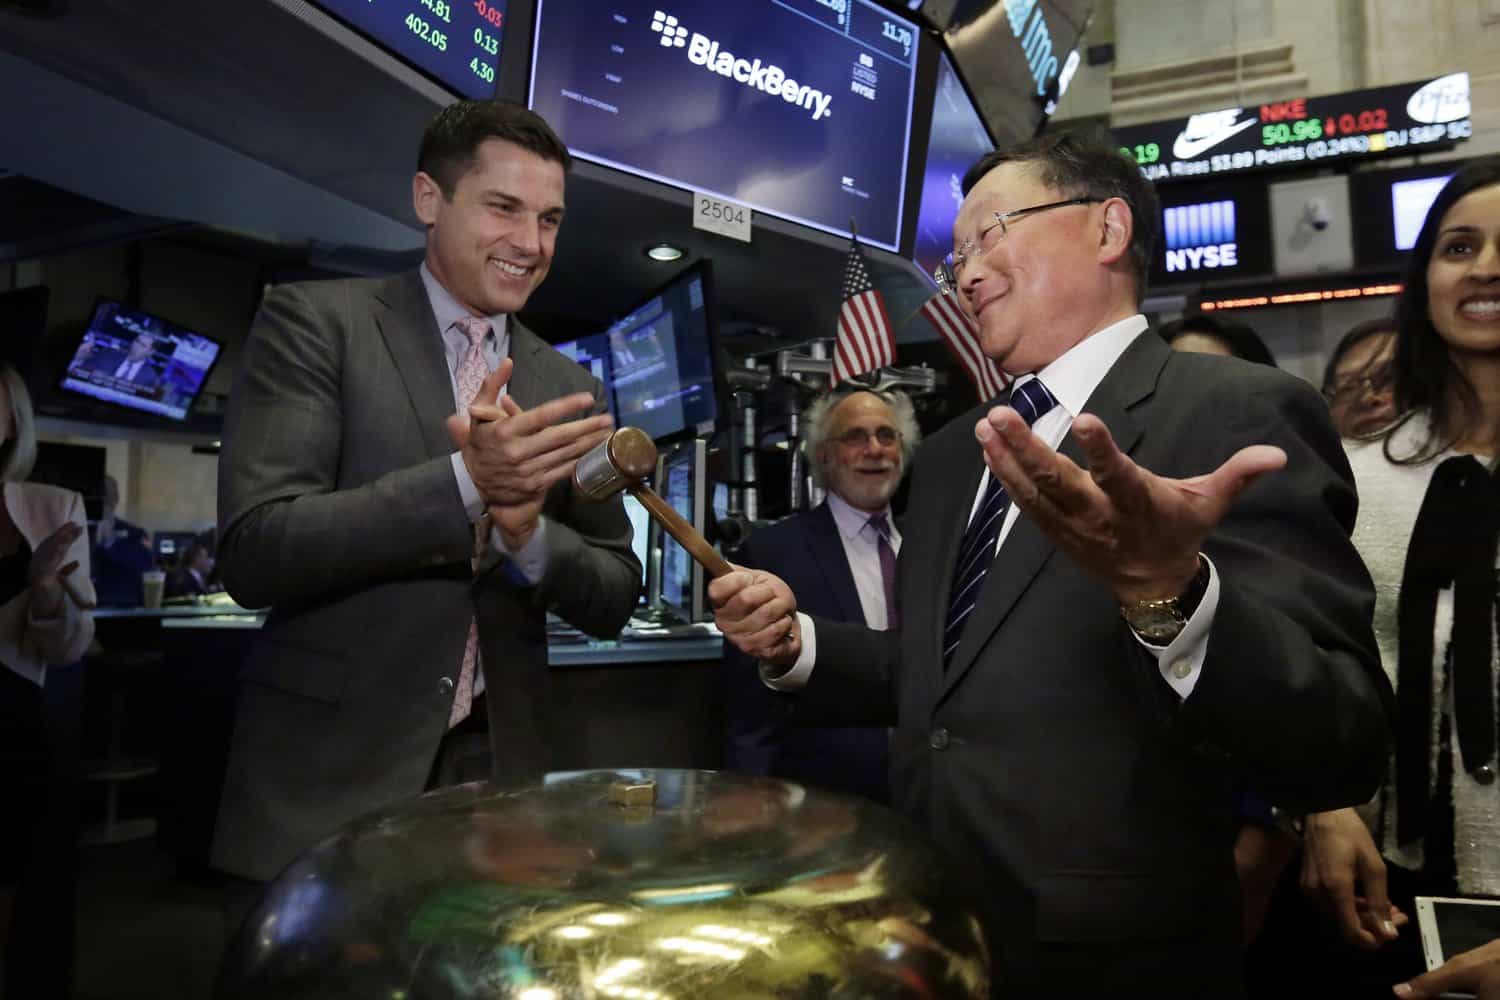
The bell ring, as the signal for opening trades, became the ‘stock-in-trade’ of the NYSE. Starting from the 1870s, the exchange invited managers of the quoted companies, public figures, celebrities and sportsmen to ring the bell.
What is IPO? Initial Public Offering is a primary distribution (offering) of securities on the exchange.
Not all the companies could offer their stocks on the NYSE. The exchange started to require, after the big fall of 1837, from the companies to disclose financial information about their activities. Standard requirements to issuers became more and more complicated and strict in the course of time. For example, as of today, a board of directors must include independent directors, who are not a part of a company.
What are stock indices? Several indices were developed on the basis of the traded (including NYSE-traded) stock prices. These indicators are for the stock market assessment and some of them have existed for many decades. For example:
- Dow Jones,
- S&P 500,
- NYSE Composite,
- NYSE US 100 Index.
Index values characterise the US economy state. They are closely monitored and their sharp movements often become the main world news. You can find more details about stock indices in this article.
What is the trading halt rule? The exchange introduced the trading halt rule after many cases of panic crashes. If the S&P 500 index decreases by 7%, 13% or 20%, trading halts for 15 minutes. If the index falls by more than 20%, trading halts until the end of the trading day. This rule was introduced for stabilization of the financial system and avoidance of extreme situations.
What do you need to know to start trading stocks on the NYSE? You need to execute a brokerage agreement with a broker, who is registered on the exchange (what brokers are). The terms and conditions improve year after year for private traders and investors, since high competition stimulates brokers to reduce commission fees and requirements to traders and investors.
History of the NYSE development
1792 – the exchange was founded by 24 dealers in stocks. Initially, only five securities were traded on the exchange – stocks of two banks and three types of state bonds.1886 – the trading volume reached 1 million stocks a day.
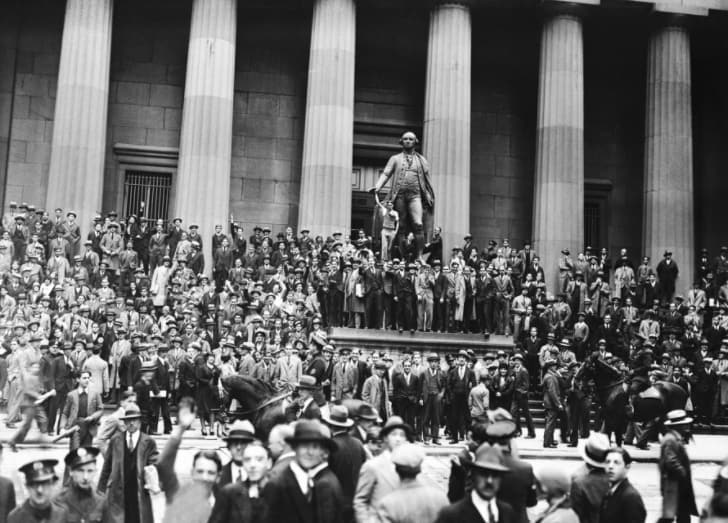
1929 – the biggest stock market crash in the history of the United States took place on the NYSE, which was followed by the Great Depression, which lasted for more than 10 years.
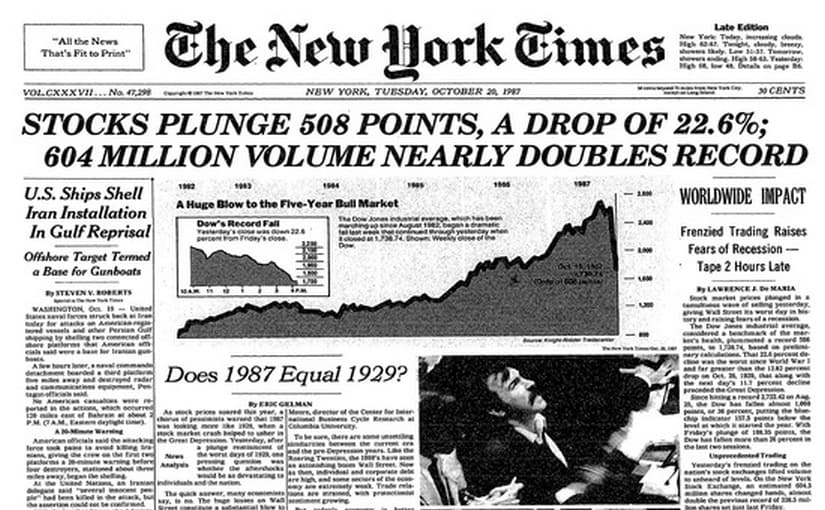
1987 – the stock market fell by 22.6% during one day.
2001 – trading was halted for four days due to the September 11 terrorist attacks. About USD 1.4 trillion of the exchange traded company value was lost during 5 days after the exchange opening. It was the biggest loss in history.

2007 – the NYSE united with the largest European exchange – Euronext. The new company was named NYSE Euronext.
2008 – the American Stock Exchange was purchased and renamed into NYSE Amex Equities.
2013 – the NYSE Euronext was purchased by Intercontinental Exchange (ICE) for USD 11 billion.
2020 – the NYSE switched to electronic operations due to the COVID-19 pandemic.
Using volume analysis for stock trading
The NYSE is a reliable regulated platform, which provides wide opportunities for making money on the stock price movements. Two approaches are applied for this:- Investing. Usually, investors buy stocks for a long period of time and make profit if the market grows.
- Trading. Traders try to make profit both on the falling and growing market. They work with short-term positions, receiving a smaller profit but more often.
Which approach is more efficient and better? It is better to try both directions and understand which trading style fits your personal qualities more harmonically.
It is important that volume analysis and the trading and analytical ATAS platform will be useful in various approaches to operations on the NYSE.
For example, one of the ATAS instruments, which will help you in the stock day trading, is the Speed of Tape indicator. This indicator allows seeing those chart areas, where the speed and number of trades on the tape increased or decreased.
This indicator will be useful when searching for prices, in which major market participants showed a special interest.
Let’s consider the 5-minute chart of trading the American Express stock (NYSE:AXP):
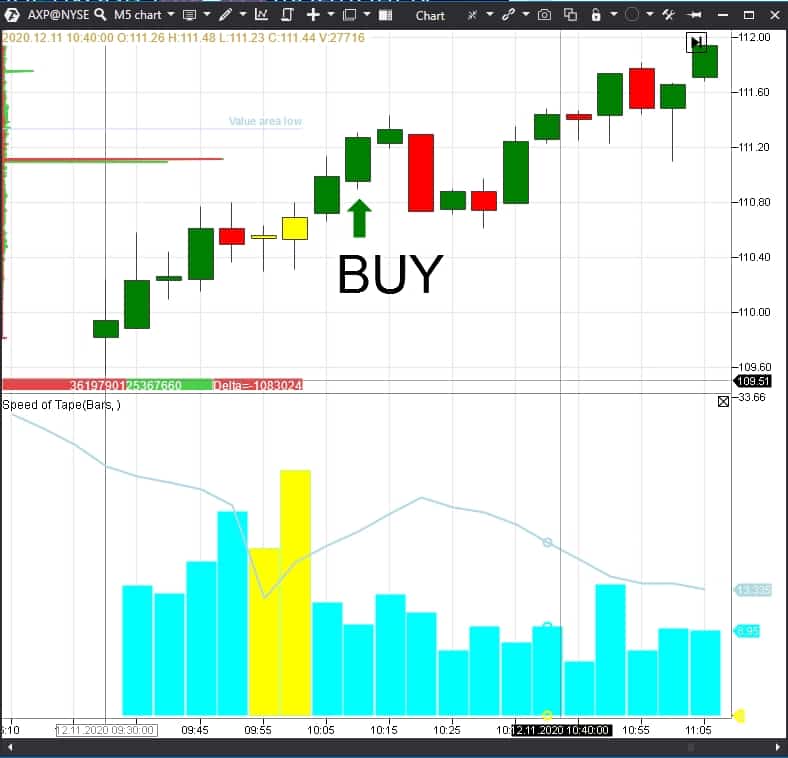
As a rule, trading accelerates when volumes increase. And the volume, ‘poured’ into the market, often represents a ‘fuel’ for new movement. The Speed of Tape indicator is good at showing these points in the chart.
So, here are the basic rules of using the Speed of Tape indicator in trading:
- To analyse minute time-frames (for example, M1 and M5), since accelerations take place dynamically and it is necessary to quickly react to them.
- To select optimum parameters for the Speed of Tape indicator, using the historic data, so that it would show the most significant places of the tape acceleration and traded volume increase.
- To wait for the price reaction to the volume, poured into the market, after the appearance of the Speed of Tape indicator signal candles.
- It is possible to open a trade towards the reaction after the appearance of a clear price reaction.
- It is better to limit losses after the candles, on which the volume pouring into the market was noticed, since, if this movement was organised by a major player, he will try to avoid the price movement against his position.
- Then it is possible to track the trade after the extreme points. It doesn’t make sense to expect strong movements, since this is intraday trading.
In the course of acquiring experience, you may monitor several stock charts at a time and have a sufficient number of trades every day.
Using volume analysis for investing in stocks
Investing is a process, which is affordable to a bigger number of people than trading. Since active trading takes much time, it is difficult to combine it with other types of activity.Classically, investing is based on fundamental analysis of company operation and selection of those stocks, which have the highest growth potential. Despite the fact that many books on this subject have been written, the process of search for stocks might seem complex at first sight.
Use volume analysis to simplify the process of investing in stocks.
Advantages of this analysis are in the fact that it focuses on formation of big volumes. It often testifies to activity of major insiders, who accumulate stocks on the basis of fundamental factors, about which a private investor might not know.
That is why, if you correctly interpret the volume, poured into the market, and further price reaction, you can successfully invest in stocks without a deep knowledge of the ‘fundamental’.
Example. Let’s consider such an indicator of the trading and analytical ATAS platform as TPO and Profile. One of the functions of this indicator is to show the volume profile and the maximum horizontal volume level for a certain period of time.
The accumulated volume and the price reaction to this volume accumulation could specify, with a certain degree of probability, a supposed direction of the further price movement.
Let’s see in the chart how the use of TPO and Profile could have been of benefit when investing into the Deutsche Bank stock in 2020 (the bank stock is traded on the NYSE with the DB ticker).
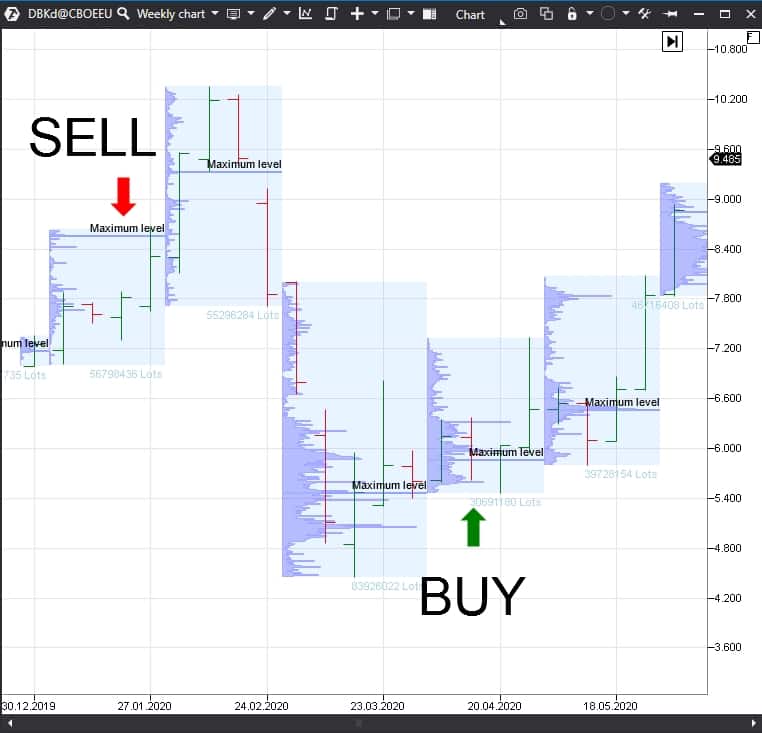
The chart shows the weekly time-frame and the TPO and Profile indicator shows the volume, which was accumulated during one month.
- February 2020. If you were buying the Deutsche Bank stock at the beginning of the year, you could have sold this stock at the beginning of February. This is because the maximum volume, accumulated during January, was at the closing price of the last week of January, in other words, there was no price reaction and the volume ‘didn’t push’ the price higher. As a result, you would have avoided the stock fall, which took place in March 2020.
- April 2020. You could have bought the stock at the beginning of April, since the March last week’s price was higher than the maximum accumulated volume and the investor had grounds to assume that the price would grow.
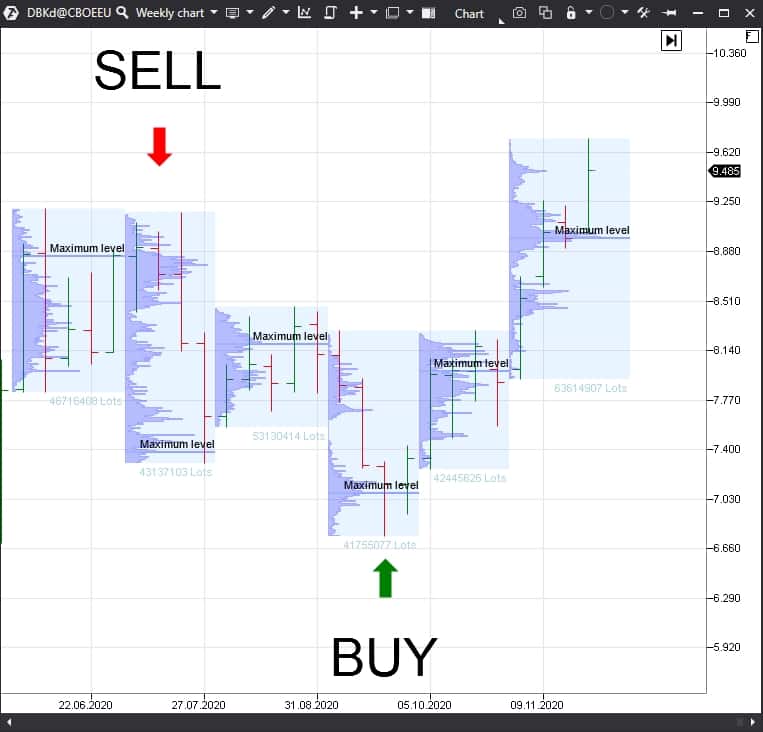
- July 2020. You could have sold the DB stock at the beginning of July, since the last June week was closed at the level of the maximum volume. In other words, the volume failed to ‘push the price out’ for its further growth.
- October 2020. You could have bought the stock at the beginning of October again, since the last week of September was closed above the maximum volume level.
So, here are the basic rules for the investment approach with the use of the TPO and Profile indicator:
- To select 10-50 stocks of the companies, which are strong from the fundamental point of view.
- To monitor, on the monthly basis, the levels of this stock volume accumulation and the price reaction to this volume.
- If the price reaction is upward, you may consider buying stocks.
- If the price reaction is downward (or at the maximum volume level), you may consider closing the buy trades.
- To conduct analysis once at the beginning of a month.
- It is better to distribute capital evenly between investments in stocks.
- It is better to build your portfolio using stocks of companies from various sectors.
- It is better not to use the leverage.
Such a simple approach allows to:
- spend 15 minutes a month for analysis and rebalancing the portfolio, composed of several stocks;
- avoid deep market retracements;
- make profit on all strong upward movements of the market.
Conclusions
- NYSE is the world largest stock exchange.
- If you want to benefit from the stock movement on the New York Stock Exchange, you should try various approaches – active trading and/or investing.
- Stocks could be a substantial part of a trader’s or investor’s portfolio, since wide diversification of trading instruments allows receiving more stable financial results and participating in strong trends in various world markets.
- The Speed of Tape indicator could be a good assistant for intraday trading, while the TPO and Profile indicator could be good for investment approach.
Information in this article cannot be perceived as a call for investing or buying/selling of any asset on the exchange. All situations, discussed in the article, are provided with the purpose of getting acquainted with the functionality and advantages of the ATAS platform.


