Four ideas for trading on breakouts
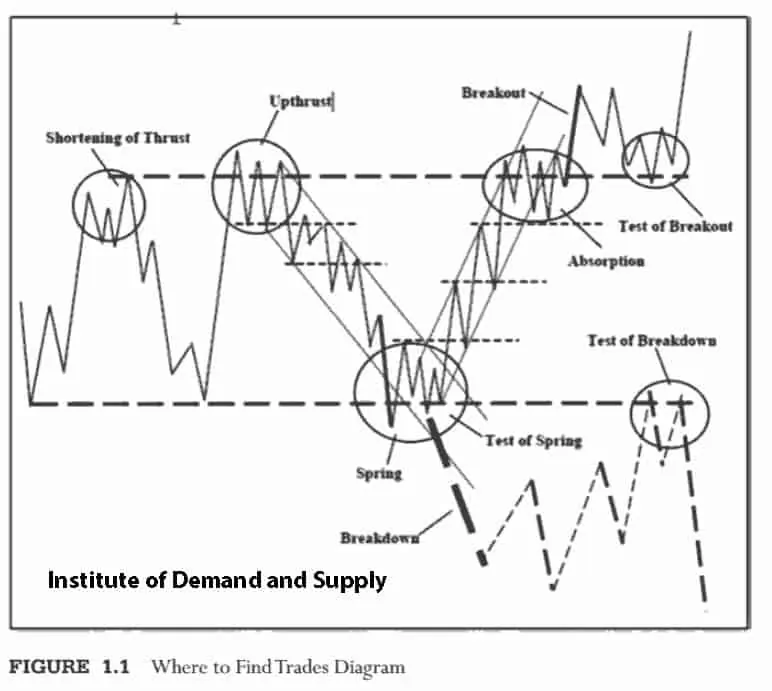
In his book ‘Trades About to Happen: A Modern Adaptation of the Wyckoff Method’ David H. Weis gives a simple but important figure. It is called Where to Find Trades. The Figure is accompanied by a comparison which you will easily understand if you are a fisherman.
Weis writes that the fish bites better at the edges of a lake and not in the middle of it. Consequently, the best trades are executed at the edges of a trading range and not in the middle of it. Here’s the Figure.
You can see in this Figure:
- Spring and Upthrust – false breakouts.
- Breakout and Breakdown – true breakouts.
Test – testing of true breakouts.
Having analyzed the Figure we may draw a conclusion that nearly the whole speculative trading is reduced to the work with breakouts. Since the best correlations of a potential profit and risk could be found at the edges of ranges.
When the price approaches the boundary (resistance or support level), a trader should focus attention and study the market in order to:
- make an assumption whether the boundary will be broken or not;
- act on the basis of the made assumption.
We will speak about false and true breakouts in this purely practical article. Read in this article:
- why breakouts take place;
- analysis of true breakouts;
- analysis of false breakouts;
- market behaviour before breakouts;
- how to trade – 4 ideas;
- chart examples.
However, let’s state important principles before we consider examples:
- In the majority of cases breakouts do not emerge ‘from nowhere’. It is believed that breakouts are consequences of actions of professional players.
- The general context of analysis of the ‘big picture’ is especially important when you trade breakouts.
- Quote: “The main goal of the market is to make as many fools as possible”. Bernard Baruch.
Why false and true breakouts take place?
If it were not for false breakouts, every trader would have made a profit. But the energy conservation law works not only in physics but also in the financial market. Wealth is impossible for all as well as the eternal engine is impossible. That is why false breakouts take place so that a buy of a new local high (and a sell of a new local low) wouldn’t guarantee a profit.
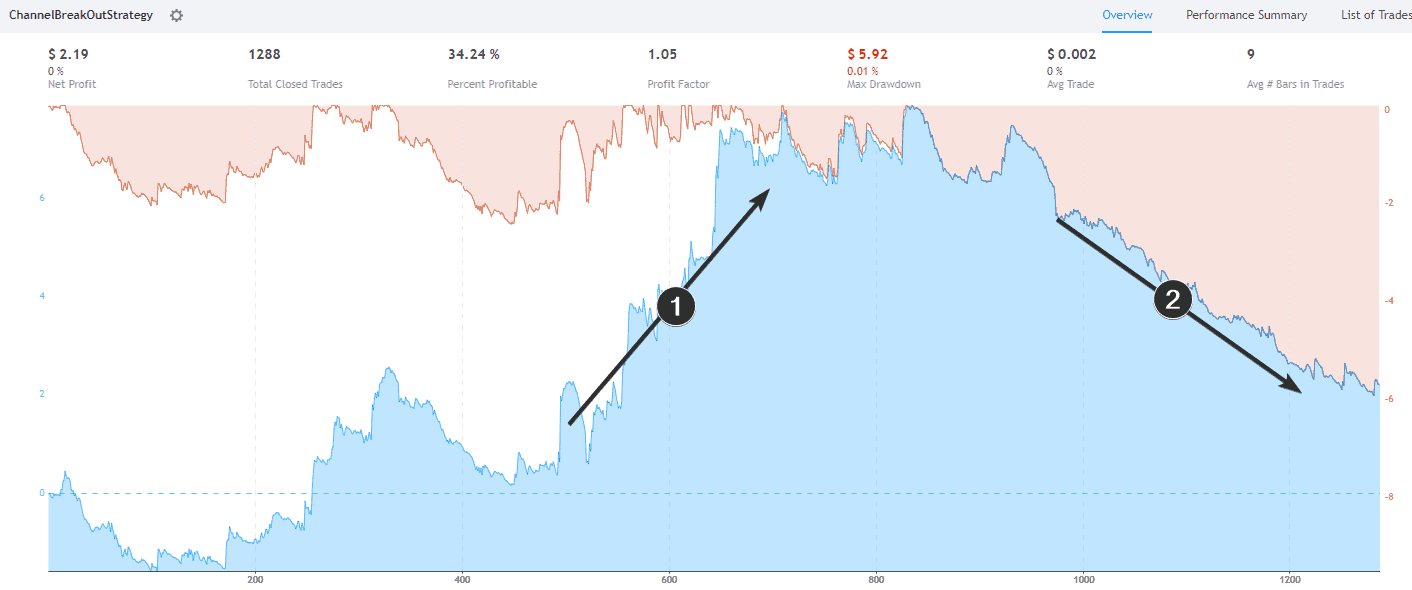
Let’s make a test. We take a regular strategy tester and launch a strategy of a channel breakout with default settings. You can see the result in the picture below.
As you can see:
- The results of the breakout trading strategy had improved after a satisfactory beginning.
- But then there was a fall. Perhaps, the market started to ‘draw’ too many false breakouts during that phase and the profit from previous trades practically ‘burnt out’.
You will have a similar picture if you test the false breakout trading strategy (reversals) using historical data. The profit growth periods will be accompanied by periods of losses. The invisible hand of the market does it in order to set the chances of traders at about 50:50 correlation.
The chances for success will be less than 50% in real life, since the above test doesn’t take into account slippages, commissions and other nuances.
The task for a breakout identification
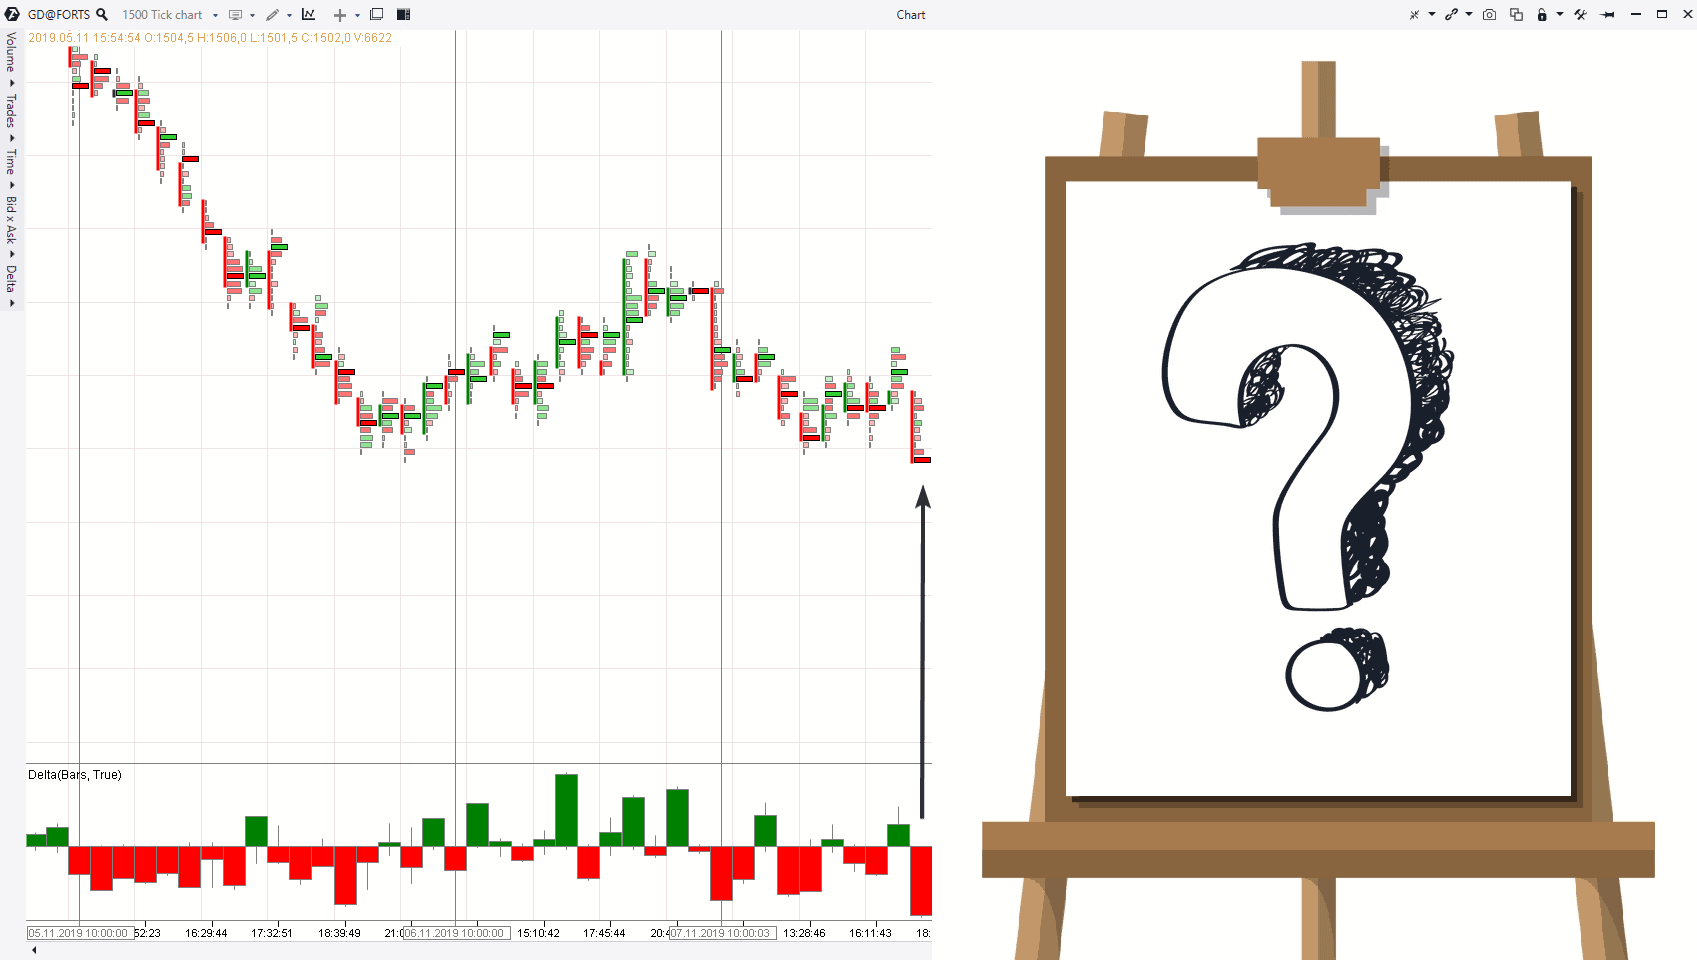
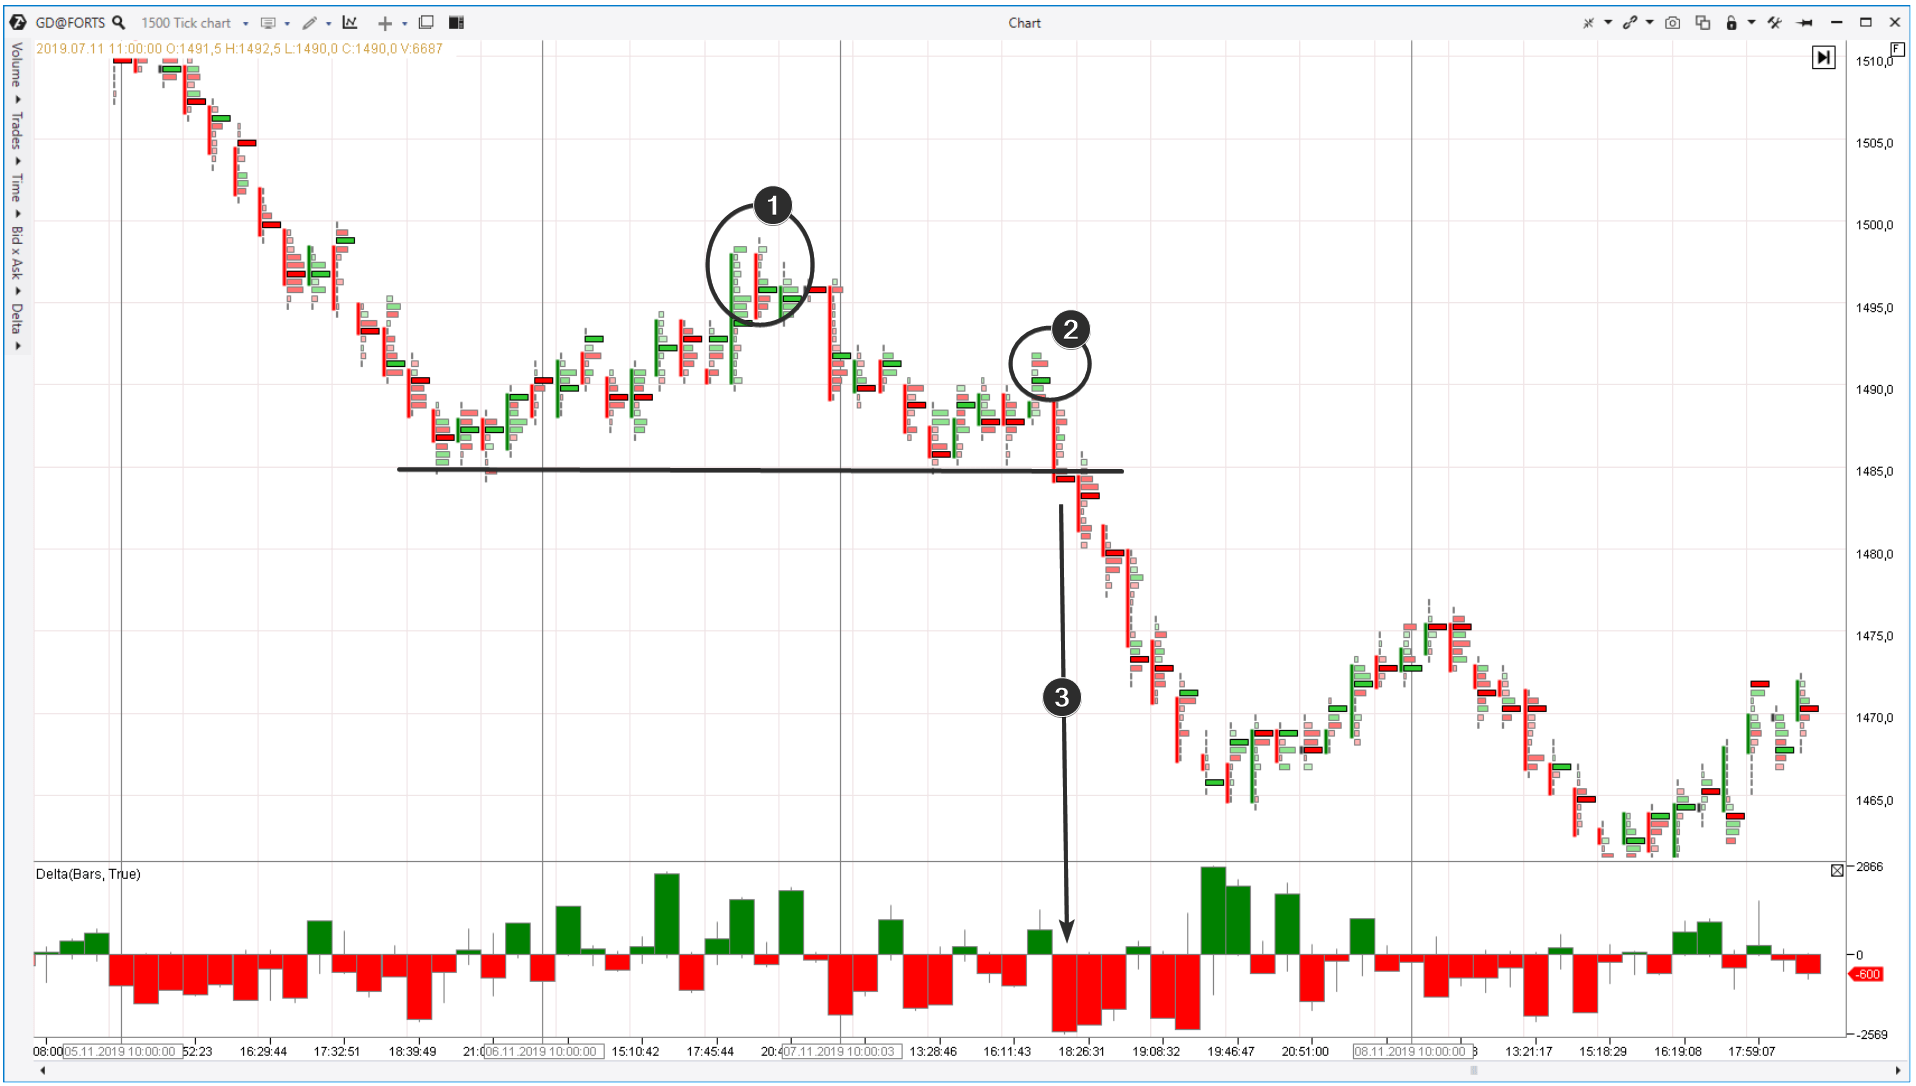
Let’s consider a standard task before we start analyzing breakouts in the cluster chart. Let’s have a look at the chart below.
Question. What do you think, is this bearish breakout true? Or it is a false breakout (a trap).
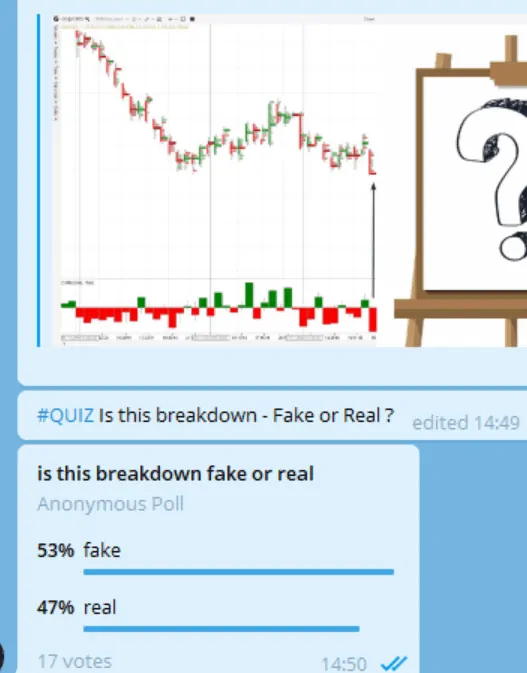
We asked this question in one of the groups where ATAS is actively used by beginner traders for the market analysis and trading (how to become a trader from scratch).
As you can see the opinions went practically halves. The right answer is at the end of the article.
How to forecast a breakout?
There is no magic. There is no indicator or any other proven method, which could predict the future development of things – whether there will be a true breakout of the support/resistance or it will be a trap (false breakout) – with 100% accuracy.
However, we have ideas based on our observations of the market. These ideas allow to increase chances for the right answer. Further on we present 4 ideas.
- Each idea is accompanied by an example.
- Each example is true for trading in both sides. If there is a bearish breakout in the chart, the idea is true for a bullish breakout in a mirror-reflected (upside-down) chart.
Idea 1. Analyze volumes
If the price goes down to the support level on decreasing volumes (the ‘No Supply’ situation), there is a high probability that there will be no breakout or it will be a false breakout.
Similarly, if the price increases up to the resistance level on decreasing volumes (the ‘No Demand’ situation), there is a high probability that there will be no breakout or it will be a false breakout.
You can read about ‘No Demand’ and ‘No Supply situations’ in this article.
Consequently, if the price decreases on the growing volume to the support level, it means determination of sellers (pressure of sells, red delta and the volume in the lower part of the candle). It is a precursor of a bearish breakout.
If the price increases on the growing volume to the resistance level, it means determination of buyers (pressure of demand, green delta and the volume in the upper part of the candle). It is a precursor of a bullish breakout.
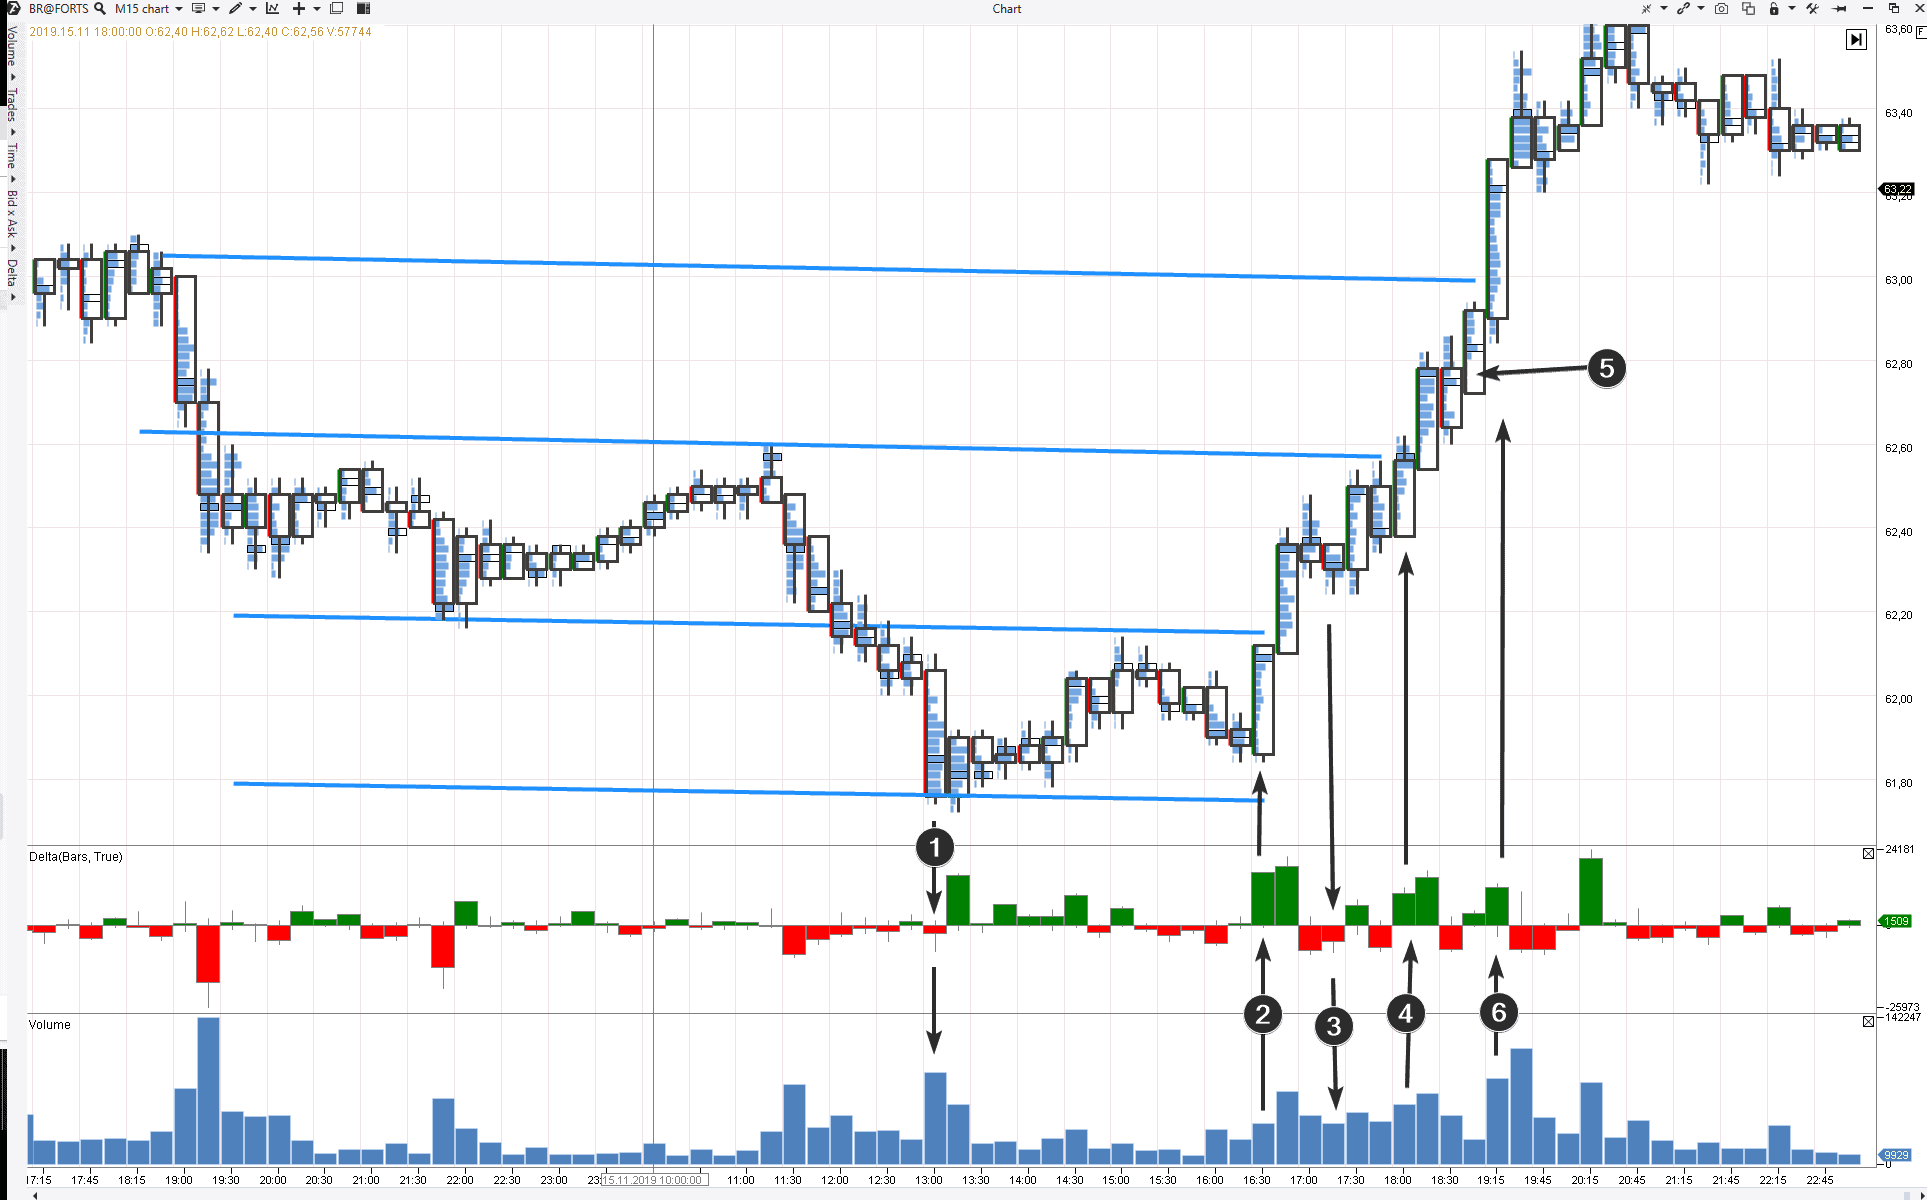
Example. A situation in the Brent oil futures market. The data is from the Moscow Exchange. We use the Volume and Delta indicators in a cluster chart with the period of 15 minutes.
- A splash of volume at the level of 61.80 (panic sells as origination of growth).
- Buyers’ pressure (green delta) on the level when approaching a breakout. The volume clusters are in the upper part of the candle.
- Absence of supply (deficit of sellers) can be seen from decreasing volumes in the downward attempt.
- The market response to the ‘No Supply’ signal. Buyers’ pressure (green delta) on the level when approaching a breakout.
- Absence of volume in the lower part of the candle could also be interpreted as a deficit of sellers. No one wants to sell contracts cheap when the price grows.
- Buyers’ pressure (green delta) on the level at a breakout of the level 63.
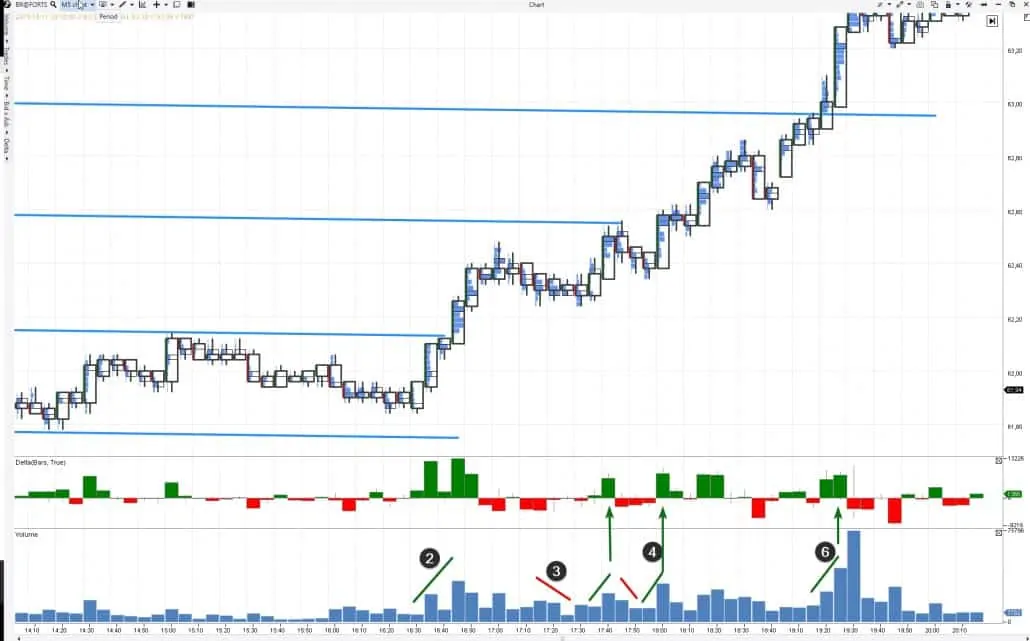
Let’s consider the same chart with the 5-minute period in order to better study interaction of the volume and price in a cluster chart during a breakout.
The numbers in the two charts are in correspondence. We want to point at a specific market behaviour under conditions of a series of bullish breakouts of the resistance levels. The idea is that if the volume dries out when approaching the resistance, the chances for a breakout decrease. However, if it grows, it means a buyers’ attempt to outbid all sells at the resistance line and push the price higher. Note the delta and general volume in points 2, 4 and 6. It is absorption of all sells by the buyers.
By the way, the breakout in point 4 took place only after the second attempt. The first attempt was between points 3 and 4. Then there was a rollback on the decreasing volume (a sign of the sellers’ weakness) and it added confidence and insistence to the buyers for a new attack which was a success.
Set the footprint with the delta in your market and check how the described principles are visualized on different periods including for bearish breakouts.
Idea 2. Analyze the profile
The longer the price moves within a range, the higher the breakout probability is. The recommendation is based on the Peter Steidlmayer’s theory. We wrote about this theory in the articles:
Theoretically, the market moves in two states – balance and disbalance. Ranges are the states of balance when the price is fit for both sellers and buyers (the price is close to the fair price). It is believed that when the price has moved in consolidation for quite a long period of time (it kept balance), it is ‘ready to go’ and find a new balance.
The profile forms may give a hint.
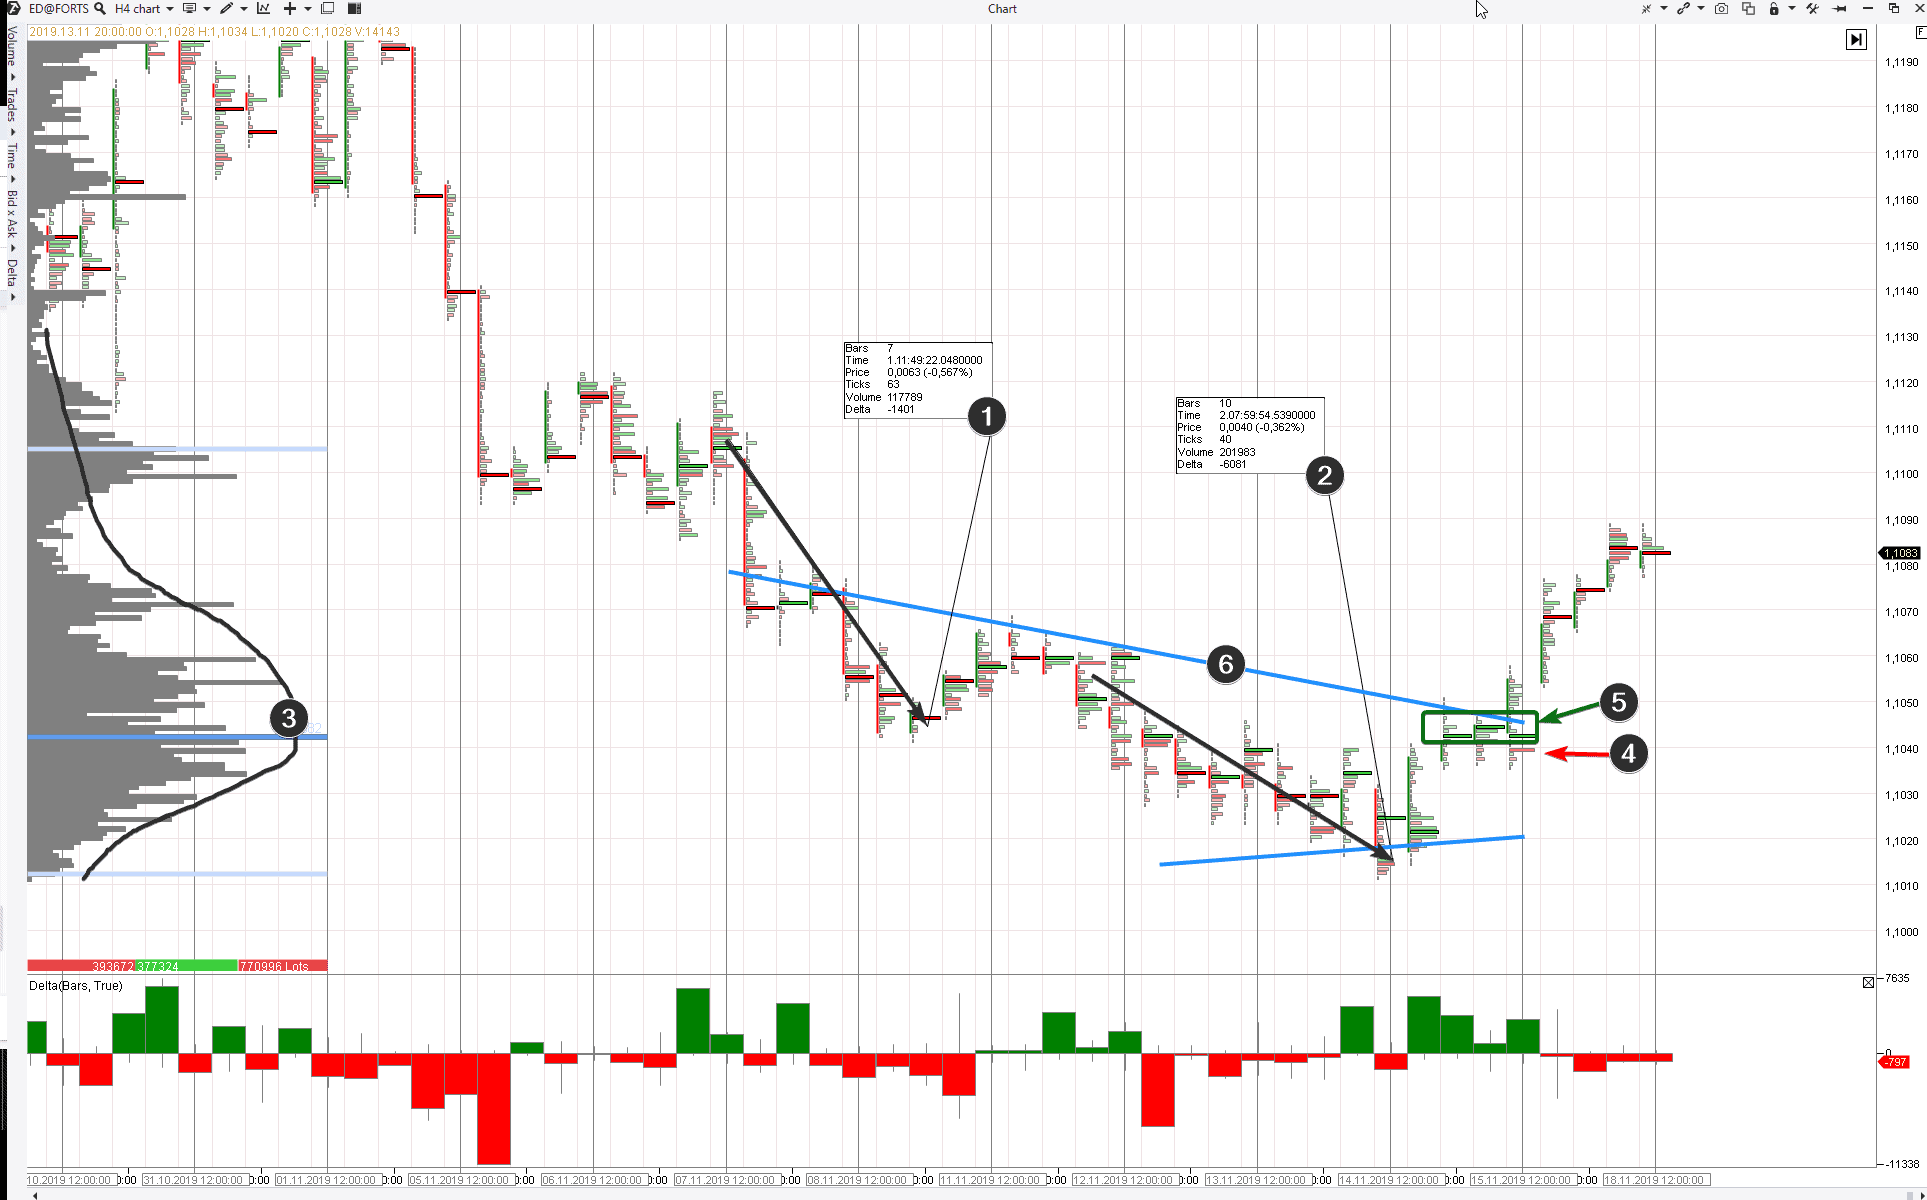
Here’s an example from the EUR/USD futures market. The data is from the Moscow Exchange.
- Wave 1 has a progress of 63 ticks and volume of 117k contracts (delta = -1.4k).
- Wave 2 has a progress of 40 ticks and volume of 201k contracts (delta = -6k).
- The general profile starts to form the ‘b’ shape since wave 2 has a small progress on a bigger than wave 1 volume. Read about Bag Holding, which is a sign of an incoming support.
- A small trap (will be described in the idea below) …
- … and a growing pressure of the buyers (it is seen from the green delta) promise a true breakout of resistance line 6.
Idea 2. Analyze the profile
Have you noticed a breakout in development? Concentrate to the maximum. As a rule, the trading process develops very fast during a breakout and a trader doesn’t have much time for contemplation. It is desirable to hold the whole context in your head and act without hesitation. There might not be another chance for a successful entering any more.
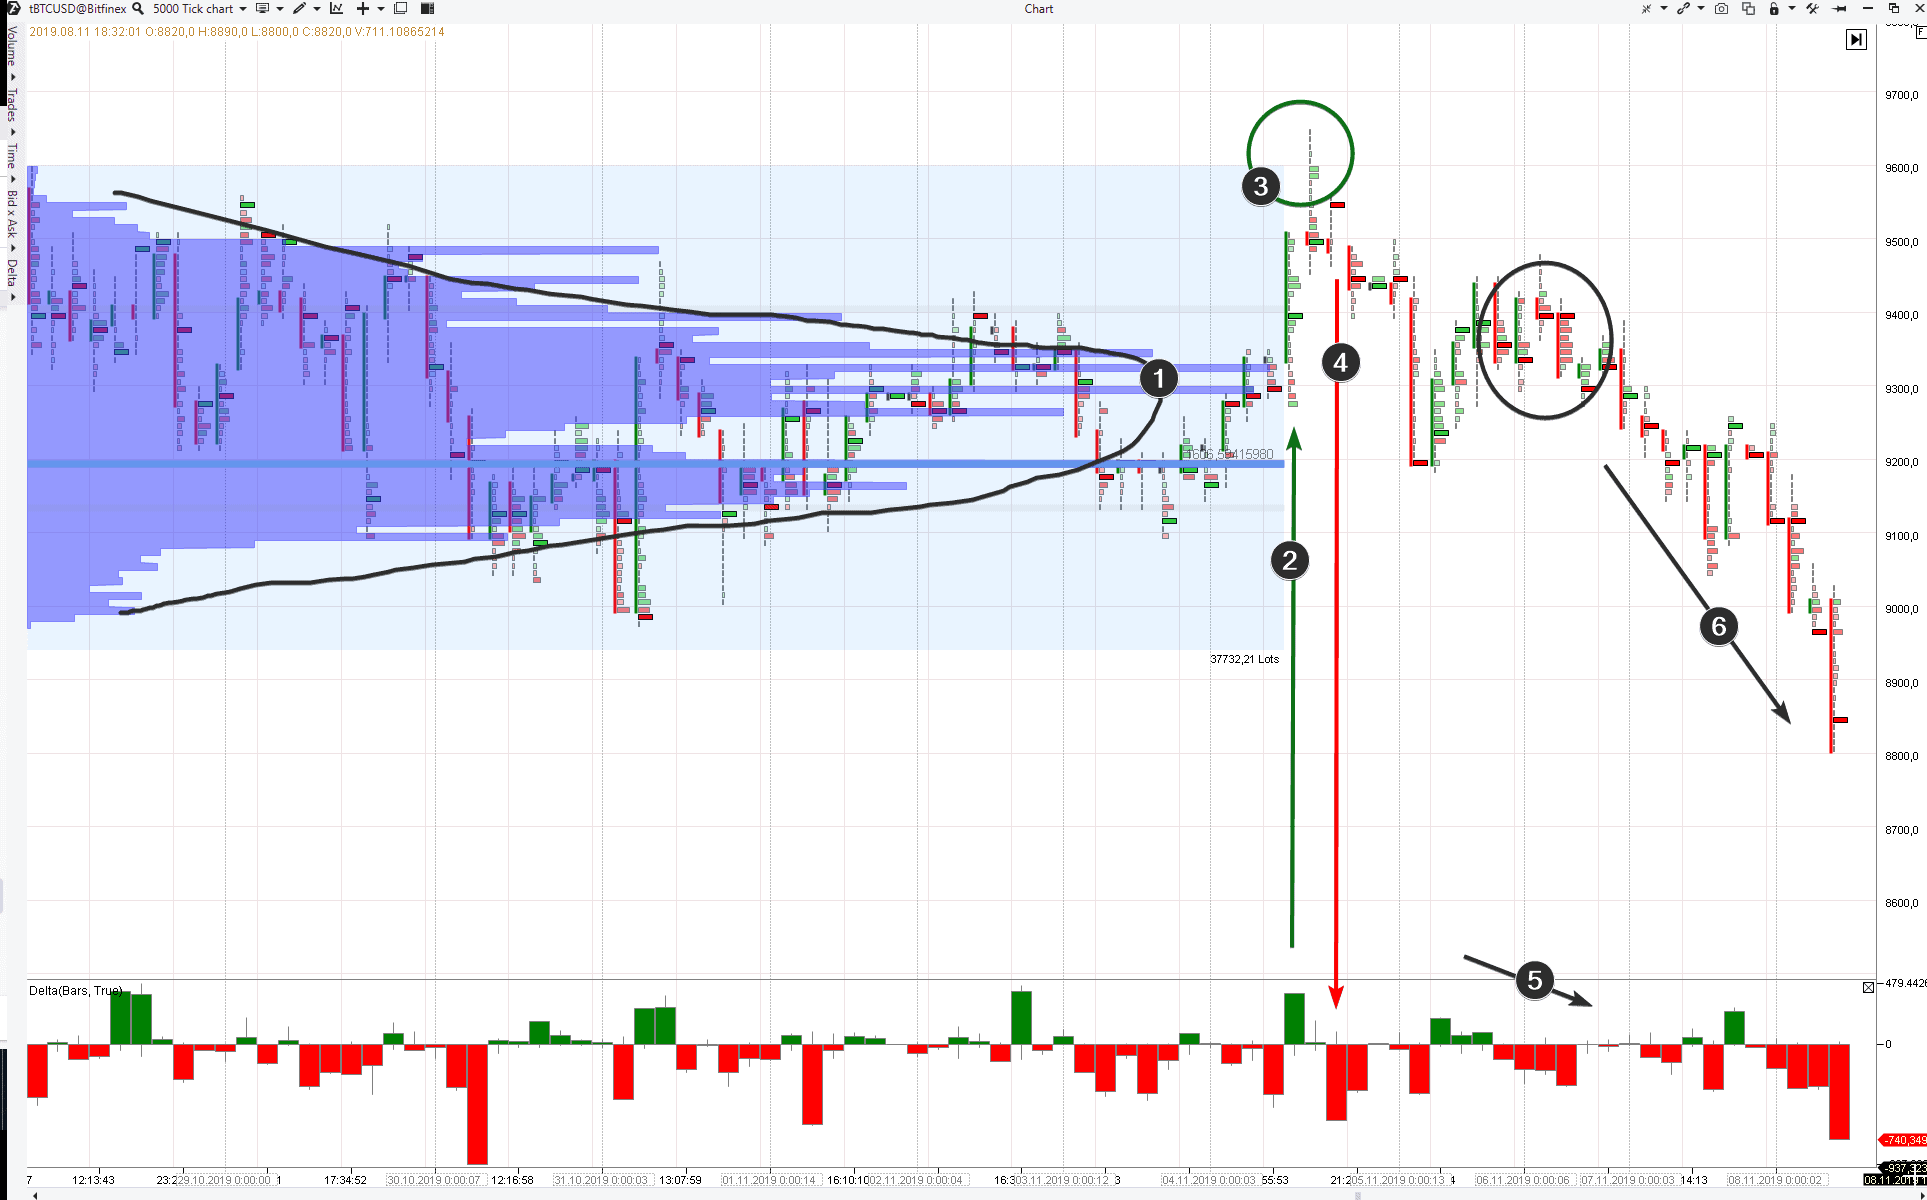
Example. A trap for buyers before a downward movement. The data are from the Bitfinex.
- The trading range was formed during several days. The profile formed a bell-shaped curve of normal distribution. Traders became bored waiting for a breakout.
- It seems like this is a breakout! The price grows upward fast outside the profile limits. Many bored traders entered into longs expecting to make a profit on cryptocurrencies.
- But pay attention to the ‘green splash’ by the delta at the level of 9,600. There is a closure on lows. Could it be a false bullish breakout?
- Entry of sellers (a powerful red cluster) confirms this assumption.
- One more confirmation.
- The situation with the balance area (1) worked out in such a way so that the false bullish breakout (3) resulted in the true bearish breakout (6).
Register:
- the change by the delta with a splash on clusters;
- the bounce from the round level;
- the general bearish context (not shown in the chart).
These are typical signs of a false breakout.
Idea 4. Assess traps before a breakout
As we already wrote, the main task of the market is to make as many fools as possible. This statement of a distinguished financial expert has a direct attitude to breakouts, since big and quick money could be made namely on the sharp price jumps.
That is why, even if you correctly identified an approaching bullish breakout and took a respective position, a small downward dodge before the growth (with the goal to hook the buyer stop losses) will not give you an opportunity to make money and, on the contrary, will bring you a loss, which is very frustrating.
Similarly, a small upthrust (a false growth) is met, in the majority of cases, just before a bearish breakout.
We showed in idea 3 an example of how a false bullish balance breakout resulted in a true bearish breakout. It was a large-scale trap. Such traps of smaller sizes take place much more often. They could be used as indicators of a direction of a true breakout.
And now we approach the answer to the question asked at the beginning of the article about whether the breakout is false or true. Find the correct answer below.
The breakout is true. And here are some facts which help to answer correctly. First of all, it is a bearish context (downward movement through the level of 1,500 in the background).
Then we have:
- A trap for buyers above the level of 1,495.
- A trap for buyers above the level of 1,490.
- A splash of sells at the moment of a breakout increases chances for a further downward movement.
We started this article with a fishing example and let’s end it with the same analogy. Small traps before breakouts is an analogy of the fishing rod movement by fishermen to hook the fish. A fisherman moves the fishing rod into one direction and the fish follows the bait. Then the fisherman sharply jerks the fishing rod in the opposite direction and the fish is hooked.
Summary
Breakouts take place every day in a big number and in any market. A trader can see false and true breakout patterns just after 5-10 ticks. That is why the breakout analysis should be practiced as thoroughly as possible.
We wrote earlier about:
- how to trade breakouts in the Strategy of using the footprint through the example of Dax article;
- channel breakout in the Technical analysis of channels and horizontal channels article;
- false breakout trading strategies in the TOP-5 simple volume trading strategies article.
The current article also adds some ‘food for thought’ with respect to the breakout analysis.
How to apply this in practice?
- Download ATAS.
- Analyze breakouts in your selected market / period.
- Find regularities and practice to track them in real time.
- Check your skills on the demo account.
You will get an excellent skill for making money in the financial markets after you learn to trade (false) breakouts correctly. Lucky fishing!

