


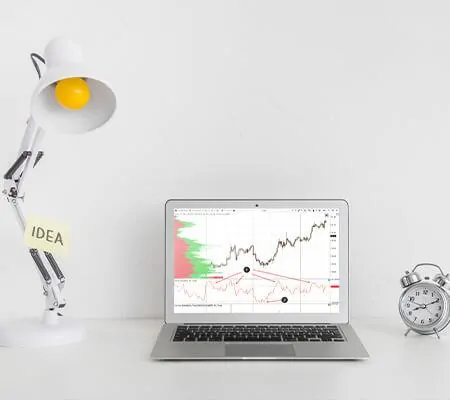
ATAS has 14 chart types – from standard time charts to tailor made range charts. We will speak about Reversal Charts in this article.

Traders used to apply only the fundamental and technical analysis in the 20th century. They didn’t see what took place inside the candles. The cluster analysis or Footprint emerged in the 2000s. In this article for beginners we will analyze: What Is Footprint and Cluster? Types of Footprint Footprint Patterns Buying and Selling Exhaustion Balanced […]
We will speak in this article about what Smart DOM is and how to improve your trading strategy with its help. Read in this article: What Smart DOM is; Smart DOM fields; How to set; How to use. What is seen better in the Smart DOM than in the chart; Spoofing in the Smart DOM; […]
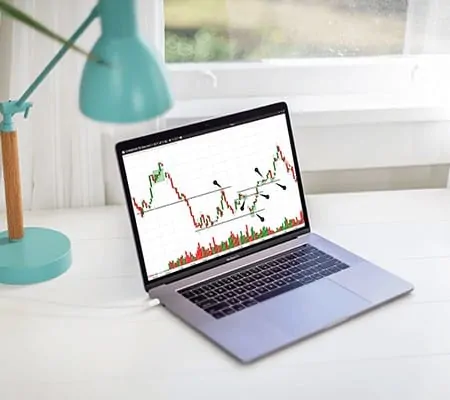

Read in this article: about the indicator developer; what the MACD indicator shows; MACD signals; description and application of the MACD indicator.

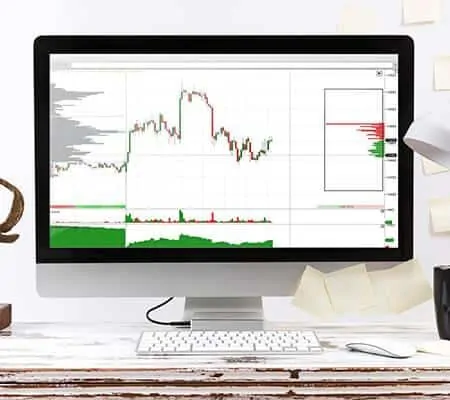
ATAS always tries to improve in order to provide the maximum of convenient and useful instruments for analysis and trading. An important and useful indicator – Market Profile – has been updated recently in the platform functionality. This article is a review of capabilities of the Market Profile in the form it has been available […]