Tag Archive for: Cluster charts
Support and resistance levels: how to distinguish genuine ones
/in Market Theory, Trading, Trading Basics, Volume AnalysisHow to learn how to read footprints from scratch
/in Basics of Volume AnalysisThis article is mostly for those traders who have just started to study trading by cluster charts. A beginner should develop own understanding of how to read footprint correctly. We speak here both about training of visual perception, that is, how to find necessary information in the chart, and about training of analytical skills in […]
How to Set Reversal Charts for Finding the Market Reversal?
/in ChartsATAS has 14 chart types – from standard time charts to tailor made range charts. We will speak about Reversal Charts in this article.
How Footprint Charts Work. Footprint Patterns
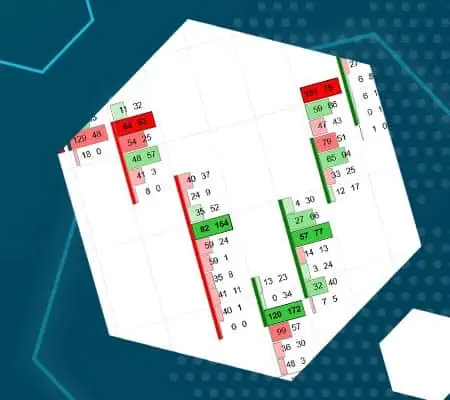
/in Cluster Charts (Footprint)Traders used to apply only the fundamental and technical analysis in the 20th century. They didn’t see what took place inside the candles. The cluster analysis or Footprint emerged in the 2000s. In this article for beginners we will analyze: What Is Footprint and Cluster? Types of Footprint Footprint Patterns Buying and Selling Exhaustion Balanced […]

