
How to find traces of smart money’ with Cluster Search Indicator

It is very important for traders to decide at what levels they will trade. One of the rational variants is to follow the managed money. In this article, we will look at big trades and the limit side of trades since, in most cases, they know where to buy and sell.
We will look for big limit orders with the help of the Cluster Search indicator. There will be a bonus in the form of a video.
Cluster Search is a very flexible indicator with a big number of settings, that is why any trader can find a proper variant for his trading strategy.
Cluster Search is not the only ATAS indicator, which finds big trades. There are many other useful indicators which we speak about in our blog and on our YouTube channel.
Intraday Scheme
The first variant, which we will consider, is better suited for intraday traders since it works on minute time-frames and requires fast reaction and constant chart monitoring. We will use two or four Cluster Search indicators for detecting levels, at which there was a severe fight between buyers and sellers.
Quite often, absorption of market orders by limit ones takes place at the end of focused movement and, consequently, the price reverses. Namely such levels can be detected by the Cluster Search indicator. If a trader wants to separate the European and American sessions, it is necessary to use 4 indicators: two for each session – one for buys and the other one for sells.
You can separate trading sessions with the help of the ‘time filter’ set-up. See Picture 1.

How to set up the indicator
Several words about the indicator settings in this template.
The first Cluster Search looks for clusters with the Delta predominance of +150 on three joined price levels and marks these clusters red. It means for traders that there were much more market buys than market sells but limit sell orders prevented the price from sharp increase.
The second Cluster Search looks for clusters with the Delta predominance of -150 on three joined price levels and marks these clusters green. It means for traders that there were much more market sell orders than market buys but limit buy orders prevented the price from a sharp decrease.
The next chart shows the found cluster in green colour. It is an enlarged version of the upper chart and the first green bar to the right. See Picture 2.

After clusters appear in the chart, traders mark the level and wait for the price reaction. The price could either break this level or bounce from it – depending on this a short or long trade could be opened.
However, you should remember that settings will be different for different instruments. Our template works for the Euro futures (6E). Due to different liquidity of every individual instrument, clusters could not be displayed or, on the contrary, there will be too many of them. In other words, you should adjust indicator settings manually.
Parameter values could be set by trial and error:
- If there are many levels in the chart, the Delta filter value should be increased.
- If in the approximately two-week chart an accumulation of clusters appeared at extreme points or reversals, it means that the Delta filter value was set correctly.
- If the price doesn’t test levels or constantly breaks and ignores them, it means that the Delta filter value should be changed.
- If volatility grows, it means that indicator settings should also be adjusted.
The HRange indicator could be added to the chart as an additional filter. This is a custom-made indicator, which builds levels as soon as two bars are formed one after another outside the local extreme point. See Picture 3.

For example, a red cluster appeared and a range was formed on the local high in the minute Euro futures (6EH1) chart. The price tests this range extreme point twice in points 1 and 2 and starts to move down after that.
Conclusions
The Cluster Search indicator allows various types of traders to improve their trading strategies and view the market situation at their own angles. Any trader can find his own unique combination of settings for increasing the number of profitable trades.
Information in this article cannot be perceived as a call for investing or buying/selling of any asset on the exchange. All situations, discussed in the article, are provided with the purpose of getting acquainted with the functionality and advantages of the ATAS platform.
 https://atas.net/wp-content/uploads/2025/04/Session-Volume-Profile.png400450Slava Vdkhttps://atas.net/wp-content/uploads/2021/11/ATAS.pngSlava Vdk2025-06-12 13:03:002025-06-12 13:09:00Session Volume Profile: How to Set It Up and Use It in Trading
 https://atas.net/wp-content/uploads/2023/11/Types-of-ATAS-Indicators-Their-Functions-and-Configuration-2.png400450Anna Posthttps://atas.net/wp-content/uploads/2021/11/ATAS.pngAnna Post2023-11-10 19:38:462024-09-05 15:50:36ATAS Indicators: Types, Purpose and Configuration
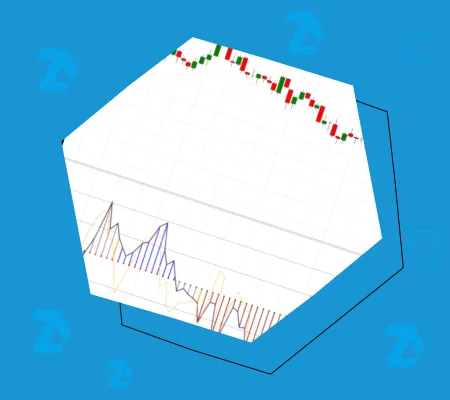 https://atas.net/wp-content/uploads/2023/11/CCI-Indacator.png400450631m40wopa_e268wva6srmwhttps://atas.net/wp-content/uploads/2021/11/ATAS.png631m40wopa_e268wva6srmw2023-11-10 19:24:422023-11-10 19:27:18Is it possible to combine the cluster analysis with the CCI indicator?
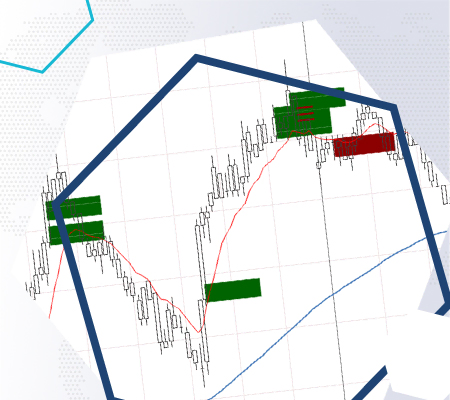 https://atas.net/wp-content/uploads/2022/02/Adding-combining-indicators-in-the-ATAS-platform1.jpg400450София Процьhttps://atas.net/wp-content/uploads/2021/11/ATAS.pngСофия Проць2022-02-10 12:50:402022-08-25 18:43:53Adding indicators in the ATAS platform
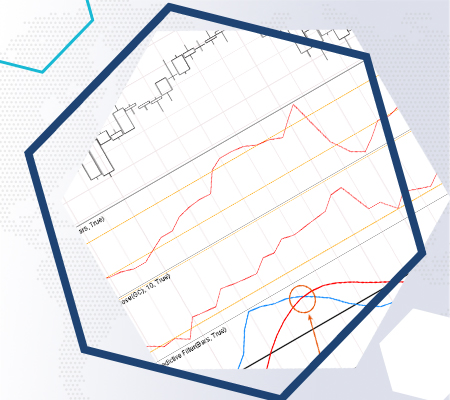 https://atas.net/wp-content/uploads/2022/01/Voss-Predictive-Filter-is-it-possible-to-improve-the-signal-quality-with-the-help-of-technical-analysis-1.jpg400450Влад Чубатюкhttps://atas.net/wp-content/uploads/2021/11/ATAS.pngВлад Чубатюк2022-01-05 12:43:142024-07-31 12:45:58How to improve signals quality with Voss Predictive Filter
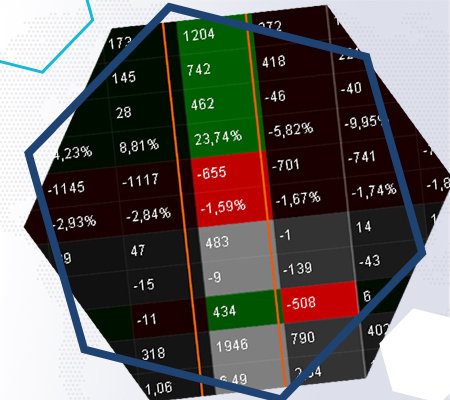 https://atas.net/wp-content/uploads/2021/10/How-to-use-filters-in-the-Delta-indicator1.jpg400450София Процьhttps://atas.net/wp-content/uploads/2021/11/ATAS.pngСофия Проць2021-10-25 14:26:052022-08-05 17:14:47How to use filters in the Delta indicator
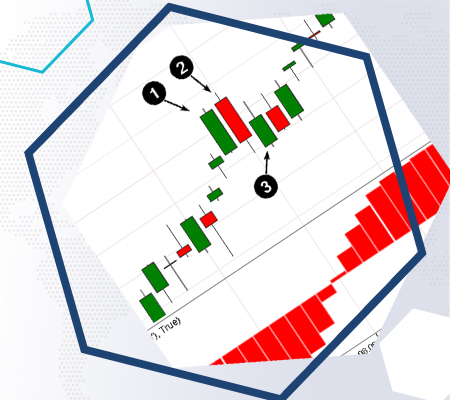 https://atas.net/wp-content/uploads/2021/10/The-Coppock-Curve-indicator-1.jpg400450София Процьhttps://atas.net/wp-content/uploads/2021/11/ATAS.pngСофия Проць2021-10-15 13:25:162024-10-11 20:15:55How to apply the Coppock Curve in trading
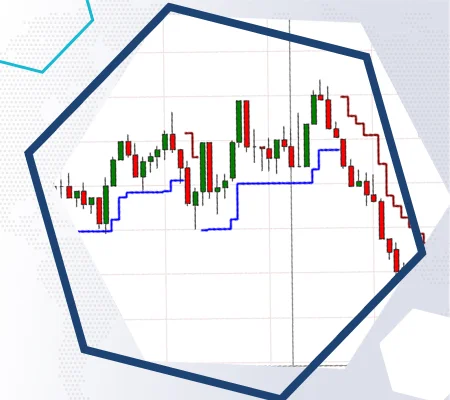 https://atas.net/wp-content/uploads/2021/10/How-to-test-your-trading-system-automatically-2.jpg400450София Процьhttps://atas.net/wp-content/uploads/2021/11/ATAS.pngСофия Проць2021-10-07 12:02:012022-08-18 15:49:58How to test trading system automatically with Super Trend
 https://atas.net/wp-content/uploads/2021/07/How-to-trade-profitably-with-the-help-of-the-Squeeze-Momentum-indicator.-Settings-and-chart-examples56.jpg400450София Процьhttps://atas.net/wp-content/uploads/2021/11/ATAS.pngСофия Проць2021-07-19 19:02:452024-10-17 19:16:30How to trade profitably with the Squeeze Momentum indicator
