Who pushes the price and why? Chart examples.
In this article, we will gain insight on real reasons for the price movement on the exchange.
A beginner trader runs into multiple market methods and theories. Sometimes, they contradict each other. What should he believe in:
- Behavioural factors?
- Fundamentals?
- Technical analysis?
- Volume analysis?
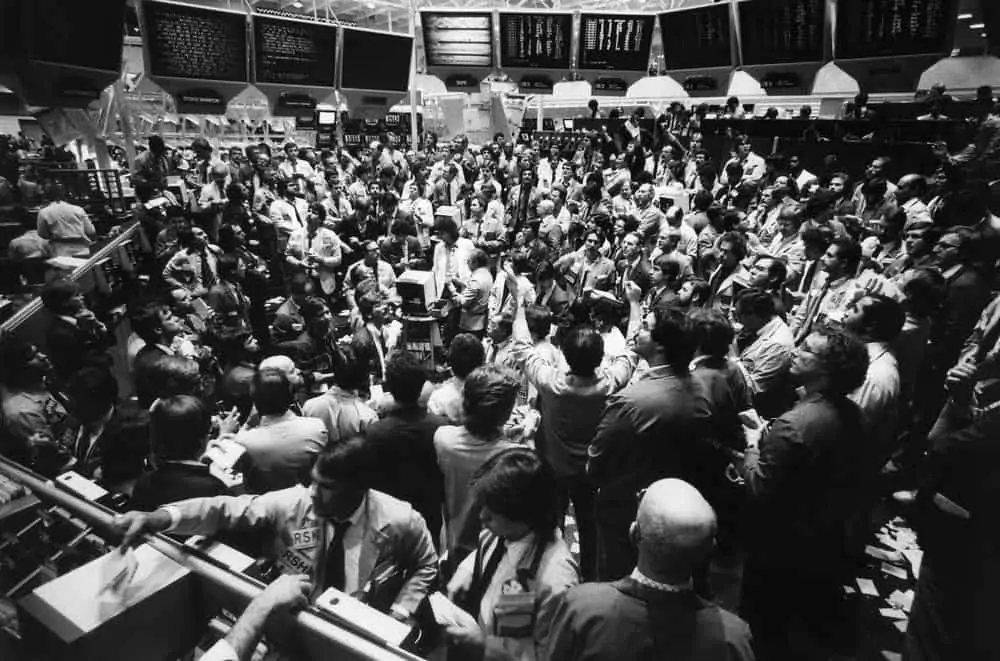
Some time ago, exchange trading looked as in the picture below. Traders shouted prices in the pit, at which they wanted to buy or sell assets. The ‘crowd factor’ worked well in those times. For example, if major players bought stocks en masse, minor participants had a possibility ‘to join them’.
Nowadays, traders sit in the offices or at home. Robots, which are not emotion-dependent, become more numerous in the market. Perhaps, behavioural factors have changed. Can we trust them?
What about technical indicators? They were invented in the previous century, when computers were as powerful as modern calculators. The majority of these indicators are used to this day:
Perhaps, classical technical indicators worked well years ago, but they have a high error range in the modern markets. This makes their application practically useless.
Fundamental analysis continues to work in the securities market, but provides relatively less benefit in the currency sections and financial derivative market.
What to rest on?
In this publication we will:
- try to understand, what or who determines the market movement direction in reality;
- learn how to find reversal points;
- give specific recommendations, where it makes sense to open a trade immediately and when it is better to wait for a retracement/bounce.
Who pushes the market and why
Buyers and sellers are responsible for the price movement in the market.
The market moves up if buyers work with market orders, which means that they post their orders at the prices of the sellers’ orders.
If the buyer posts his order below the fair or current price, this order falls into a line together with other buyers’ orders and will not influence the price.
The situation is similar with the seller, who can:
- get in line with other sellers;
- show initiative and sell at the price of a buyer’s order.
The seller will move the price down in the latter case (assuming that he may satisfy the whole demand).
Why do buyers or sellers exhibit activity? An infinite number of factors influence it.
Example 1. One company publishes a good income statement. The company stock becomes attractive for investing and we observe a practically inevitable price growth.
Example 2. Major stockholders learn that a claim is filed with the court against the company by its competitor. Certainly, they would want to register the profit after selling the stock. It will result in the value decrease on the wave of sells.
So, the situation is relatively clear with an answer to the question ‘why do buyers/sellers exhibit initiative and push the price up/down?’. However, there are many nuances with the question ‘when does the initiative expire?’.
For example, while observing the market, we do not know who exactly initiates buys or sells. It could be:
- a crowd of retail traders, who buy on positive news;
- a market maker, who hedges his risk position;
- a major hedge fund, which forms its portfolio in stocks.
You may often notice (watching the chart, volumes and initiative development) how a wave of buys, which pushes the market up, is sharply changed to a wave of sells and the price loses all its accumulated positions.
At such moments, you may feel a strong wish to buy. This wish appears, as a rule, at the last moment, when, in fact, it already doesn’t make sense to buy.
Let’s compare a buy of a financial asset with a purchase of a regular commodity, for example, a pack of tea. It is obvious that it is profitable to buy tea when it is sold cheaper at a discount. On the other hand, we know many situations when a food price growth urges buyers to empty the supermarket shelves. The buyers are afraid that the prices will grow further.
Something similar happens with a trader who is in a hurry to buy an asset, which goes up in price, hoping to catch up with the departing train.
How does volume analysis allow to avoid traps?
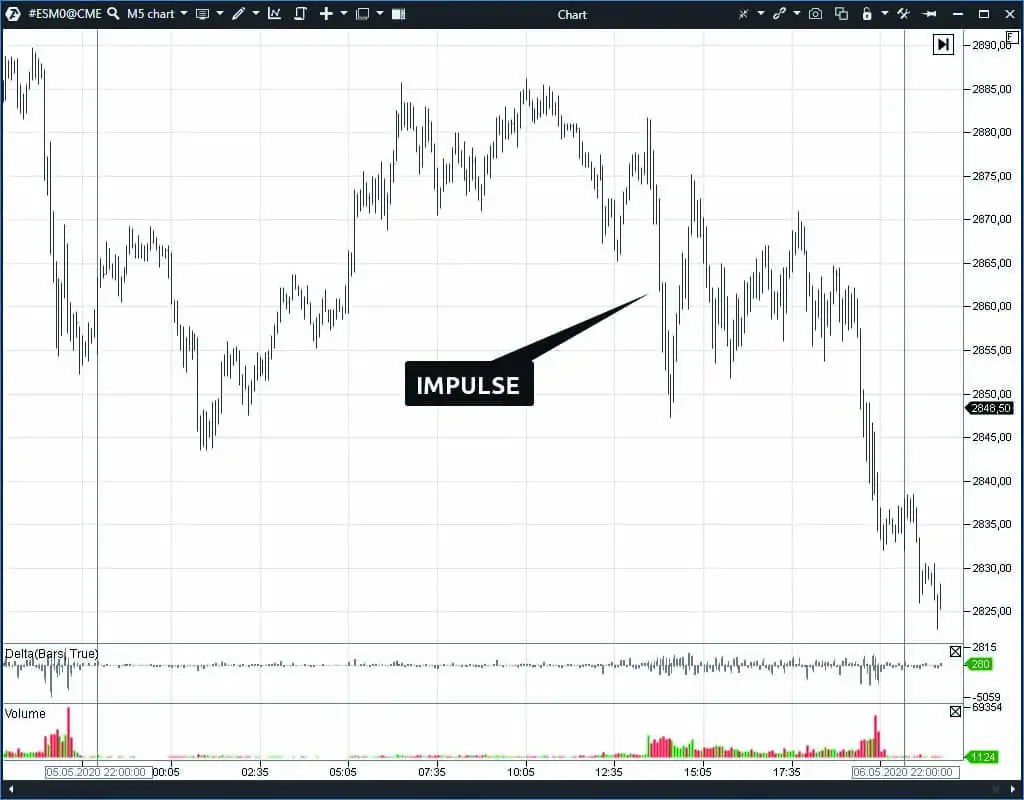
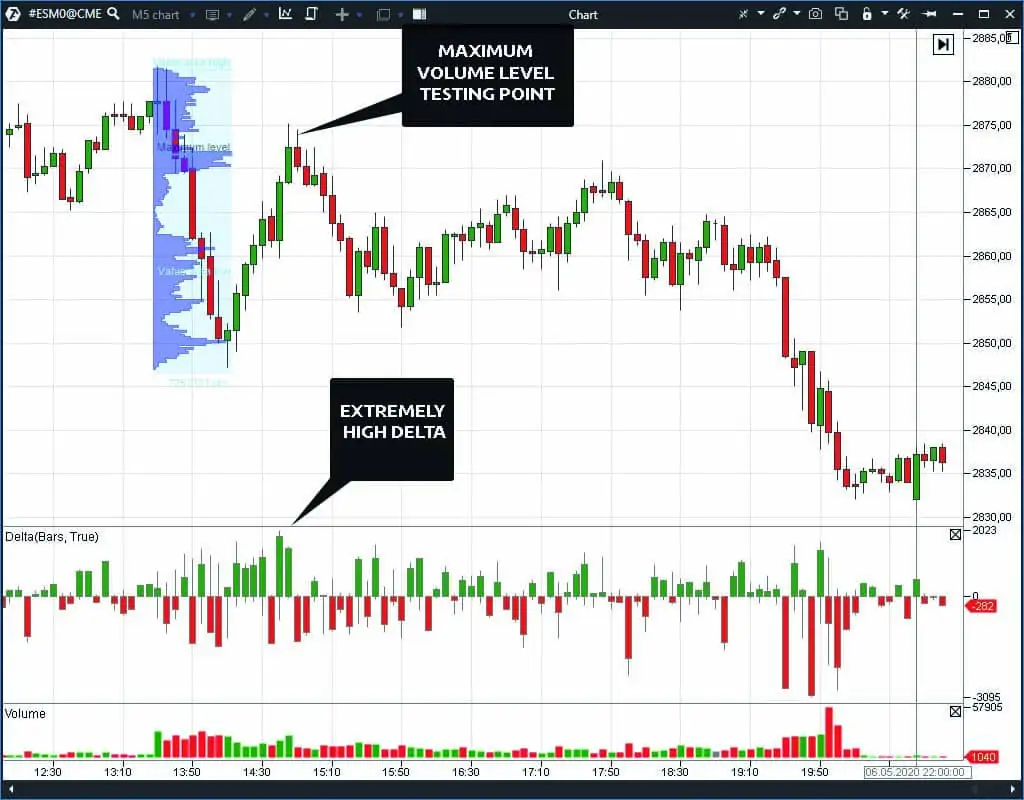
Below is the S&P 500 index futures, traded on the CME, chart. The timeframe is 5 minutes.
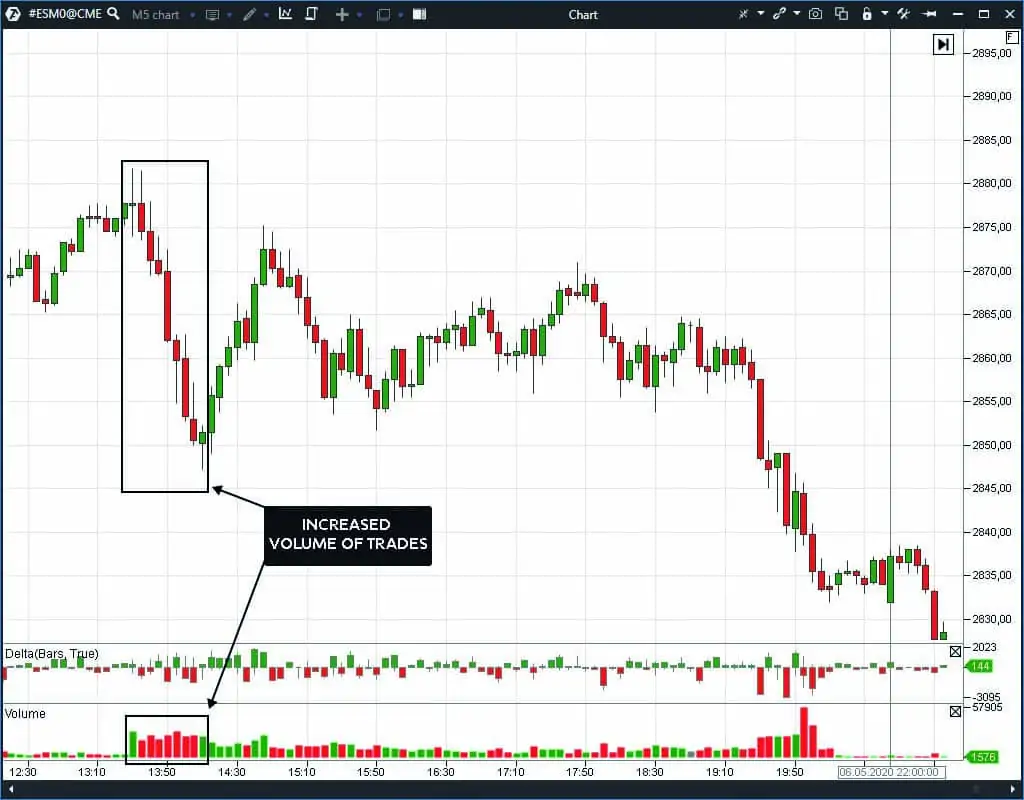
An area is marked in the chart where a quick down impulse movement was observed.
A strong impulse may occur as a result of news or macroeconomic statistics publication or a politician statement.
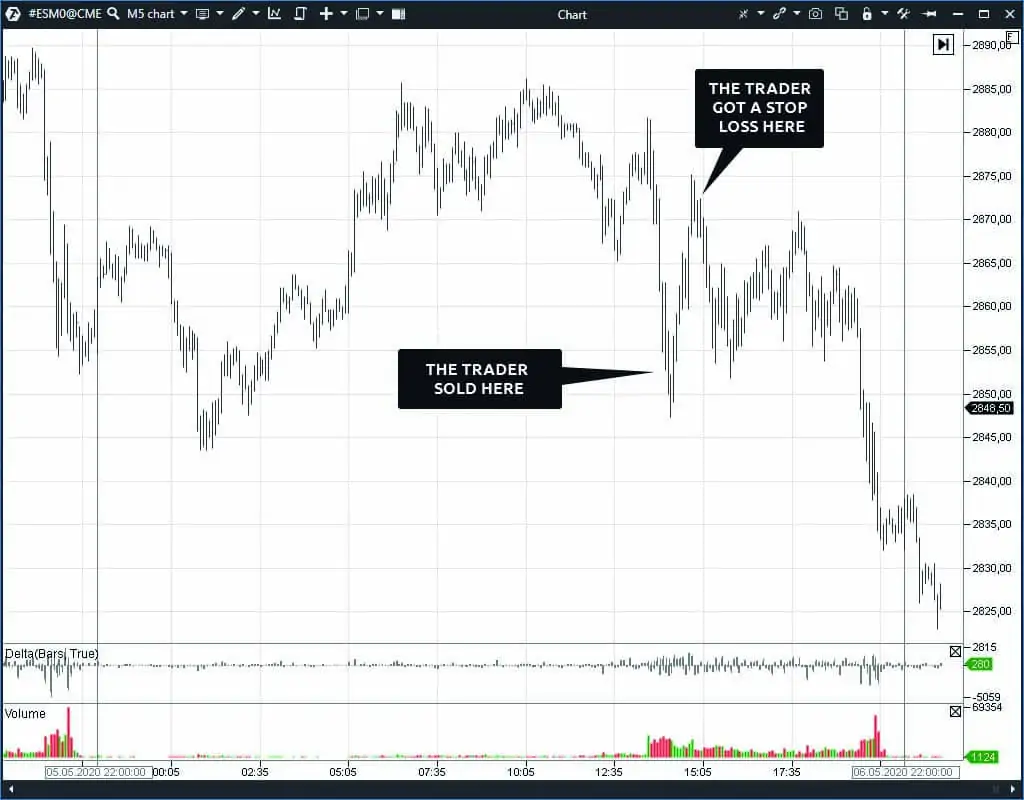
If you trade during a day, a down impulse may give rise to a wish to sell the futures hoping for the movement continuation. However, the high impulse speed usually doesn’t allow a timely opening of a position. To make a decision a trader needs time in order to:
- read the news,
- analyse its influence,
- perhaps, overcome his own doubts.
As a rule, he has to work ‘post factum’, when the impulse is exhausted.
Due to this, the following picture is quite possible:
We recommend you not to hurry in such cases but to use special volume analysis indicators.
First, try to use the horizontal volume indicator
We will use the market arbitrary profile drawing tool. This tool is available in the ATAS platform from the chart menu or after pressing F3.
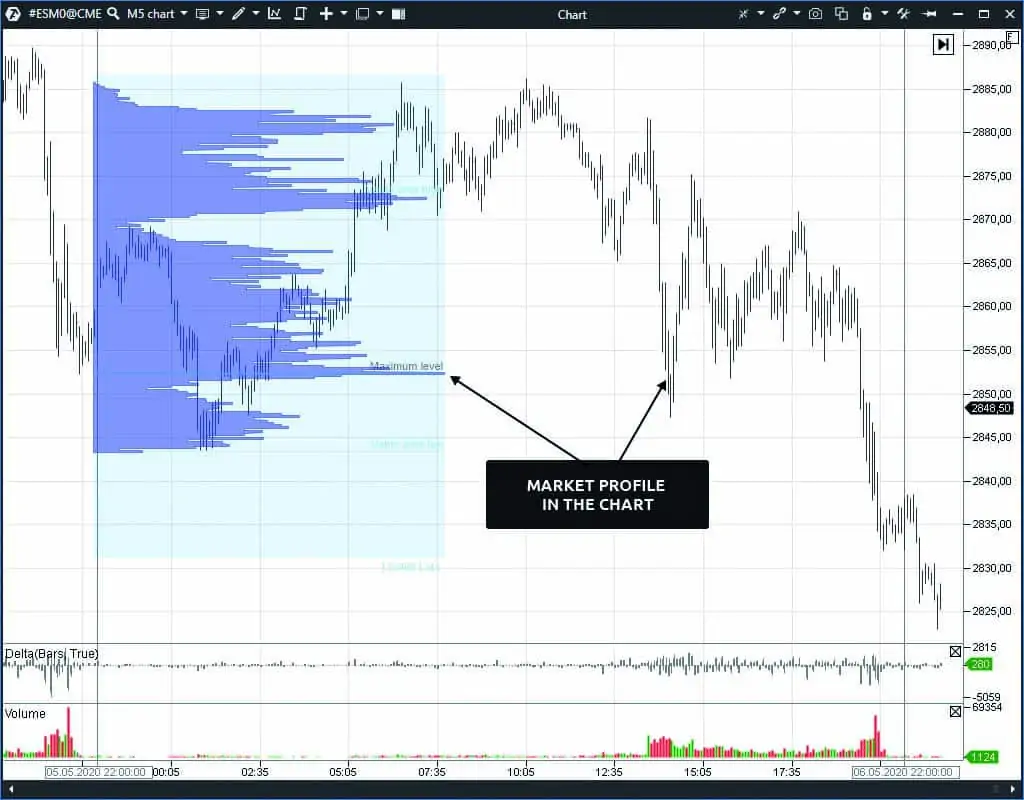
So, let’s activate the market profile in the chart.
The profile shows us that the maximum volume was traded two hours earlier, just at the level close to 2,850.
Horizontal volume levels are formed for a good reason. They show the places where the fight of the seller and buyer interests was extremely hot. Increased volume levels are areas where major market participants (or a big number of medium and small participants) operated, which means that, most probably, opposition between the two parties would renew.
How to identify who would win in the event of testing the maximum profile level?
Make it a rule to identify the winner by the direction, to which the price moved after emergence of the maximum volume.
The price moved up in the case under consideration. Moreover, it was above the maximum volume level for a long time (approximately from 5:00 until 13:00). It means that the buyer was stronger than the seller in our case. This factor has to be taken into account when testing this level, since, in the majority of cases, the buyer would be stronger again during repeated testing.
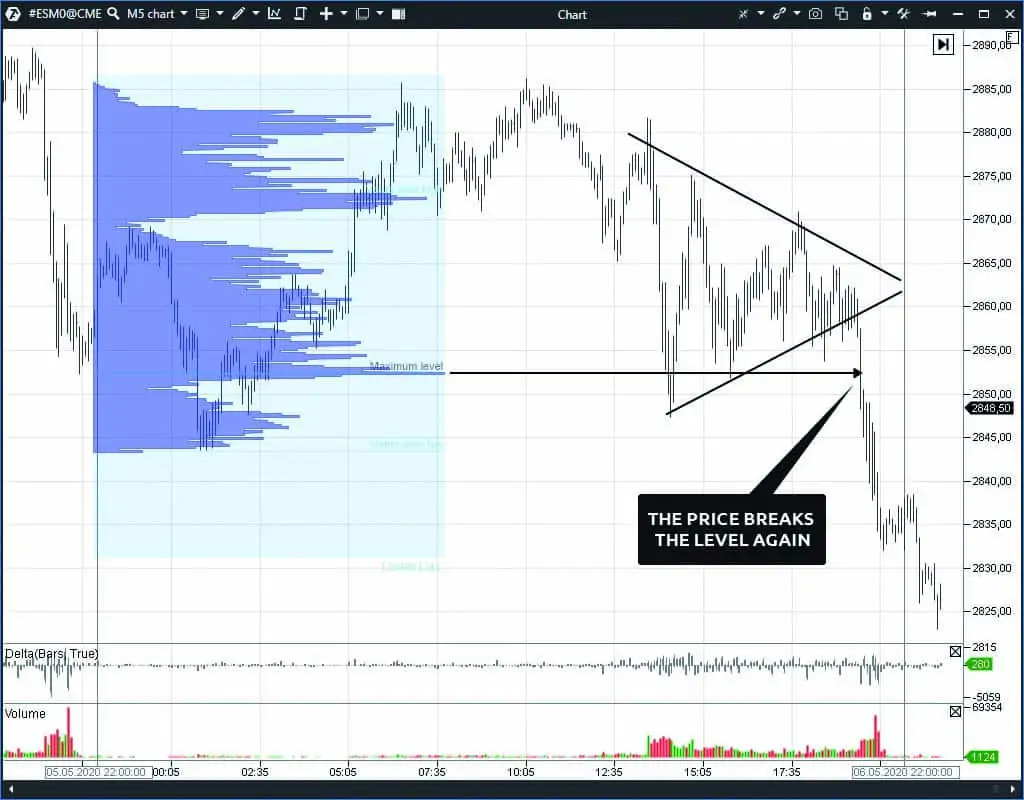
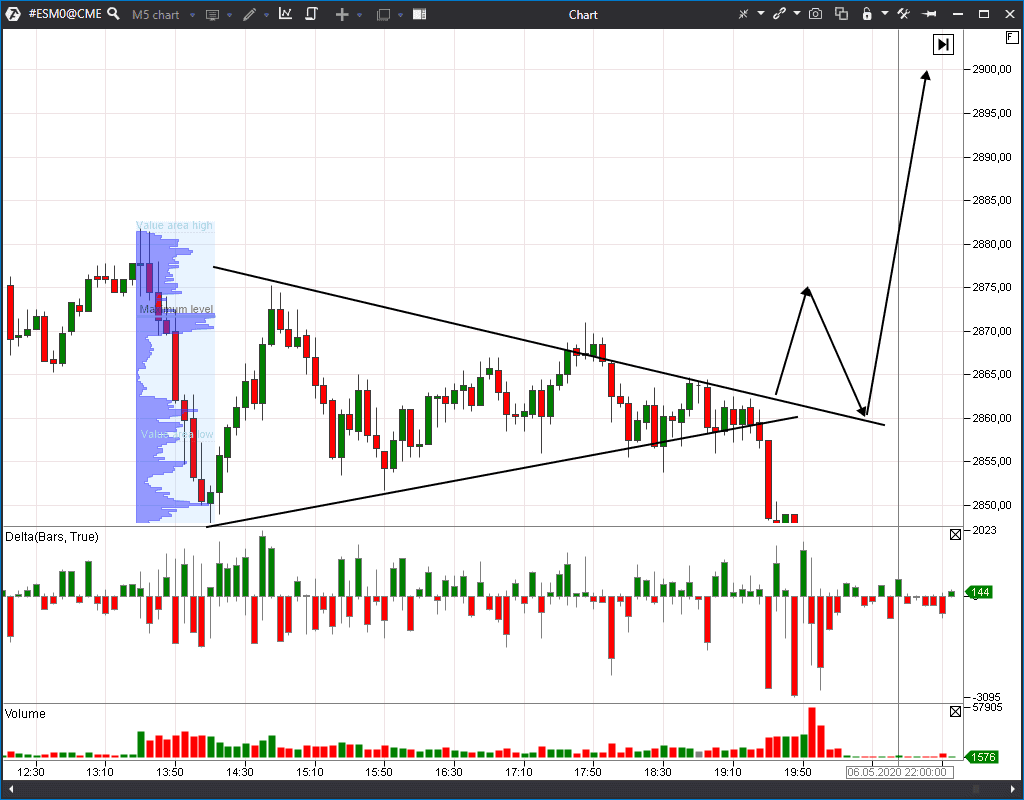
This case is rather indicative, since if we trace the further development of things, we will see that the price moved closer and closer to the level and the chart was compressed as if as a spring.
You may notice that local high and low extreme points form two inclined levels in the chart. They visualize a triangle, the acute angle of which is to the right.
Appearance of this pattern sends us a signal that there is a deliberate impact on the price from both sides. As a rule, a breakout of one inclined level forms a further short-term trend.
We can see post factum that the level 2,850 was broken although it took some time. In our case, the bounce was a move in 100 ticks to the 2,875 level. Every tick under the ES instrument costs USD 12.5; so, the loss at the bounce is USD 12.5 x 100 = USD 1,250 when trading one lot only.
If a trader opens a bearish position for the breakout of the 2,850 level directly before this level, then, most probably, he will inevitably get a stop loss, since the majority of the company risk policies do not allow holding drawdowns of more than 2% of the deposit.
That is why, if you are late with opening a position on the impulse movement, follow these rules:
- do not open a trade if the major part of a movement is lost;
- do not open a trade if there is a level (above or below) with a maximum horizontal volume, to which the price may return (it may return if the formed level wasn’t subject to testing);
- remember that retracements/bounces from the levels with maximum horizontal volumes is a rather frequent phenomenon.
Delta and Vertical Volume indicators
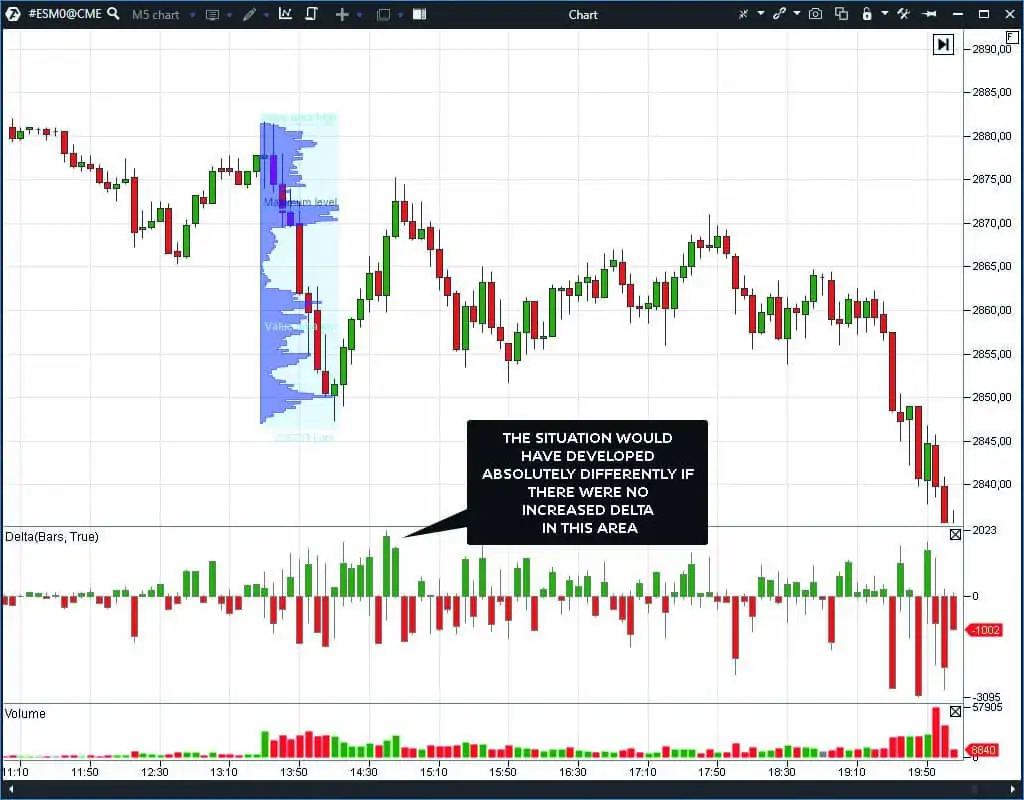
We will continue to analyse the volume for our example. We will enlarge the chart a little bit in order to see availability of the increased volume or substantial preponderance of initiative in more detail. We will need two indicators for this – Delta and Volume. We will set both indicators in the bar mode.
We can notice in the chart that there is an increased volume of trades in the studied area. To a certain extent it is connected with the influence of opening the American session, which is a significant factor. Quite often, America trades its interests, which may differ from the European ones, that is why the fact of attack on the 2,850 level from the American side cannot be disregarded.
Follow this rule when working with instruments, which have the around-the-clock nature of trading. Do not expect that the price would move during the American session as it does during the European or Asian session. Read this article for more details about operation during various trading sessions.
Why does initiative fade out? Why does priority change?
While the support level stays topical, it is difficult for a trader to answer the question – how long will it continue.
However, you can note for yourself that the more the price touches one and the same level, the higher the probability is that the level will be broken.
Let’s continue the chart analysis trying to find answers to the questions:
- Why do certain levels hold the price?
- Why does a sharp impulse on increased volumes become weaker after the level breakout?
- Why does the volume then reduce and a stage of flat movement, which grows narrower, starts?
We may judge the chart situation as the weakening of efforts on behalf of the seller.
Now we analyse the market on behalf of a regular observer, who can see only the consequence of some inner motives but who cannot identify the market participant motives themselves.
What to do and how to trade?
- First, we assume that the first attack on the support level failed due to the weakening of sells. We may often observe that levels could be tested several times before the support or resistance is broken. However, we do not know the reason for such weakening, that is why we accept this fact as given.
- Second, for our specific case, we should find a point with a maximum horizontal volume above, to which the price could bounce. We will use this point as a point for opening a short position. This stems from one of the main rules of a successful trader – do not hurry to enter a trade in the direction of the impulse but wait for retracement.
- Third, we should recognize that we do not understand all internal market drivers. That is why we should use a stop order when opening a short position in order to limit losses.
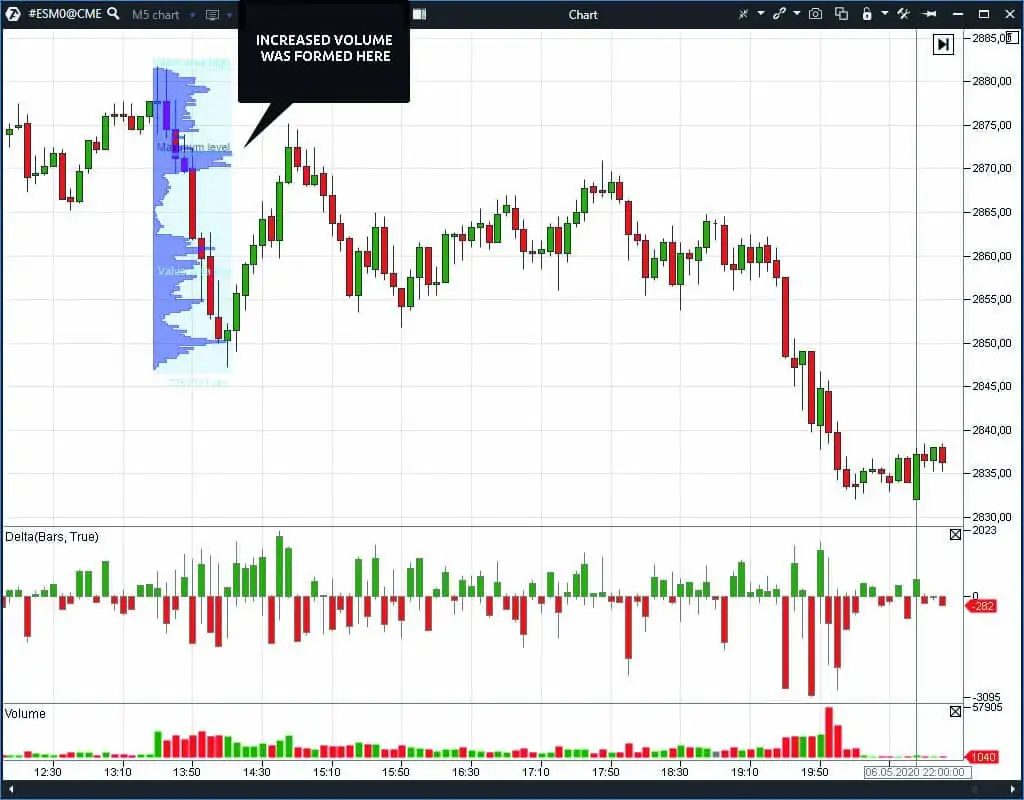
Let’s use the horizontal volume profile for finding a point with a maximum volume. Let’s consider an area where the first impulse attack of the level was formed. To do it, we press and hold the F3 key and draw the volume profile in the chart.
The profile gives us a hint that the point with a maximum volume is at the level of 2,872. This is a reference point for entering short.
We recommend you to always look for high volume as a reference point for the retracement maximum. Besides, the probability of retracement to this point is not always 100%. However, you limit your risks if you wait for the price to approach the reference point.
When (and if) the price returns to the maximum volume point of 2,872, your limit sell order will be waiting for it with automatic posting of a protective stop order.
In the event the price reaches 2,872, it is important to watch what the delta shows in this area.
In our case, the price moved a bit behind the 2,872 level. However, there was no strong movement and the protective stop order wasn’t activated.
The matter is that the stop order size should be posted in such a way, so that the expected movement towards the profit would be at least two times bigger. That is why, it is necessary to set the supposed goal while waiting for the repeated test of the 2,850 level. If the price (in our opinion) should decrease by 80 points, then a stop order could be posted 40 points above the 2,850 level. We want to remind you that the minimum price step of the instrument is 0.25 points (1 point = 4 ticks).
Let’s come back to the chart. Note that, when coming back to 2,872, the delta showed extreme preponderance of buyers. The delta value tells us that activity of the buyer was very high, however, the movement higher didn’t take place. Perhaps, it was a local buying climax. The level stood ground and this is yet another argument in favour of the buyer’s weakness near the level, which the seller protects with his limit orders.
The buyer, despite his activity, cannot absorb the whole seller’s supply. In such a case, our short position was posted correctly and we just have to wait for the profit registration.
Since we expect that the 2,850 level will be tested at least once again, it is expedient to close your position completely or partially namely there.
Partial position closing allows us to register a part of profit and continue to wait for the level breakout with a lower risk.
Let’s consider a hypothetical scenario, at which the price would bounce from the support level again.
Such a situation is quite possible and you can find many confirmations of this by yourself. It is quite difficult to calculate such a probability.
From the point of view of technical analysis, there could be no factors that point to repeated retracement. However, volume analysis could provide some ‘leads’.
First of all, you should recognise that you cannot calculate the whole market position margin. A big number of short and long positions are opened in the market simultaneously and all of them have their unique history. Some portfolios grew in value, some fell.
Exchanges (or connected structures) have a possibility to calculate both the individual value of every portfolio and general value of a group of portfolios. For example, the SPAN system is in charge of calculating portfolio value on the CME.
Major market participants, most often market makers, who have to track values of all portfolios due to their responsibility to provide the market with liquidity, can connect to the SPAN system.
Providing the market with liquidity, a market maker needs to make calculation in the forward market of:
- futures contract portfolios;
- options market portfolios.
The matter is that the futures price change, volatility and time value decay of options significantly change the value of every portfolio.
Let’s assume that you have an ESM0 futures short position. And your portfolio will grow in value when the futures price goes down.
Let’s further assume that you have, together with a futures short position, a sold PUT contract with the underlying asset of ESM0 on some close strike. Then your portfolio will grow in value only until a certain moment, after which the portfolio value will not grow.
Thousands of possible combinations are formed during a day and traders form their portfolios in many ways. Some traders build complex structures, some take a linear risk with a regular stop loss – all these things influence the general portfolio estimate, which is tracked by the exchange (or, more exactly, the clearing house), which plays the role of the main counteragent.
The task of the main counteragent is to avoid emergence of such circumstances, under which obligations might not be executed.
We all remember events in April 2020 when WTI oil quotes turned negative. It was a shock scenario namely for the Moscow Exchange and Russian brokers, who didn’t have algorithms of the margin calculation under conditions of a negative price. Brokers were forced to pay profit for short position holders at the moment of the fall at their own expense, since there just was no sufficient initial margin available on behalf of short position holders. Accounts of short position holders turned deeply negative and it generated a wave of court claims against the exchange and brokers. We may assume that the Moscow Exchange and brokers acted within the legislation and decisions of the court instances would be made not in favour of traders.
Usually, the market makers, the role of which are played by such major banks as JP Morgan and Goldman Sachs, are used for developing resistance to sharp price fluctuations. Big volumes of market makers are capable of stopping the market or ‘pushing’ it in the right direction where it is necessary.
That is why, when we see an impulse towards the level and expect its breakout, the SPAN system will show that a volume, sufficient for breaking the level, hasn’t been accumulated yet.
The destiny of further movement largely depends on the direction, in which the volume would be accumulated. That is why we could have witnessed an up impulse from the scenario under consideration for the ESM0 instrument. However, indirect indicators, by which we built our assumptions, would have other values. For example, the buying delta would have been not so high in this area.
In such a case, the portfolio value would have pointed to the fact that a breakout is not possible here, since the required volume hasn’t been accumulated.
We used this example to show that the price, in the majority of cases, is where the market has a balance. If the price moves out of the balance, we may observe further returns into the balance area (as a rule, next day).
By the way, expiration of options and futures exerts strong influence on the market.
Inward nature of false breakouts
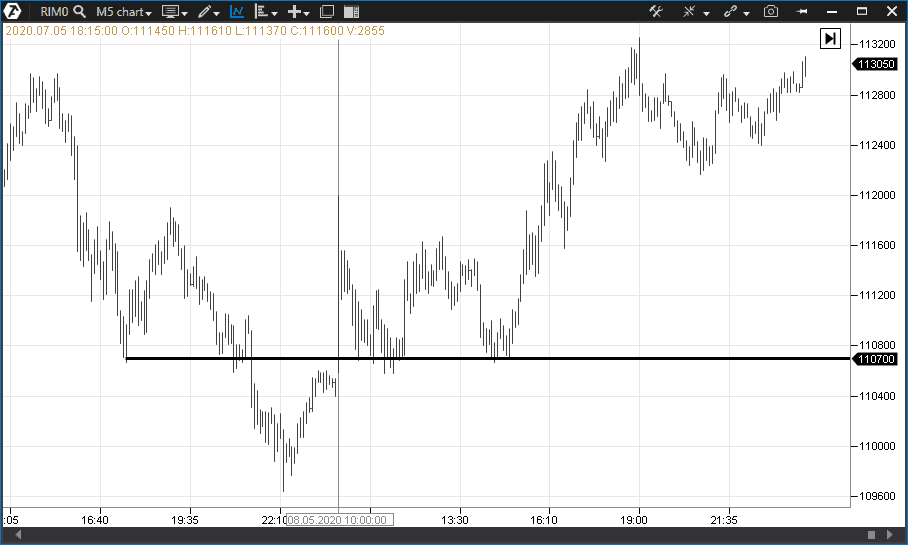
We will show in the following example that the price may sometimes violate the balance area for a short time. This example is for the RTS index futures.
The 110,700 price level served as the support level but failed to keep the price from falling at just another testing. The price turned out to be in the area, which some traders call ‘overbought’. We are inclined to describe it as a transfer into the disbalance area, from which the price would rush up. Such cases, when the level breakout is accompanied with a back return, are usually called false breakouts.
It is rather difficult to explain the nature of false breakouts, since the price fixation under the level tells us that the breakout wasn’t a consequence of traders’ stop loss hunting. We can see in the chart that the trading session’s closing took place below the broken level and the back movement took place at the next day’s trading session opening. Further, the 110,700 level manifested itself again showing its resistance to sells.
We recommend you to indulge in fantasies for a while so that you understand the mechanism of such phenomena (which happen quite often) better.
Try to imagine a situation when you can calculate the cost of all forward positions, opened by different traders. Under such circumstances, you will have a calculation of the portfolio values for short and long positions.
This information will give you a clue that the short position profit starts to significantly exceed the long position loss when the price moves, for example, down. And since the profitable position payments are much higher than the saved profit on loss positions, someone will have to cover this difference from his own pocket.
A major market maker, who usually accumulates oppositely directed positions unlike regular traders, may become a hostage of circumstance in such a situation. Namely oppositely directed portfolios could motivate him in holding the price in a certain balance. Even then (as you might have guessed), the market maker can, most probably, use his position and start ‘pumping’ his volumes for the price return into the balance area.
Conclusion
In this article, we showed you situations, in which a trader may become a hostage of his own expectations. Once again, we would like to pronounce the main rules, which will help you to avoid negative consequences:
- while expecting the level breakout, use the volume profile to assess a probability of such a breakout;
- do not open your breakout position directly near the level but wait for retracement/bounce;
- if the level has been broken and a trade wasn’t executed, remember that the level will have the mirror effect, which means that support becomes resistance and vice versa;
- use the volume analysis indicators – Volume, Delta and Open Interest (for MOEX) – to identify accumulations in the side movement or narrowing triangle phases.
Information in this article cannot be perceived as a call for investing or buying/selling of any asset on the exchange. All situations, discussed in the article, are provided with the purpose of getting acquainted with the functionality and advantages of the ATAS platform.

