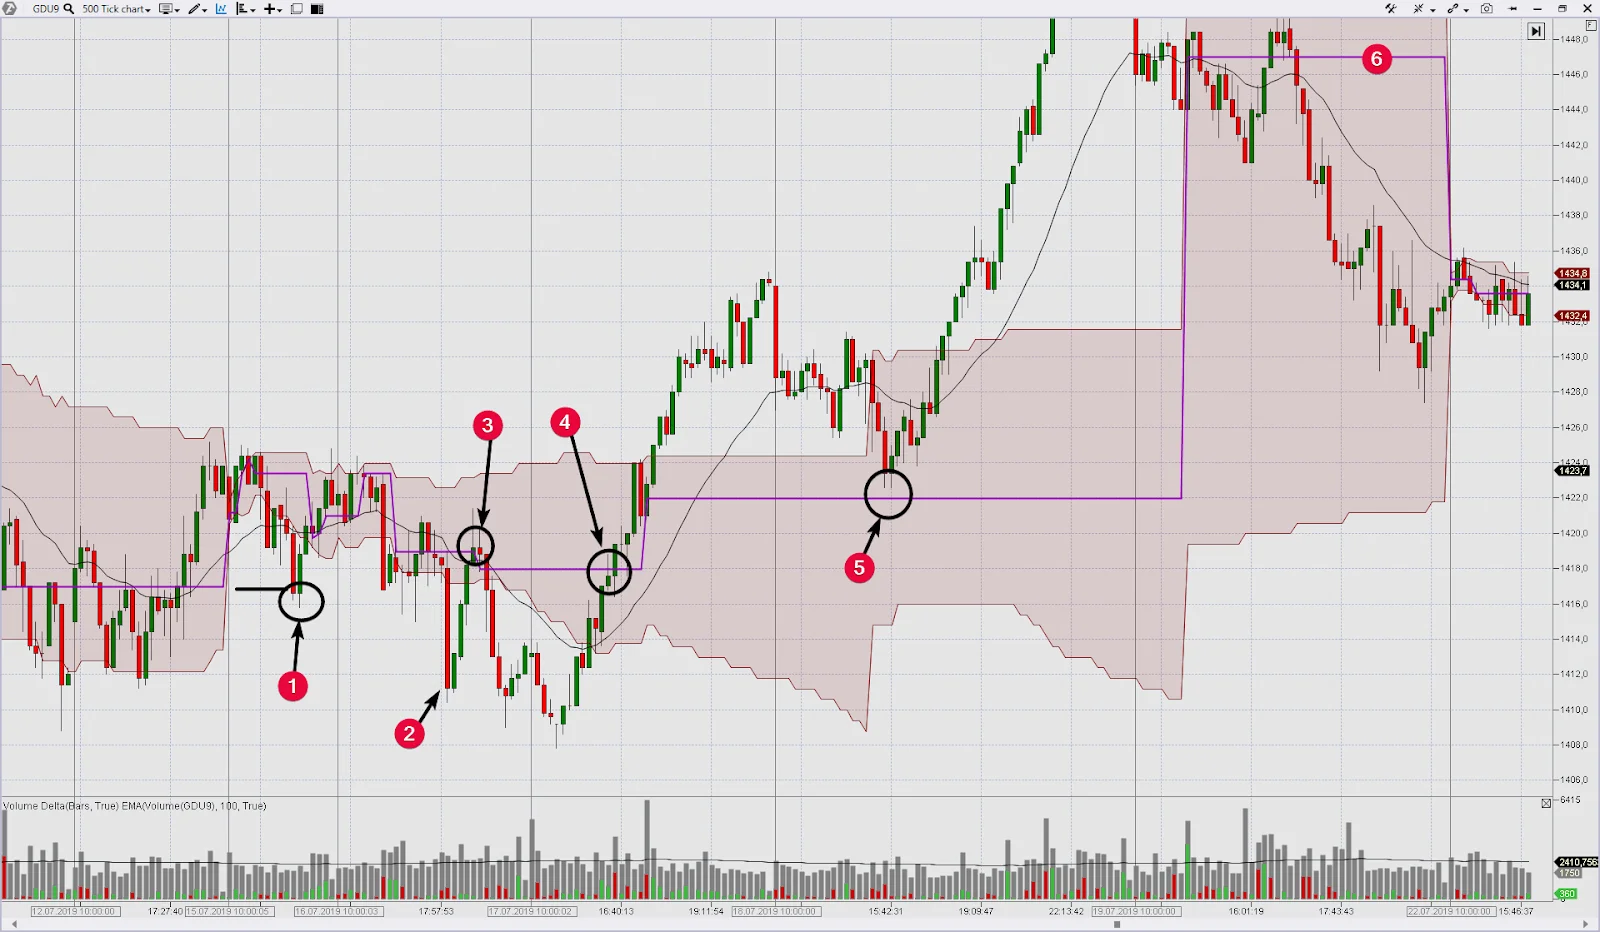
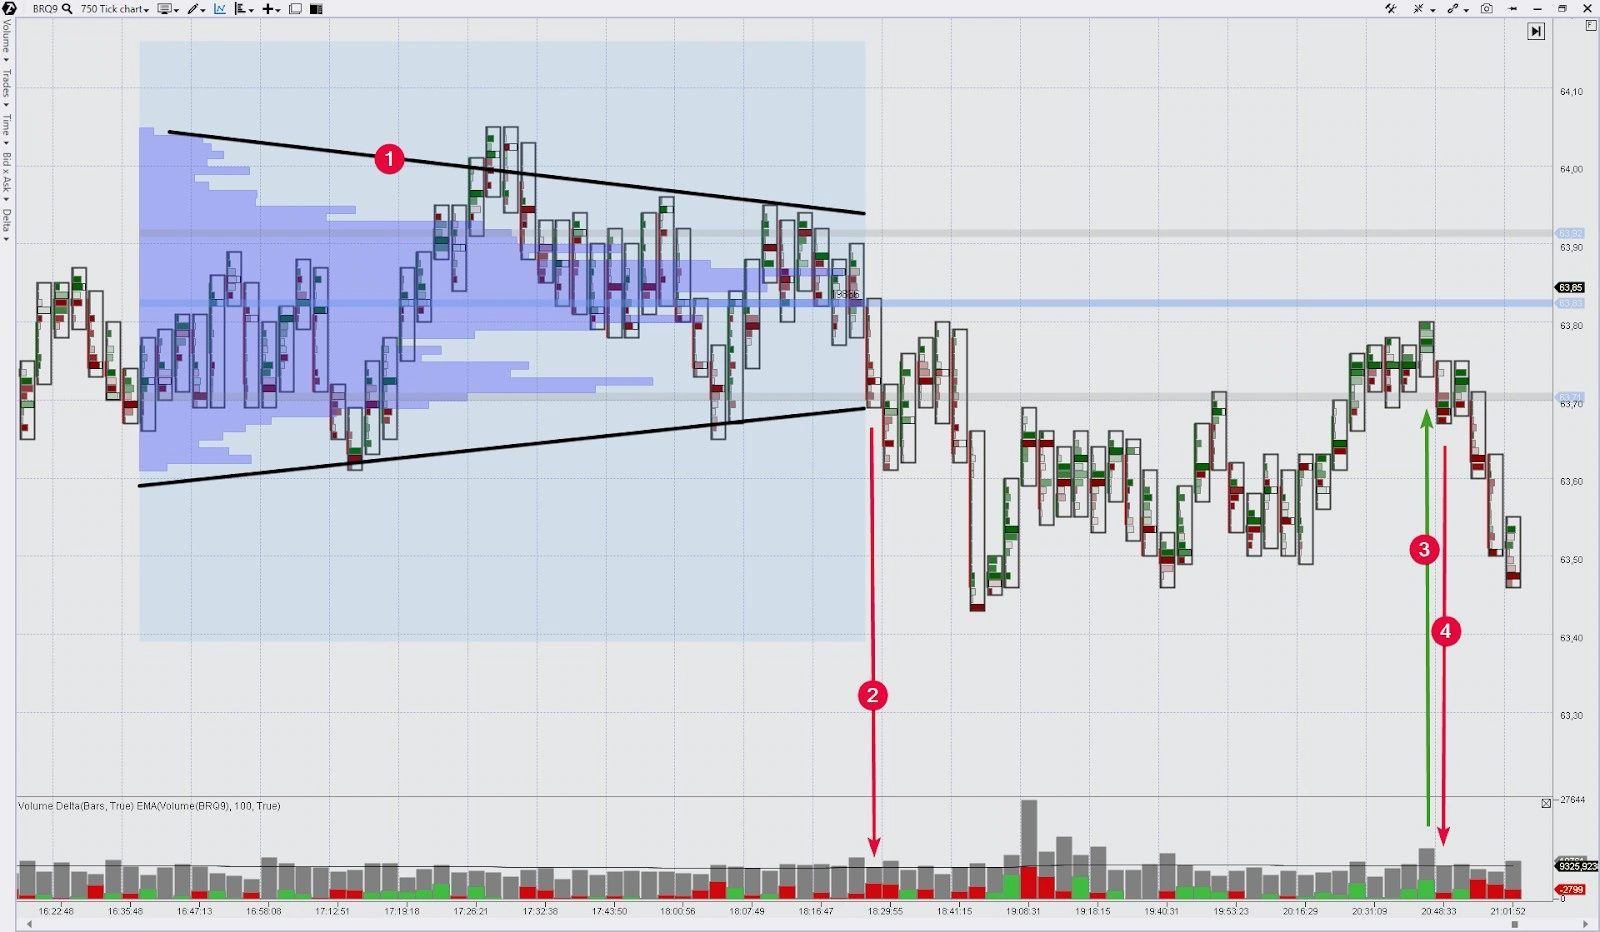
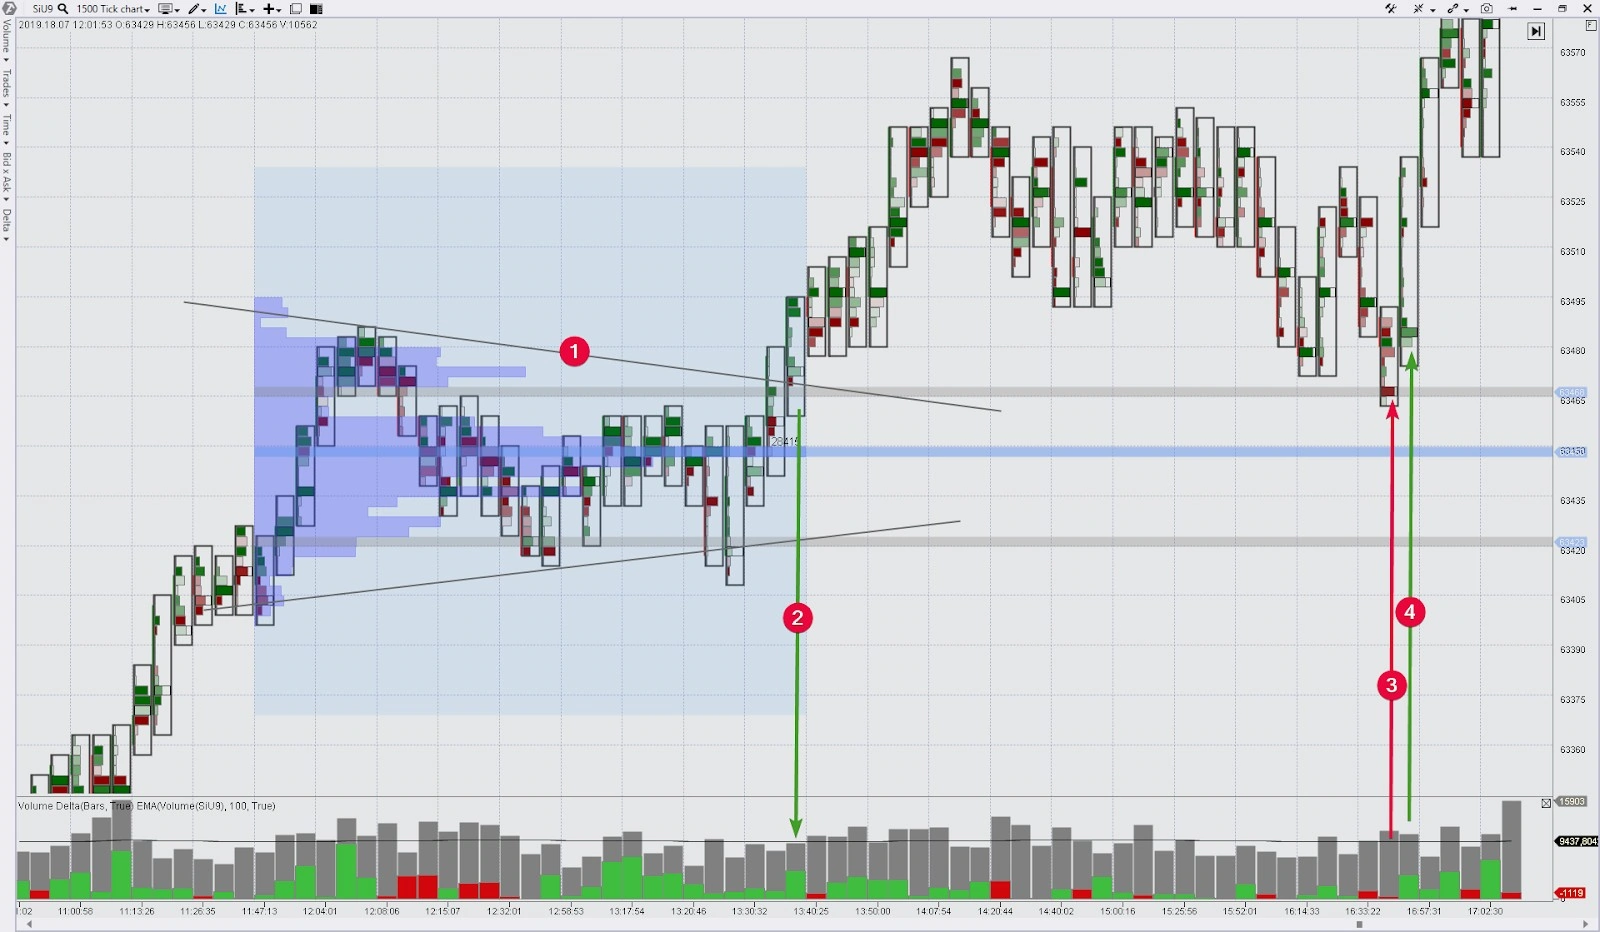
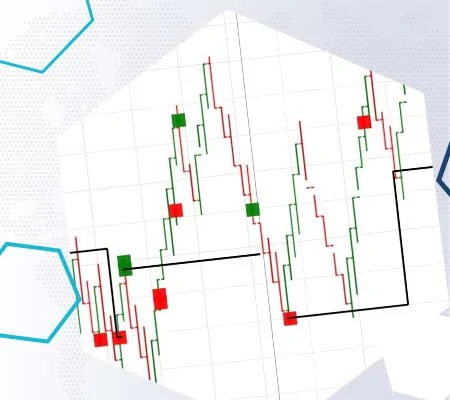
Let’s consider setups of trading by levels for 5 working days – from July 18 until July 24 inclusive.
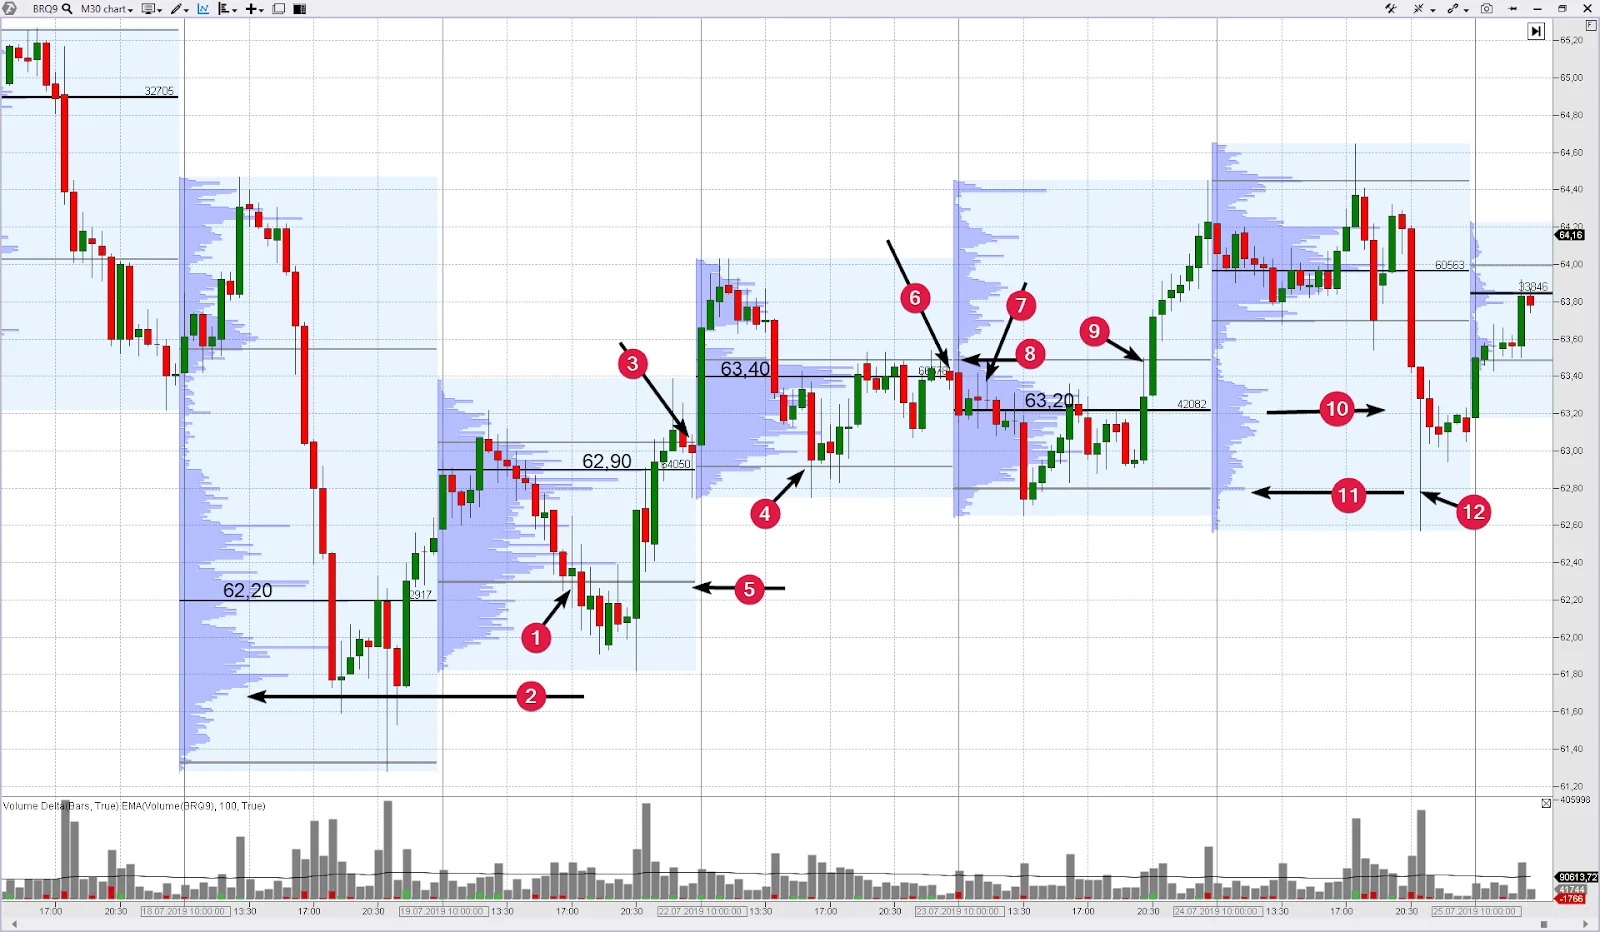
July 18. There were no trades because the trading opened significantly below the POC level of July 17 and there was no test.
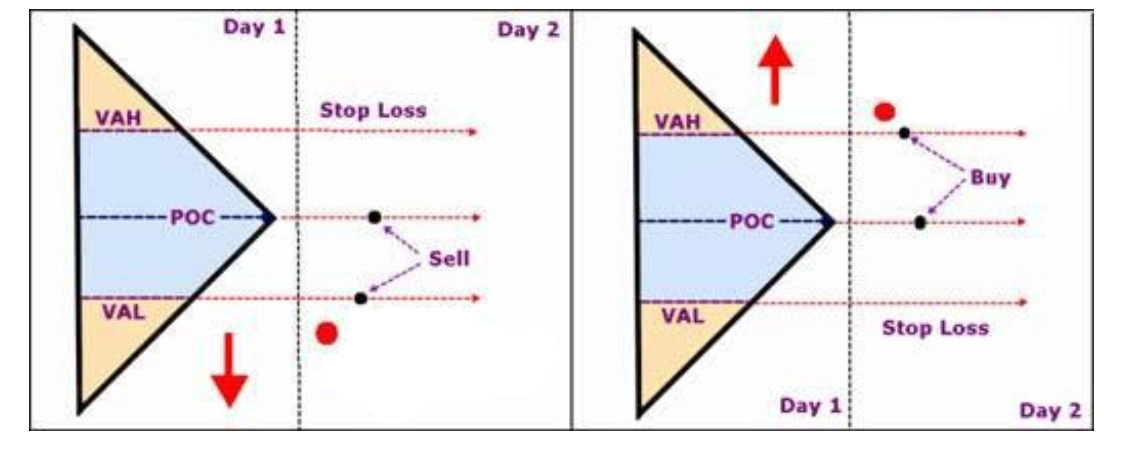
July 19. The market opened higher than the previous day’s POC, that is why we start to wait for a buy signal.
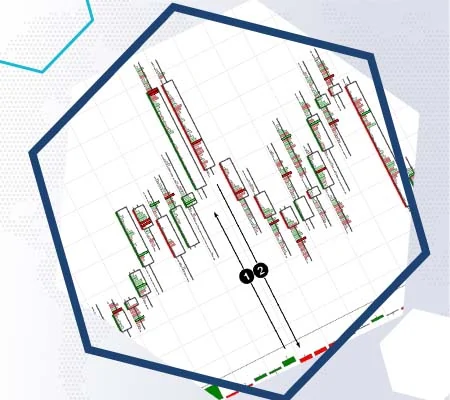
1 – buy at 62.20.
2 – according to our strategy, we should have posted a stop below the automatically calculated value area low and it ‘emerged’ practically at the day’s lows. Quite wide. We could post a stop at 61.70, where the profile clearly ‘deflated’.
3 – no matter where the stop was posted, we close with a profit at the level of 63.00 (+80 ticks).
July 22. The market again opened above the previous day’s POC, that is why we started waiting for a buy signal.
4 – buy at 62.90.
5 – stop at 62.30.
6 – close at 63.40 (+50 ticks).
July 23. The market moved below the previous day’s POC level and we started to wait for a test and sell signal.
7 – sell at 63.40.
8 – stop at 63.50. A very narrow stop.
9 – we were kicked out by the stop here. There was a reversal after the trade reached profitability of more than 80 ticks (could have posted a breakeven). The loss is 10 ticks.
July 24. The market opened above the POC of July 23. Waiting for a test and bounce.
10 – buy at 63.20.
11 – stop at 62.80.
12 – we were kicked out by the stop here. We should note that this candle with a long ‘downward tail’ is a clear manipulation with the aim to ‘get hold’ of protective orders of buyers, which were posted under the previous day’s low. Assuming that the manipulation pivot points to the forthcoming growth, we can enter again into a long position believing that the oil price goes up on July 25 (which proved true) but we acknowledge the loss of -40 ticks.
The result of 5 working days is 0+80+50-10-40=+80 ticks. The positive result (excluding fees and other expenses) points to perspectivity of this strategy of trading by profile levels.
Can we improve it? Yes. How? For example, to:
- introduce the rule of moving to the breakeven;
- build profiles manually (not automatically). Building time-independent profiles allows more accurate identification of the balance boundaries and calculation of levels for trading.
- add an element of judgement, which is, perhaps, the most difficult thing. Judgement, as well as intuition, develops with experience. But it allows to adjust levels, select/feel a better moment for exiting a trade.
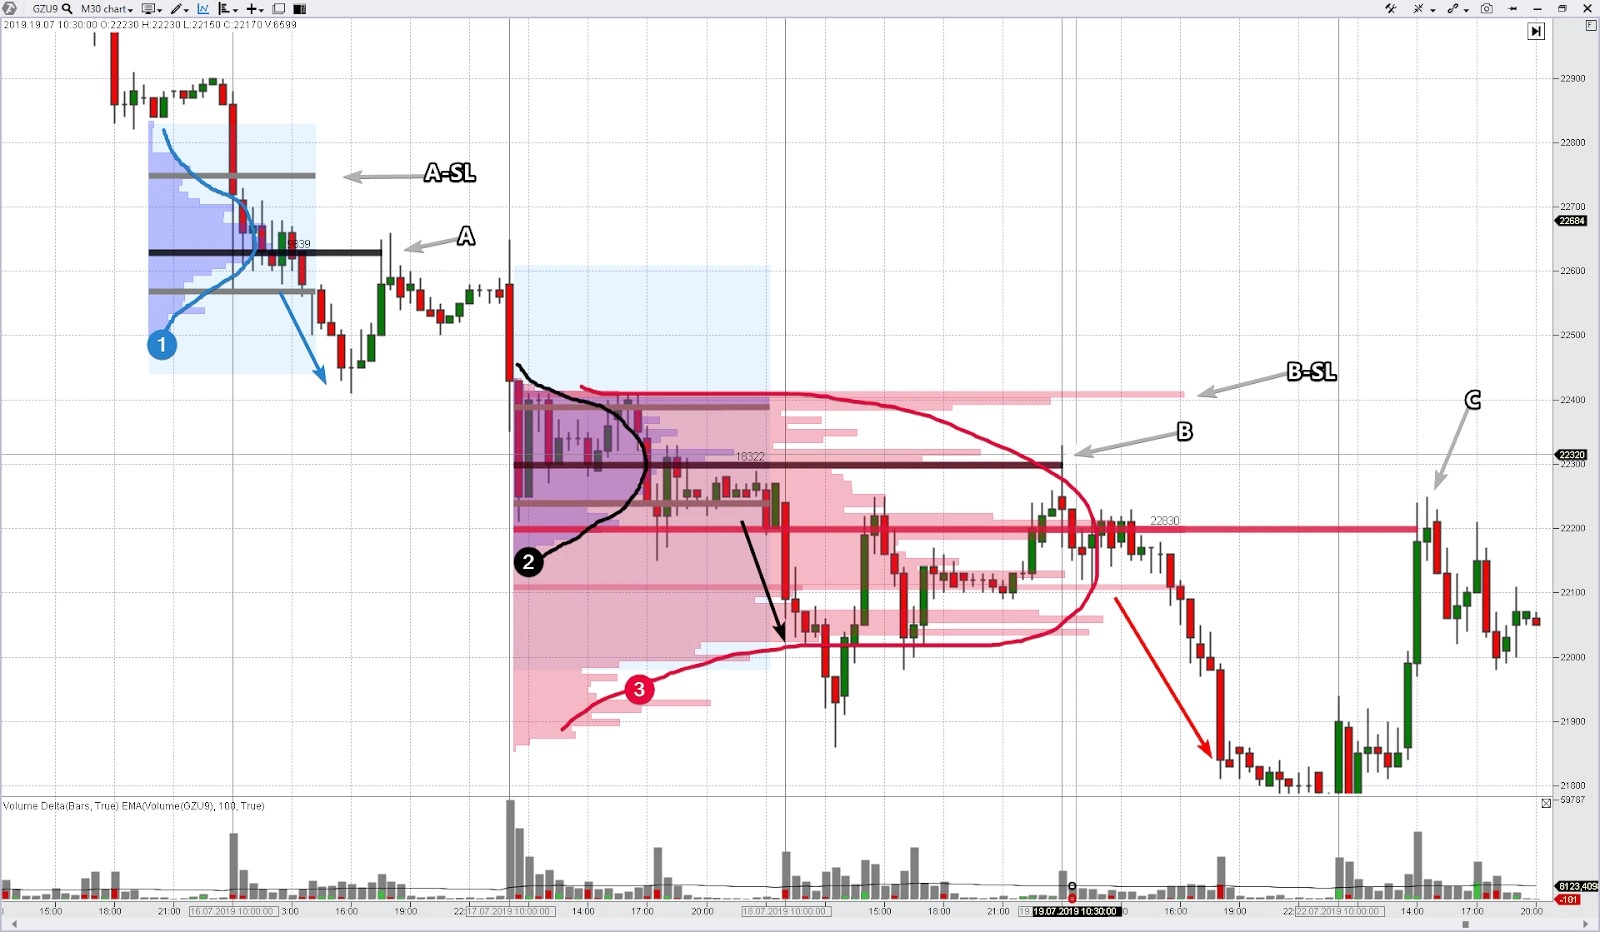
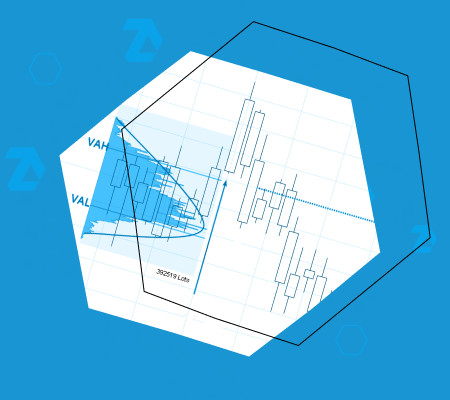
Let’s try. We will use the same strategy but we will build profiles ‘manually’ using the ‘profile’ drawing tool, which you can launch pressing the F3 button. The main principle of a balanced market is a bell-shaped profile. That is why a bell profile is a confirmation of a correctly built balance.

