To confidently navigate through the numerous chart patterns in technical analysis, take a look at our trader’s cheat sheet: Checklists for Trading Patterns.
Bullish Pennant vs. Bullish Flag
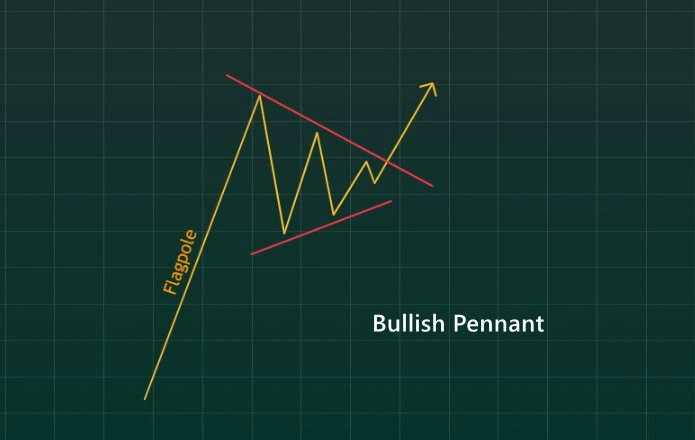
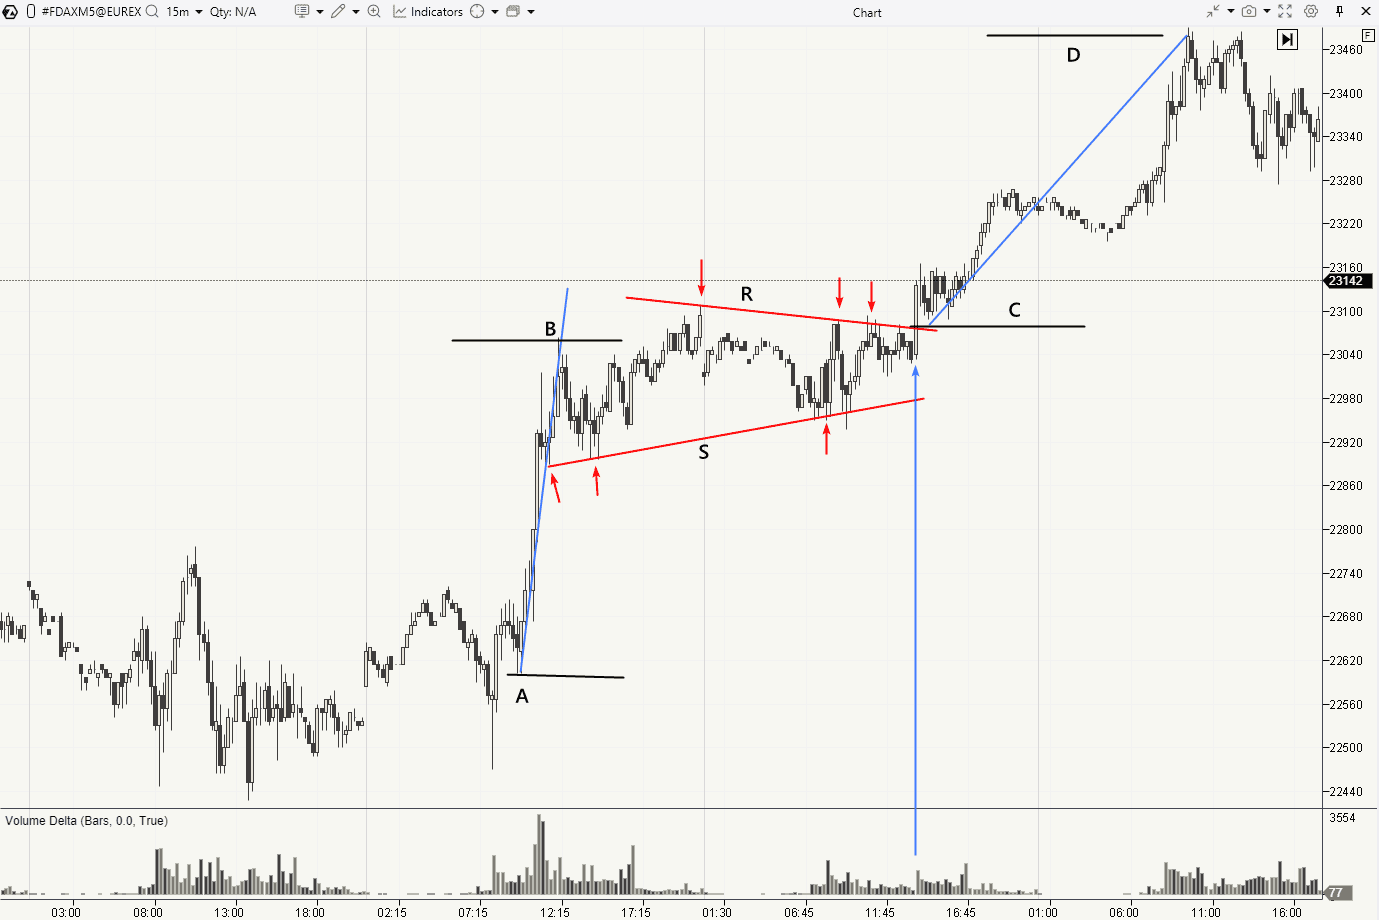
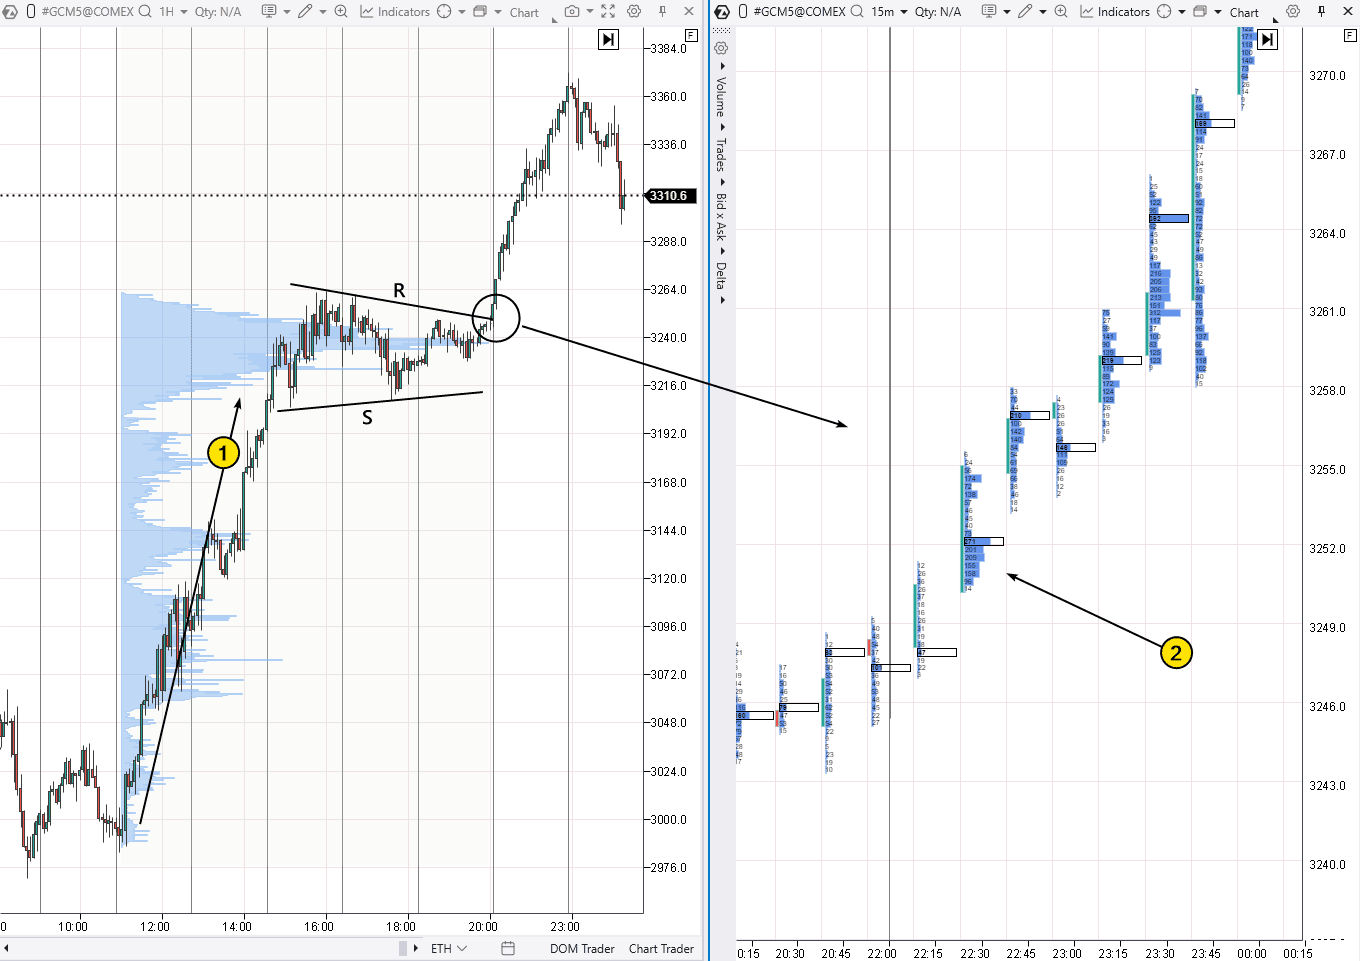
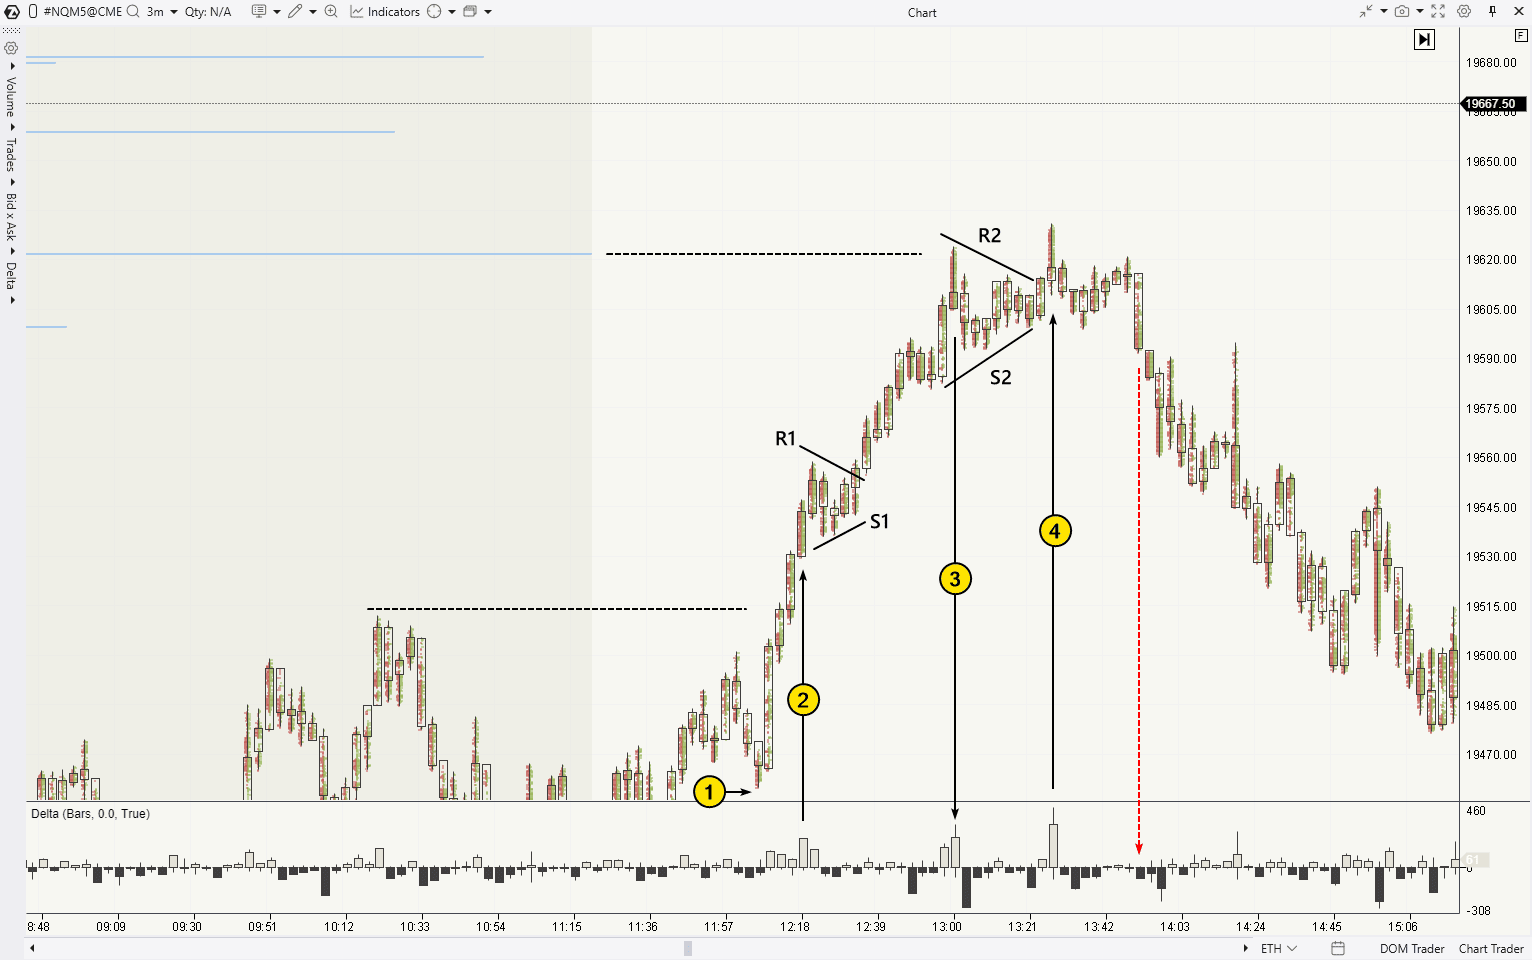
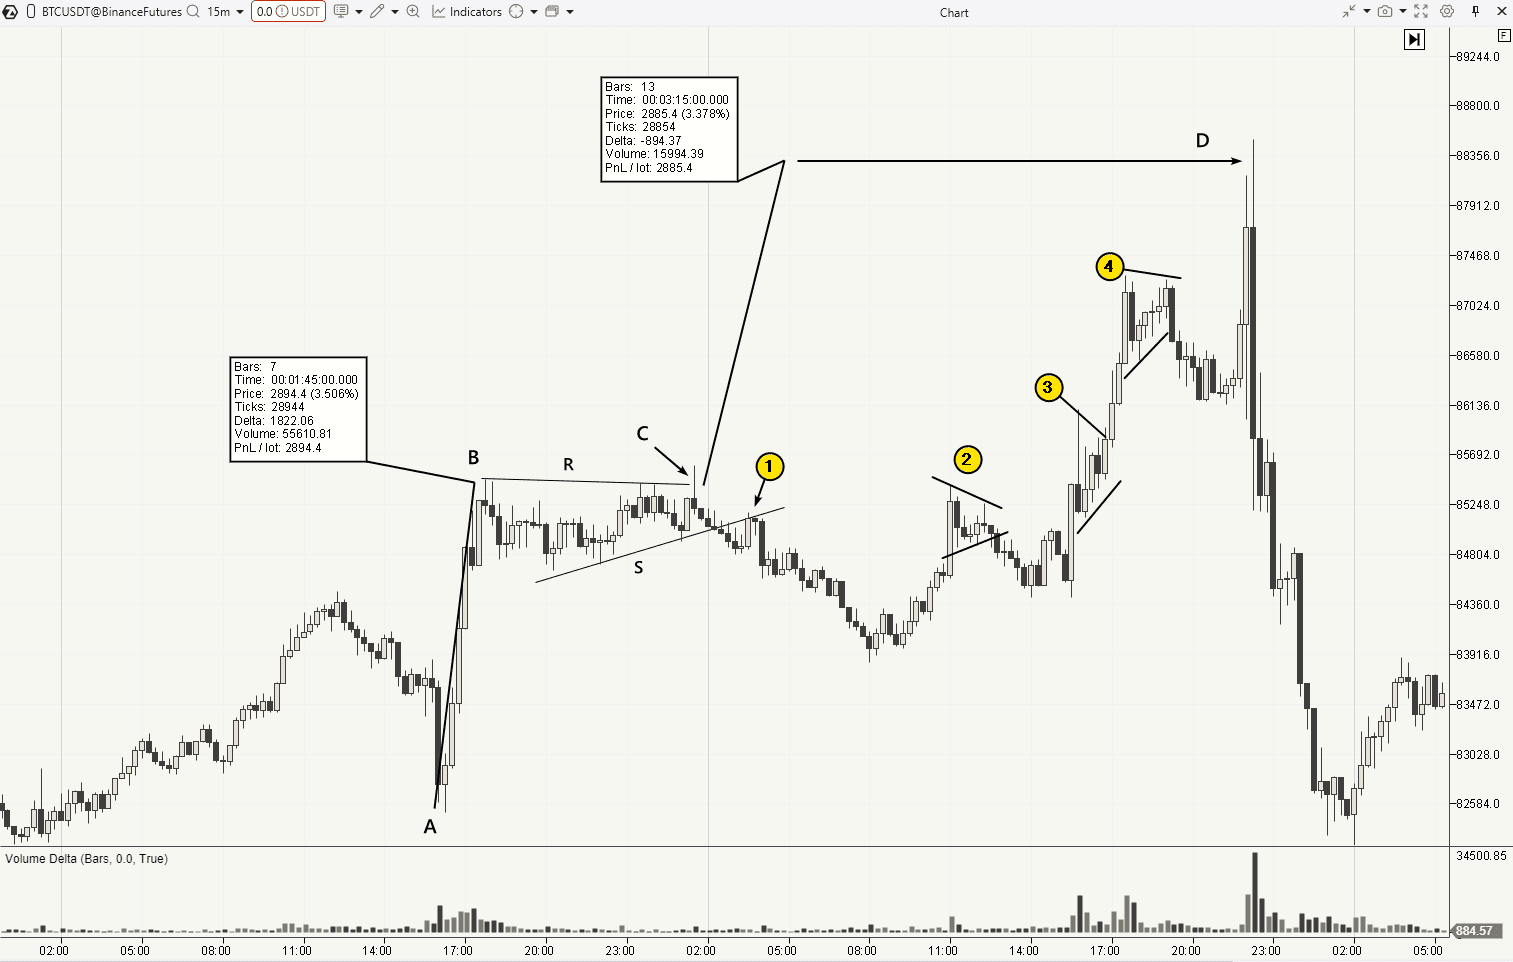
Both patterns are similar in that they are continuation patterns for an uptrend after a consolidation period. Another common characteristic is the method for calculating the target (measuring the height of the flagpole and projecting it from the breakout level of resistance).
However, the bullish pennant and bullish flag differ in the shape of consolidation, which is reflected in the name of each pattern. In a bullish pennant, the consolidation forms a narrowing triangle, while in a bullish flag, the price fluctuates between parallel support and resistance lines.
Bullish Pennant vs. Bearish Pennant
These patterns are opposite to each other. A bearish pennant forms in a downtrend and signals its possible continuation. All the rules that apply to the bullish pennant also apply to the bearish pennant, but with a “mirror image.”
How Does the Pennant Pattern Differ from the Wedge Pattern?
All patterns are based on narrowing lines, with price consolidating between them after a sharp impulse. The main difference is that in the bullish and bearish pennants, the lines R and S converge evenly, meaning the central axis of the triangle is horizontal. In contrast, in wedges, the lines are tilted: in an ascending wedge, they tilt upward, while in a descending wedge, they tilt downward.
✔ Ascending Wedge: This pattern occurs when the price narrows between two slanted lines going upward. It often signals a possible reversal downward, especially in the context of an uptrend.
✔ Descending Wedge: This pattern occurs when the lines converge downward. It can signal a probable reversal upward, especially in the context of a downtrend.


