What is the fractality principle
Mandelbrot fractal (in the picture above) is, perhaps, the most famous fractal among the wider community. It was named after a person who, as it is believed, made the biggest contribution into the study of the principle of fractality.
In his book ‘The Fractal Geometry of Nature’ (1982), Benoit Mandelbrot introduced the term fractals and created mathematics for their description. It’s interesting that exchange trading, as a part of the existing world, fits into the theory of fractals very harmonically. The mathematician Benoit Mandelbrot also pointed to it.
How to use fractals in exchange trading?
Read in the article:
- Fractality in the surrounding world.
- Fractality in trading.
- Chaos theory.
- Fractals in the exchange charts.
- Profitable trading with fractals using volume analysis.
Fractality in the surrounding world
The world, which surrounds us, is very diversified and unbelievably complex and observation of the surrounding nature opens for us very interesting mathematical regularities. Very many scholars drew inspiration for new discoveries from the already existing creations in nature or mathematical discoveries were confirmed by the phenomena from the surrounding world. For example, this happened with Fibonacci numbers and fractality.
What does the principle of fractality constitute? There is no clear and generally accepted definition of a fractal in the scientific community.
In simple words, a fractal is an object, the parts of which are similar to the whole.
Signs, by which we can identify fractality:
- an object could be enlarged to infinity;
- an object is self-similar (smaller parts repeat bigger ones);
- it could be reproduced recursively.
Very many objects in the living nature are fractal, which means that they are self-similar.
Examples:
- a tree branch is similar to a tree;
- a coastline between stones at a distance of 1 meter is similar to a coastline between cities at a distance of several dozens of kilometers;
- a bud of a cauliflower is similar to a whole head;
- a small part of a cloud is similar to a whole cloud;
- blood veins in a human palm are similar to the whole vascular system;
- an alveolus in human lungs is similar to the whole lungs, etc.
In other words, fractality is a similarity of a part to the whole and vice versa.
If we understand this principle, we may describe physical objects, phenomena and the surrounding world in general more accurately.
Fractality in trading
Financial markets consist of millions of people, consequently, they are ‘alive’, constantly changing and developing like the human society. Consequently, the regularities we observe in the living nature could be applied for describing and forecasting financial markets. Fractality is one of these principles.
Fractality in nature and trading was clearly described and popularized by Bill Williams in his ‘Trading Chaos’ book (what else a trader should read).
However, you should understand that there are limitations in any book written about financial markets. In order to collect information for a book, write it, edit and publish, an author, most often, needs several years. And since the markets are a ‘living organism’ in the rapidly developing era of information technologies, information in the book may lose a part of its urgency when it is published, let alone when a trader reads it.
Trading systems may go out of date and the trading indicators may work worse and lag behind, however, the basic principles, more often, stay unchanged. That is why, if you read a book about trading, it is important to look for and perceive basic principles rather than specific trading systems or indicators.
Objectively, the principle of fractality will always be urgent and the study of its application in the financial markets will not be a wasted time.
Chaos theory
An important idea in the Bill Williams works is the chaos theory. Scholars use this theory trying to describe the surrounding world and processes that take place in it. The chaos in this theory is not a synonym of disorder. On the contrary, it is the highest degree of the order, the processes and phenomena in which happen in accordance with the organizing principles rather than spontaneously. However, it seems to an outside onlooker, who doesn’t understand these principles, that the process is disorderly (chaotic).
Human brain, in this sense, is also chaotic and it works in accordance with the organizing principles, although, at first sight, its activity might seem chaotic. The markets are products of the human brain activity and they are chaotic by their nature. Nonlinear logic and fractal geometry should be used for describing chaotic processes. If we look at the exchange charts, they might be similar to many fractal manifestations, for example, a coastline, sea waves, river flow, etc.
If we would have created this world using only linear logic, we would have straight trees, round seas and square mountains. However, the surrounding world is absolutely different. The linear logic cannot describe nonlinear processes. The same is true about trading systems developed by traders.
What would the result be if we try to analyze and forecast the nonlinear fractal exchange chart with the help of linear mathematical formulas (indicators) and Euclid linear geometry (chart analysis)?
There will be no ideal result. Methods of analysis of the current state of the market are suited better for understanding nonlinearity (fractality) of the market.
The current state of a nonlinear market is a changing balance / disbalance of demand and supply. You can gain understanding of who wins in the market at this very moment (buyers or sellers) with the help of such instruments as:
- Volume analysis;
- Cluster analysis;
- Footprint;
- Delta analysis, Smart DOM and Smart Tape.
Fractals in exchange charts
Exchange charts possess fractality features. Namely that is why it is extremely difficult to identify the chart time-frame when you look at it:
Such a chart could correspond with a 1-minute time-frame and 1-month time-frame.
This is the principle of fractality in the exchange charts – small is similar to big and vice versa.
An undeniable advantage lies in it for traders, since, if we learn to trade on one time-frame, we would be able to scale our trading:
- If we want to spend less time on trading, we can increase the time-frame.
- If we want to spend more time on trading, we can decrease the time-frame.
Although, of course, any time-frame has its specific features, the general character of market movements is preserved due to fractality.
A local extreme point, consisting of several bars, is called a fractal in trading.
Fractals, which are extreme points or local lows and highs in the current chart, are shown as arrows.
Bill Williams identifies that:
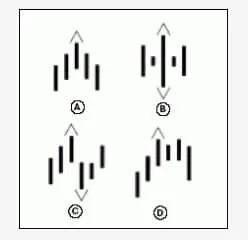
- a bar should have the highest high compared to 2 bars to the left and 2 bars to the right in order to form an up fractal;
- a bar should have the lowest low compared to 2 bars to the left and 2 bars to the right in order to form a down fractal.
As a consequence, fractals cannot appear at the right edge of the chart. At least 5 bars are required for it to be formed. Here are examples of fractals from the ‘Trading Chaos’ book.
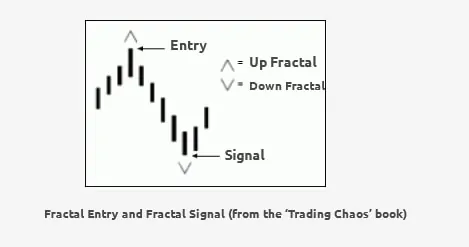
In order to build a trading strategy based on fractals, Bill Williams also introduces the rules of the Fractal Signal and Fractal Entry.
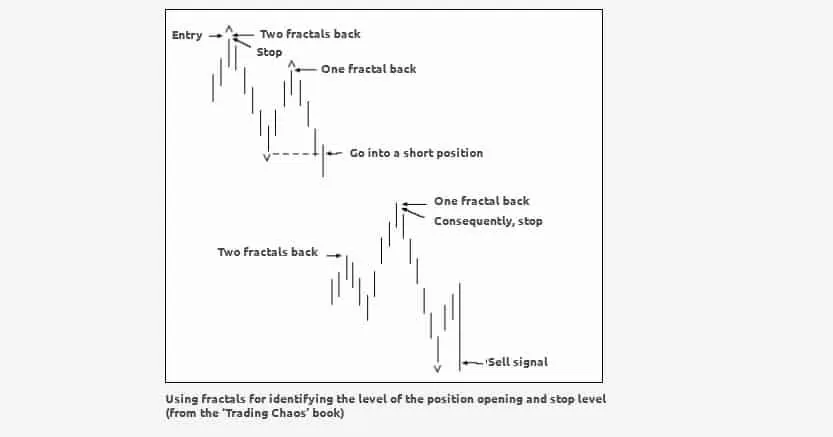
According to the Bill Williams classical rule, it is offered to trade fractals on a breakout (the idea is displayed in the picture below). The ‘bounce’ strategy is used as an alternative.
Bill Williams confirmed the consistency of his approach, based on fractality and similarity to the surrounding world, by his trader’s career and multiple examples of success of his followers.
Is it possible to improve trading with fractals using modern software solutions for market analysis?
Profitable trading with fractals using volume analysis
The main problem of trading with fractals is multiple breakouts of extreme fractals.
According to the classical theory, traders are recommended to post stop losses behind highs and lows in the current chart. As a consequence, a big number of protective orders accumulate there and the cunning market ‘drops in’ there in order to ‘drop out’ traders. They say in such cases – ‘liquidity was grabbed’.
You should trade in harmony with a major player in order not ‘to exit from the market hitting a stop loss’.
For this purpose, you should analyze volumes in order to find a trend, which is formed by the major market participants. Then you will start to understand in what direction the price would, most probably, move. And you should open your trades exactly in that direction.
Functionality of the trading ATAS platform helps to identify intentions of a major player.
How to trade profitably with fractals in practice? Let’s consider 2 approaches – active and passive.
Passive approach in trading with fractals
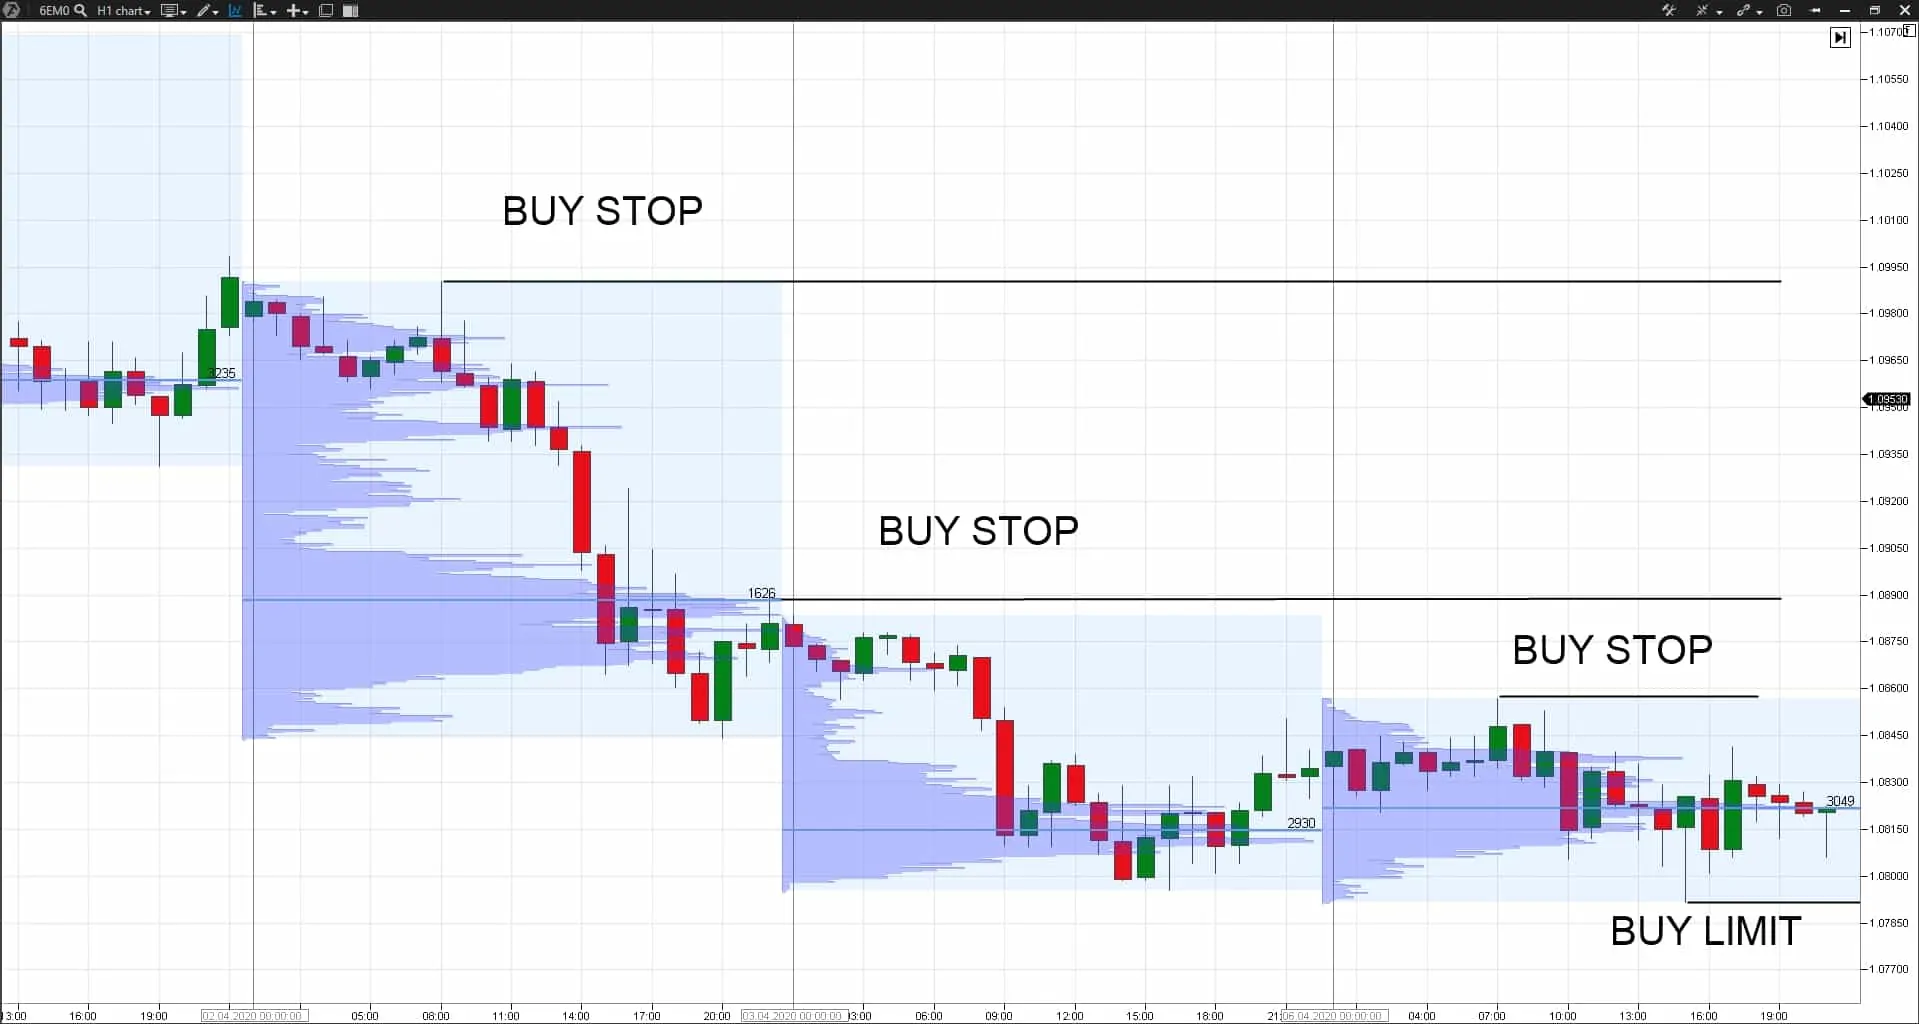
First, identify in which direction the volume moves. You can do it using the Market Profile indicator.
- If the POC (the day’s maximum volume) moved up with respect to the previous day’s POC and the price is above the previous day’s POC, there is, most probably, an uptrend in the market.
- If the POC moved down with respect to the previous day’s POC and the price is below the previous day’s POC, there is, most probably, a bearish trend in the market.
You can post pending orders on the breakout of fractals in accordance with the volume movement on the basis of simple observations.
For example, you identified that there is a bullish trend in the market (POC of the latest session is above the POC of the previous session). Then:
- the pending BUY STOP orders could be posted on M15-H1 time-frame on the nearest 3 fractals, which are above the price, with the idea to trade the ‘fractal breakout’;
- the posted BUY LIMIT orders could be posted on the nearest 2 fractals, which are below the price (‘bounce from the fractal’).
Then you should control the risks. Select such a size of the lot, so that the losses wouldn’t exceed 1-2% of your deposit even if several orders are knocked out and the resulting price movement is against you.
You can close all trades at the end of the American session regardless of the result.
This approach is more level-headed since you may spend not more than 10 minutes a day for analysis and order posting.
Active approach in trading with fractals
Identify the trend (in which direction the volume moves) and trade during the day only in the direction of the trend.
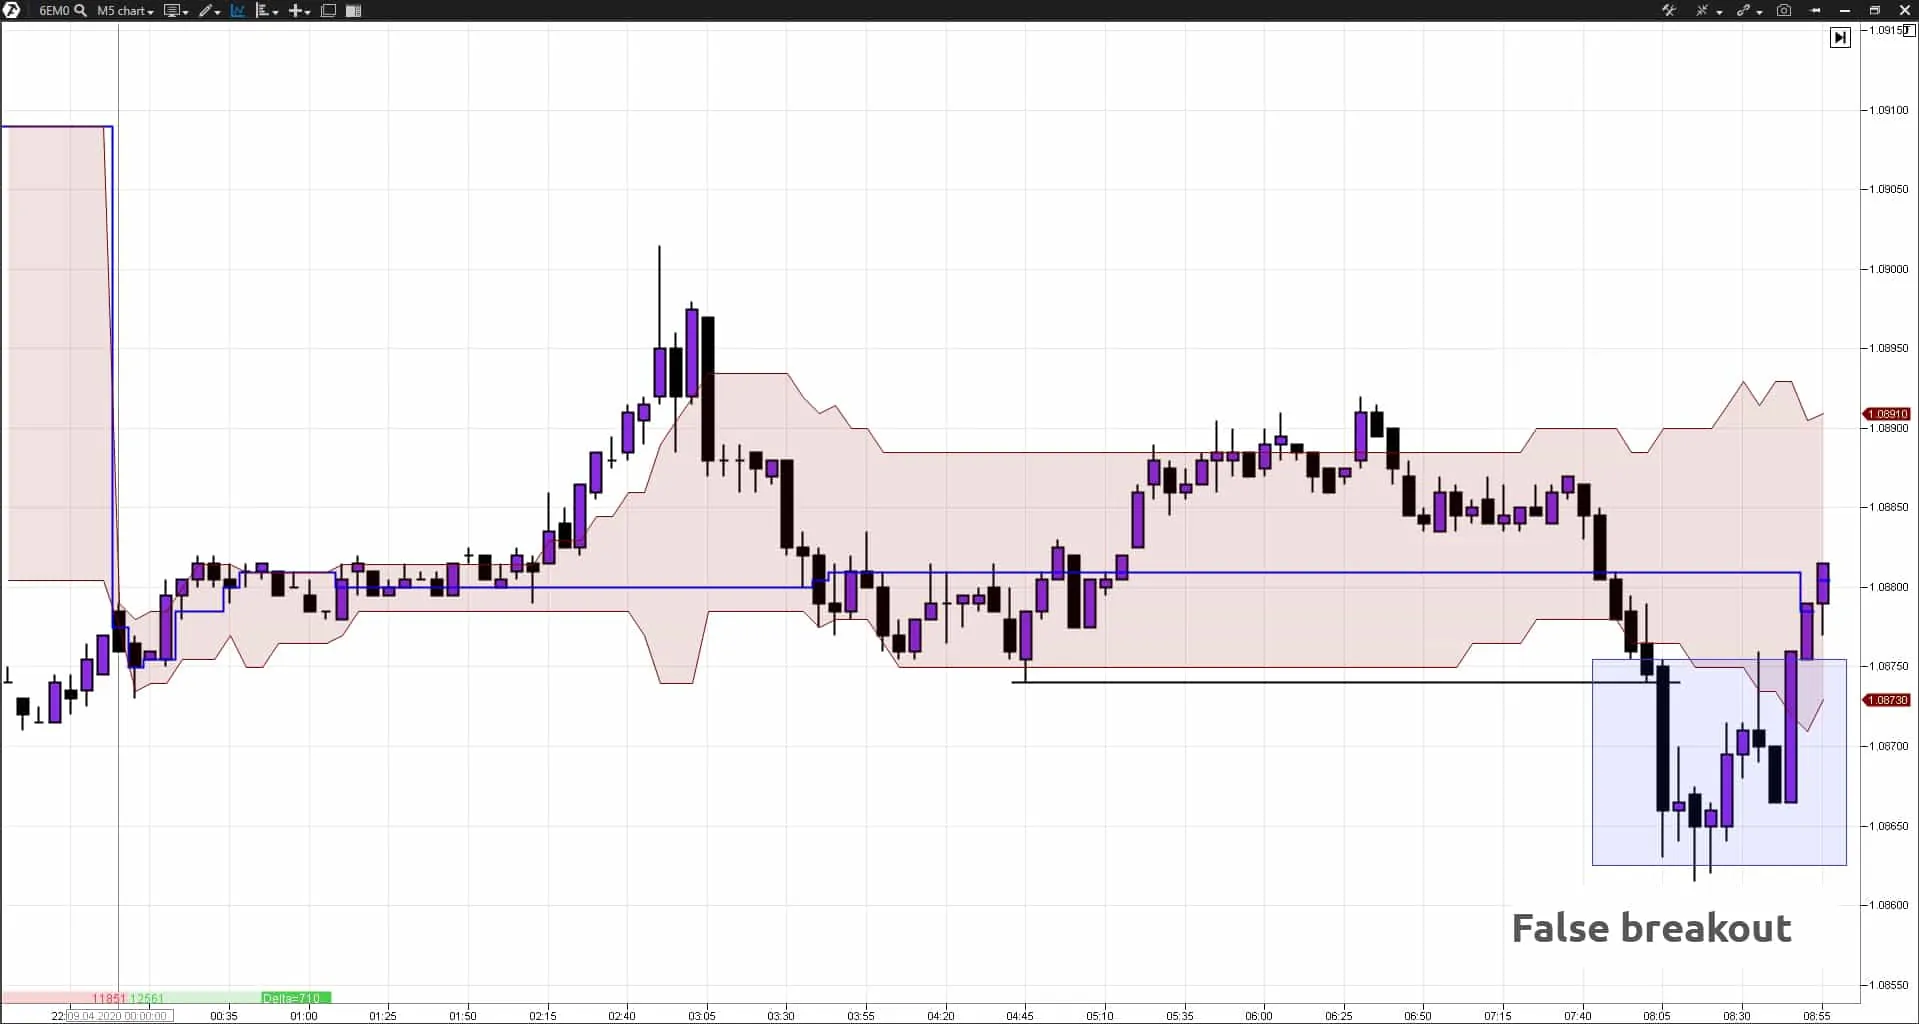
Set the Dynamic Levels indicator, which shows the POC level (the maximum volume during the day) in dynamics during the day and Value Area (areas of accumulation of 70% of volume during the day). This indicator could be a good filter for your trades.
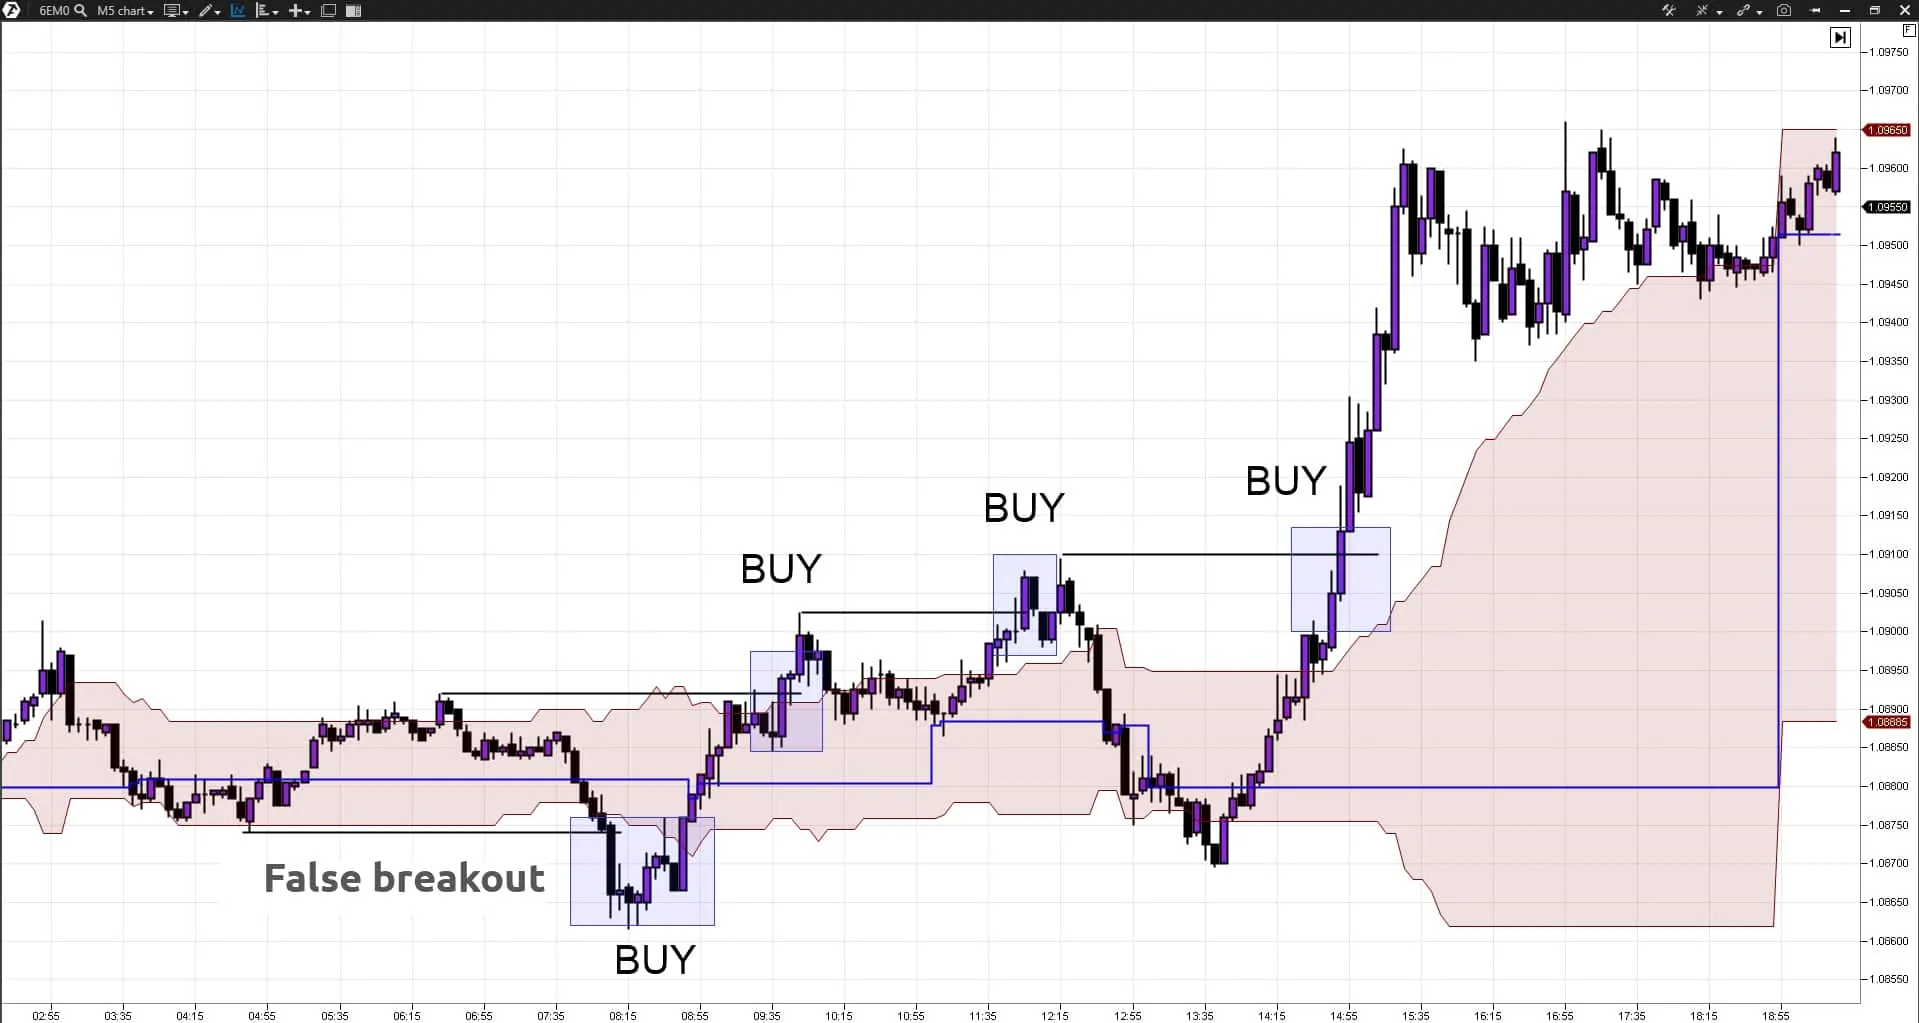
If there is an uptrend in the market and the price broke the down fractal during the day, leaving the Value Area and coming back to it, most probably, it was a false breakout and the up movement would continue.
Chart example:
If there is an uptrend in the market and the price broke the up fractal during the day, leaving the Value Area, most probably, the up movement would continue.
Chart example:
Control the risks correctly selecting the position size.
You can close all trades at the end of the American session regardless of the result.
This trading type would allow you to execute trades more accurately but would require to spend more time during the day.
Conclusions
The surrounding world is nonlinear and fractal. The markets, as a part of the living nature, are also nonlinear and fractal as a reflection of the human brain activity. Markets are an ‘alive’ developing organism, which is very difficult to describe with the help of simple formulas and geometric figures.
What doesn’t work properly in the ‘living markets’:
- indicator analysis;
- chart analysis.
What works properly in the ‘living markets’:
- volume analysis;
- cluster analysis;
- footprint.
What doesn’t work properly in the nonlinear market in the long run:
- systems with a strict set of rules;
- systems with a tick-fixed stops and takes;
- systems that do not take into account the changing market volatility;
- systems that are built on historic analysis without consideration of the current state of the market.
What works properly in the nonlinear market in the long run:
- adaptive systems that are able to adapt to various phases of economic cycles and, consequently, various dynamics of the financial instrument movement;
- systems that control risks with consideration of the changing volatility of markets;
- systems that analyze the market state, including on the basis of volume analysis.
So, fractals are an important instrument for trading nonlinear markets. You will be able to trade more consistently if you combine fractals with the volume analysis. Best of luck!

