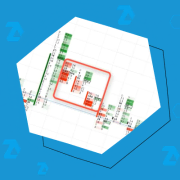
Practice of footprint analysis.

Practice of footprint analysis. Patterns in the ATAS platform

This article is a practical instruction for those who studies the market analysis with the help of such concepts as volume, clusters, footprint and delta. This method of analysis focuses on real powers that influence the price – efforts of buyers and sellers.

Trading patterns and clusters for M5

Searching candles patterns and clusters at M5 chart

Forex beginner traders tend to practice their initial knowledge opening small timeframe positions. Moreover, they usually use simple patterns, which use forex candles. This happens because: small timeframes, such as 5-minute ones, exclude long waiting. They allow immediate feeling of a faster heart beating when they see profit or loss fluctuations; forex patterns, built on […]

How the order book works.

How the order book works. A BitMEX example with explanations

In this article we will speak about a very interesting subject – interaction between the Time and Sales Tape and market depth (order book). To do that we will use an example of the XBTUSD cryptocurrency pair behavior in the ATAS Crypto platform. A highly volatile XBTUSD futures is traded on the Bitmex exchange and […]

End of Rising Market и Bag Holding

VSA and cluster analysis. The End of Rising Market

This is the first article in the series of publications in the Orderflowtrading blog on the VSA and cluster analysis topic. What is VSA? VSA – Volume Spread Analysis – is a universal approach to assessment of the strength and weakness of the market on the basis of analysis of the price and volume action. […]

Индикатор OI Analyzer. Ищем входы с низким риском

OI Analyzer Indicator. Look for low risk entries

The goal of this article is to consider such a statistical parameter of the Moscow Exchange for assessment of the forward market instruments as Open Interest and also to learn how to build own trading patterns on the basis of real-life facts with the help of the OI Analyzer Indicator.

Dynamic Levels

Using the Dynamic Levels Indicator for intraday trading

What indicators do you use to enter a trade? After reading this, in practical terms, valuable article, you will add the Dynamic Levels Indicator, a unique development of the Orderflowtrading team, to your list of useful indicators. We will show you how to increase probability of profit in the financial market with the help of […]

HOW TO USE A HORIZONTAL VOLUME

How to use a horizontal volume and raise trading profitability

What is a difference between a sportsman and a trader? A sportsman asks why volumes decrease and weight stays the same. And a trader asks why volumes decrease and price stays the same. This article contains all information required for understanding what a horizontal volume is and how it should be used for raising trading […]

Как найти и торговать имбаланс

How to find and trade imbalance. Part 2

In the first part of this article we considered mostly introductory information about imbalances: what imbalances on the exchange are, how they are formed, what they are for, how to get and set them and the basic principles of use.

Aggressive trading. Up-Thrust Pattern

Aggressive trading. Up-Thrust Pattern

Aggressive trades are moments of splashes of volatility, when the Time and Sales Tape shows a series of major buys and sells. These actions testify to activity of major exchange players. But what do they do? How to act in a harmony with professionals?