Lifehacks and flat trading strategies
Flat on the exchange is a widespread phenomenon and is characterised by small market volatility. It is believed that more than a half of its time the price stays in flat, because the trend stages develop faster than flat stages.
We will speak in this article about:
- what flat is;
- how to trade it;
- why it is formed.
We will show you examples of trading in flat with the use of progressive indicators of the trading and analytical ATAS platform.
What flat is?
Flat in the exchange trading is a market state when the price neither grows nor falls. There is no clear definition of flat and, actually, it cannot exist. Information is different in different sources. When more sensitive indicators and systems show that the market enters into a trend, the others, more conservative ones, may show that flat hasn’t ended yet.
For the point of view of wave analysis, flat is a plain retracement. Sometimes, consolidation and retracement are set equal to flat, but, technically, there are differences. As a rule, consolidation takes place after the trend movement. In other words, the prices ‘take rest’ and ‘retrace’ from the overbought or oversold area during consolidation. Some traders close old positions and some traders open new positions. Consolidation could develop in a flat state.
Flat movements may take place in the stock market during several days, weeks, months and even years. If the stock is traded near some price during the whole previous month, it means that the price is in flat.
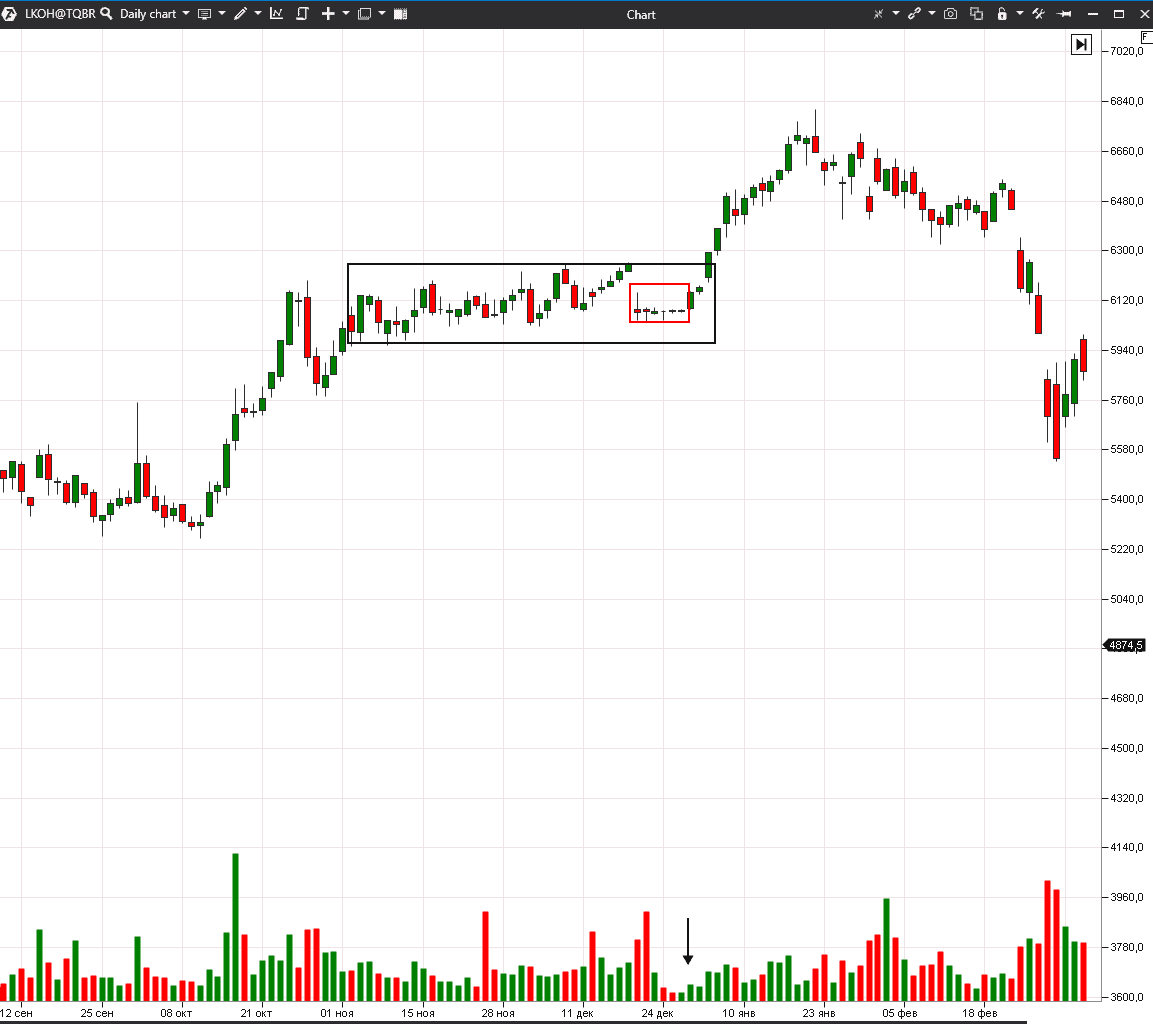
We marked two consolidation periods with black and red rectangles. Trading volumes in the red rectangle are minimal for the whole period, which is shown in the chart, but this could be connected not only with consolidation but also with the end of the calendar year and holidays.
One more definition of flat from the Active Trader magazine: flat is a period of time when the price is located between the nearest extreme points.
How to determine flat
Flat is a period of certain standstill in the market. You could determine its time visually or with the help of technical or volume analysis instruments.
Technical analysis indicators and oscillators, such as VWAP, MA, BB, Stochastic and RSI, will help you to identify flat movement in the market.
VWAP and Moving Average look like a smooth horizontal line when they are in flat. Stochastic and RSI oscillator values are in the middle and far from extreme points.
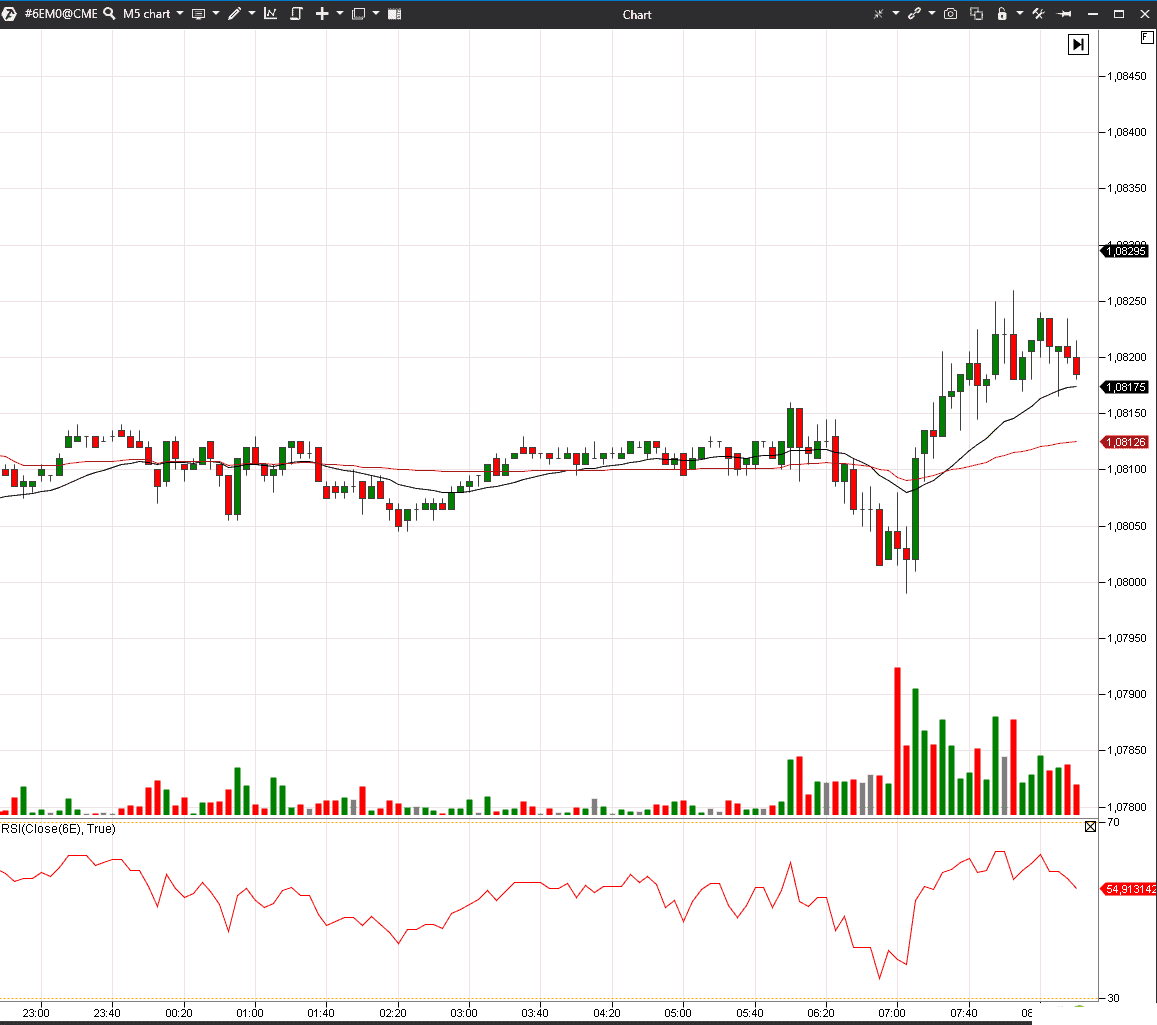
Let’s consider an example in the 5-minute EUR futures (6E) chart. We added the VWAP, SMA (22) and RSI (22) indicators to the chart. To make lines smoother, we selected a rather long averaging period – 22.
The VWAP indicator (the deep red line in the chart) shows absence of focused movement best of all. When the indicator resembles a horizontal line and prices are traded near it, it is not reasonable to open trades.
RSI is a red line in the lower part of the chart and it shows small splashes of activity, however, the values are very far from the extreme points.
SMA is a black line in the chart and its shape is also close to a horizontal line and the prices cannot consolidate consistently above or below the indicator.
Flat and market profile
Flat could also be identified with the help of Market Profile. Steidlmayer, the author of the ‘Market Profile’ concept, believed that the market stays in two main states – trend and balanced. Any trend starts after the prices stay in the balance area for some time. The reason for flat could be explained namely from this point of view – it is a state when the demand volume (buyers) stay in balance with the supply volume (sellers) and the current quotation is close to the fair one – then the market calms down being in balance.
Nevertheless, it is not correct to equal any balance to flat movement, however, the bell-shaped profile could be a sign of flat.
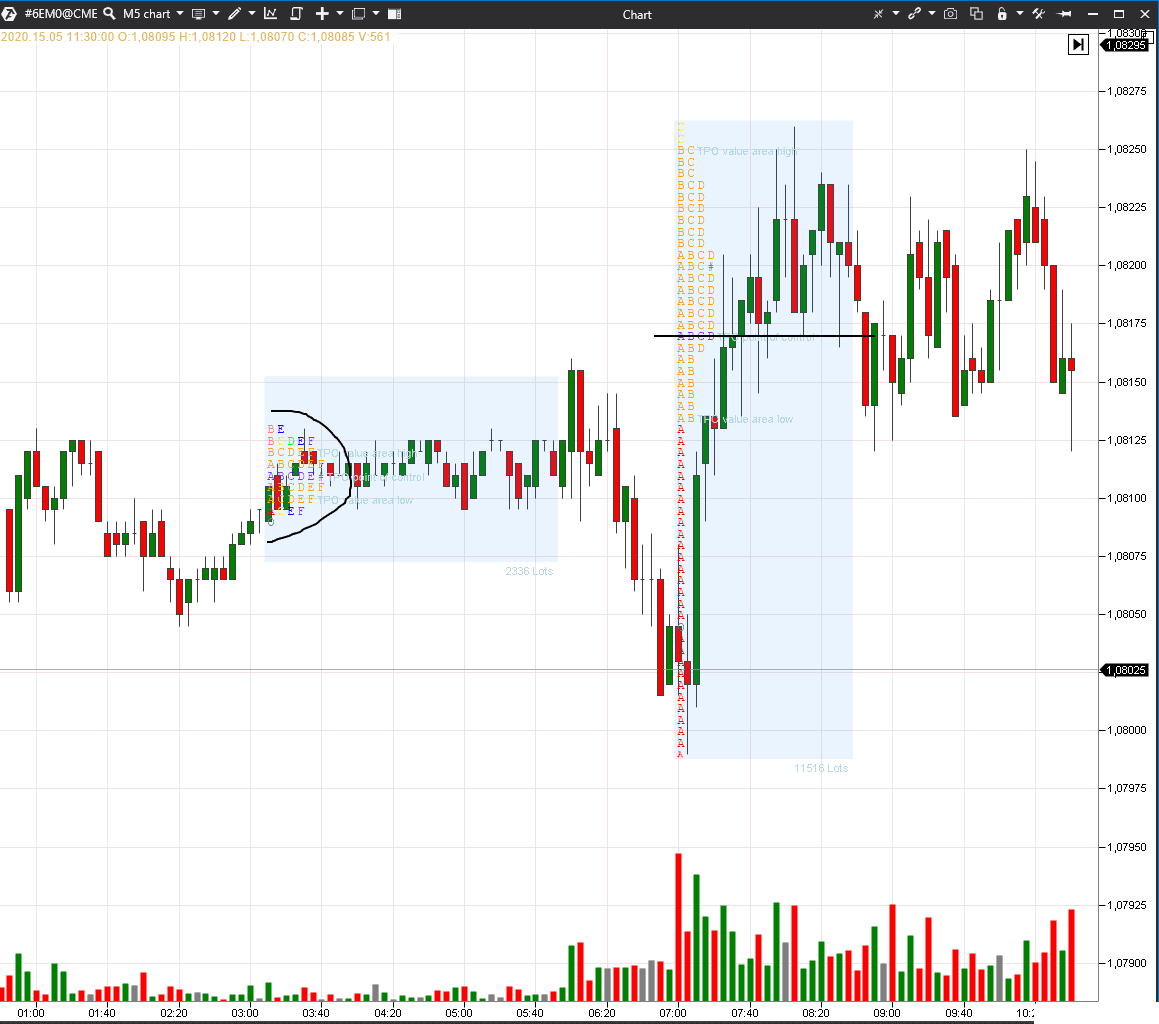
Example. Let’s add the TPO and Profile indicators to the 5-minute EUR futures (6E) chart.
We will set the display in the form of TPO for better visual effect. The first profile is bell-shaped and marked with a black arc, the second profile is prolonged and unsymmetric. We marked the maximum volume level of the second profile (POC) with a black line to underline that a bigger volume was traded in the upper part.
The balanced, compressed and symmetric profile appears in the consolidation areas. The prolonged and broken profile appears in the event of trend movement.
How to trade flat
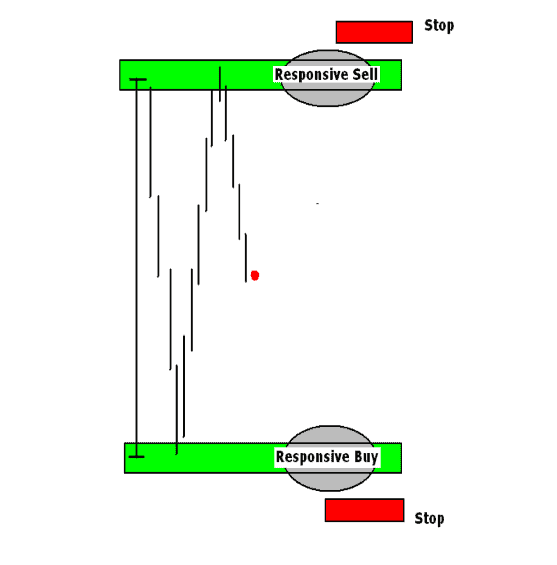
Initiative or responsive trades could be opened in flat in exchange trading. In responsive trades, traders sell from the range’s high and buy at the range’s low. The middle of the range could be an interim profit target. The next picture shows a scheme of responsive trades from Tom Alexander’s book.
The profit and loss sizes could be calculated beforehand in responsive trades. Such trades could be opened several times within the range. It is simpler from the psychological point of view to trade responsive trades – traders buy at the low and sell at the high.
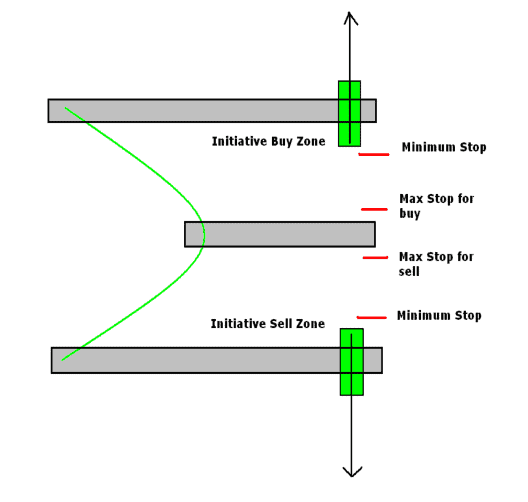
As regards initiative trades, traders trade the breakout. The next picture shows the scheme of initiative trades.
Initiative trades, as a rule, bring big profit but you may forecast its size only approximately by important levels. The breakout takes place only once. The price moves with a focus after a true breakout. Psychologically it is more difficult to trade the breakout, because traders have to buy at the high and sell at the low. The longer the flat movement lasts, the higher the probability of its breakout is.
Examples of trading flat on the exchange
Let’s consider examples of flat trading in the daily copper futures (HG) chart.
It is difficult to identify the range boundaries during trading. We may forecast that the price would slow down if we pay attention to the previous support and resistance levels. That is why we first analyse a big period in the daily chart and then we move to a more detailed analysis.
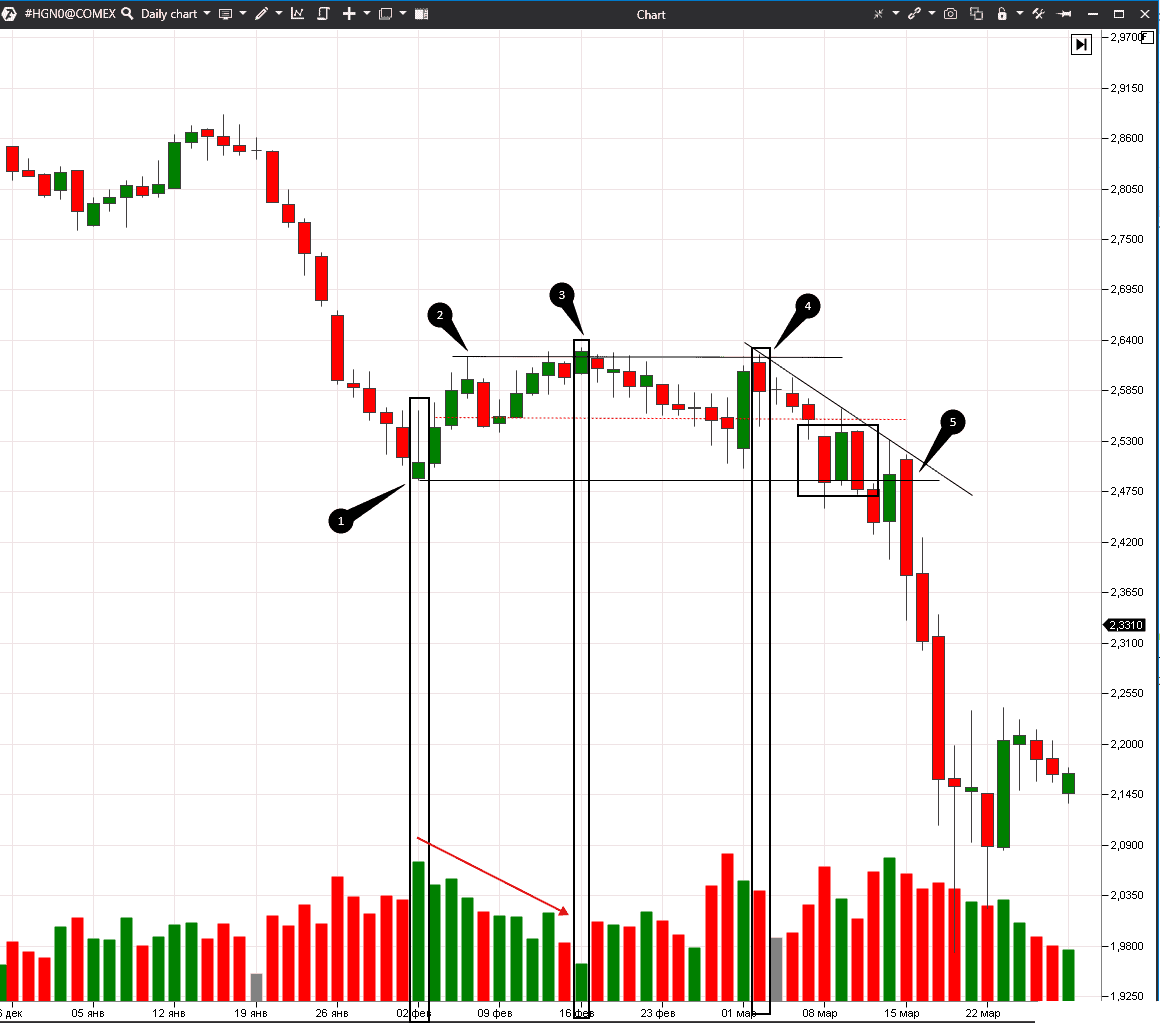
Now we will consider price consolidation from the beginning of February until the middle of March 2020 in the enlarged daily chart.
Point 1: the first green candle appeared here. Many traders saw this level because the price already moved down here in August-September 2019. The big volume in this candle means that not only sells but also buys took place here. Perhaps, traders registered profit.
Point 2: the local high is formed here. This level is also clearly seen in the chart – the support level was here in November-December 2019. It turned into the resistance level in February-March. The price couldn’t break it 4 times and trading volumes fell.
We marked the middle of the range with the red dotted line. In the event of flat trading, this level could be considered as an intermediate profit target.
Point 3: the candle is green but it is the smallest volume in the range – there are no buyers. If there are no buyers, it means that the prices, most probably, would go down.
Point 4: the price attacks the range’s high once again but the volume here is less than in three previous bars and the candle closes lower.
Point 5: a breakout takes place here after the prices consolidated near the low during several days, which are marked with a black rectangle.
As we already marked above, trades could be opened for the range breakout during flat movement or it is also possible to trade within the range. In our example, traders could have traded from the upper boundary to the middle after formation of the range’s high and low. Taking into account the global market situation, it was very risky to buy, because industrial enterprises stopped production all over the world due to coronavirus.
However, the breakout trade would have brought the biggest profit in flat trading. However, we should have waited for a month and a half for such a trade.
Summary
The market is in flat movement more often than in the trend one, that is why you shouldn’t ignore flat trading. It brings less profit, but, as a rule, it is easier to execute such trades. Indicators of the trading and analytical ATAS platform will help you to trade on the exchange both during flat and the state of trend. Download the free version of ATAS and try its power.
Do not miss the next article on our blog. Subscribe to our YouTube channel, follow us on Facebook, Instagram, Telegram or X, where we publish the latest ATAS news. Share life hacks and seek advice from other traders in the Telegram group @ATAS_Discussions.
Information in this article cannot be perceived as a call for investing or buying/selling of any asset on the exchange. All situations, discussed in the article, are provided with the purpose of getting acquainted with the functionality and advantages of the ATAS platform.

