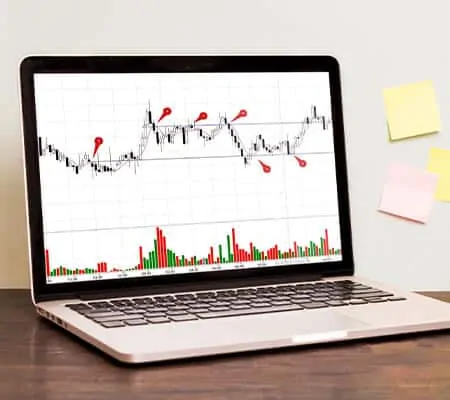

We start a series of articles about technical indicators. In this article, we will tell you about Bollinger Bands. They are better known as the Bollinger Bands indicator or just BBands.

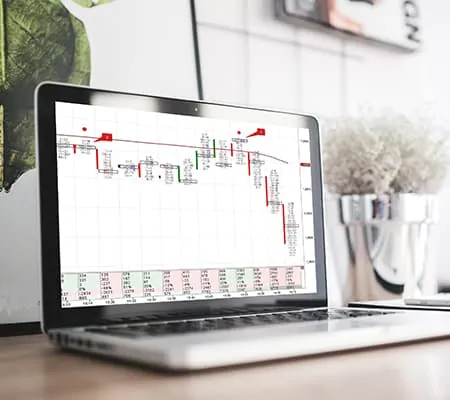
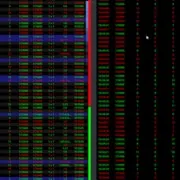
Footprint charts appeared about 20 years ago, however, there’s still little information on this trading subject on the Internet. And there are no printed books at all, although Footprint is an efficient and modern instrument. ATAS has 25 variants of cluster charts. They show the number of bids and asks, number of seconds and trades […]
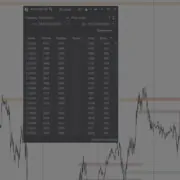
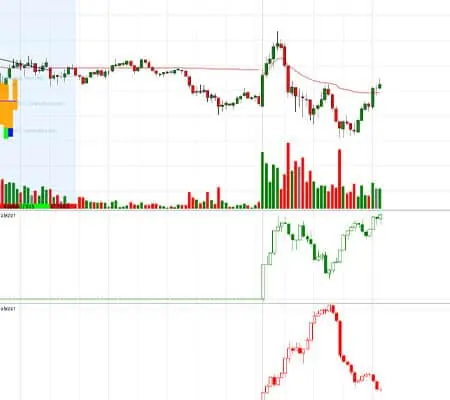
ATAS has 14 chart types – from standard time charts to tailor made range charts. We will speak about Reversal Charts in this article.