

Volume indicators are among the most advanced groups of analytical tools in trading. Unlike traditional indicators, they use data beyond just price action, offering a different dimension of market analysis. Volume reveals the actual activity of market participants, showing how many assets were bought and sold over a given period.
This type of analysis helps traders better understand market movements and, most importantly, identify the true reasons behind price changes. In the highly competitive world of trading, this insight provides a real advantage.
In this article, we will focus on using volume indicators for stock market trading, specifically for trading stock index futures. However, these tools are just as effective in any other liquid market.
All the indicators covered in this guide are available in ATAS—the #1 platform for professional volume analysis.
Read more:
Basic Guidelines for Using Volume
Why does the price of any asset (stocks, cryptocurrencies, or commodities) fluctuate? It happens because of the law of supply and demand. When there are more buyers than sellers, the price goes up; when sellers outweigh buyers, the price drops.
Example. A classic supply and demand chart shows two intersecting curves: demand (D) and supply (S). Their intersection marks the equilibrium point (E) and the equilibrium price—a concept familiar to anyone who studied basic economics in high school.
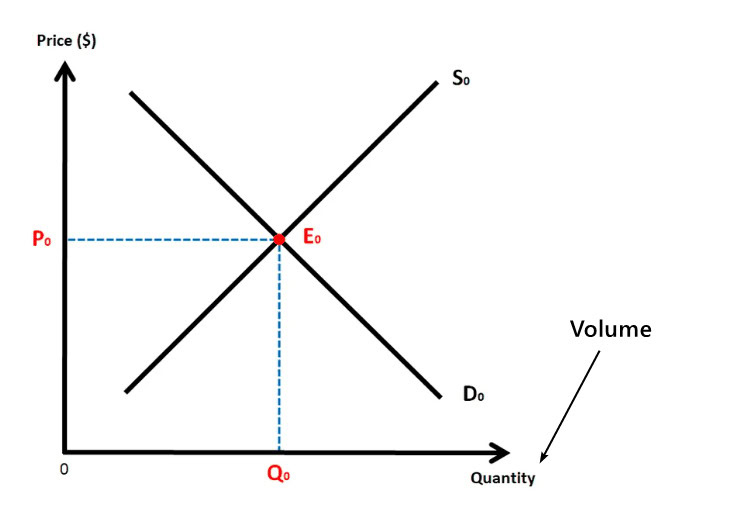
Look at the horizontal axis (Q, quantity)—this represents volume.
To put it simply:
✓ In theory, supply and demand analysis is always tied to trading volumes.
✓ In practice, modern volume indicators enable traders to track how trading activity shifts at different price levels over time (as we will explore further).
✓ This approach helps identify shifts in the supply-demand balance and forecast the most likely price movements—using just the chart.
Learn more using our resources:
Volume History
The use of volume in trading dates back to the early 20th century. Even then, stock traders recognized its importance and began incorporating volume analysis into their strategies. One of the first to formalize this approach was Richard Wyckoff—a Wall Street legend and a pioneer in studying the relationship between price and volume.
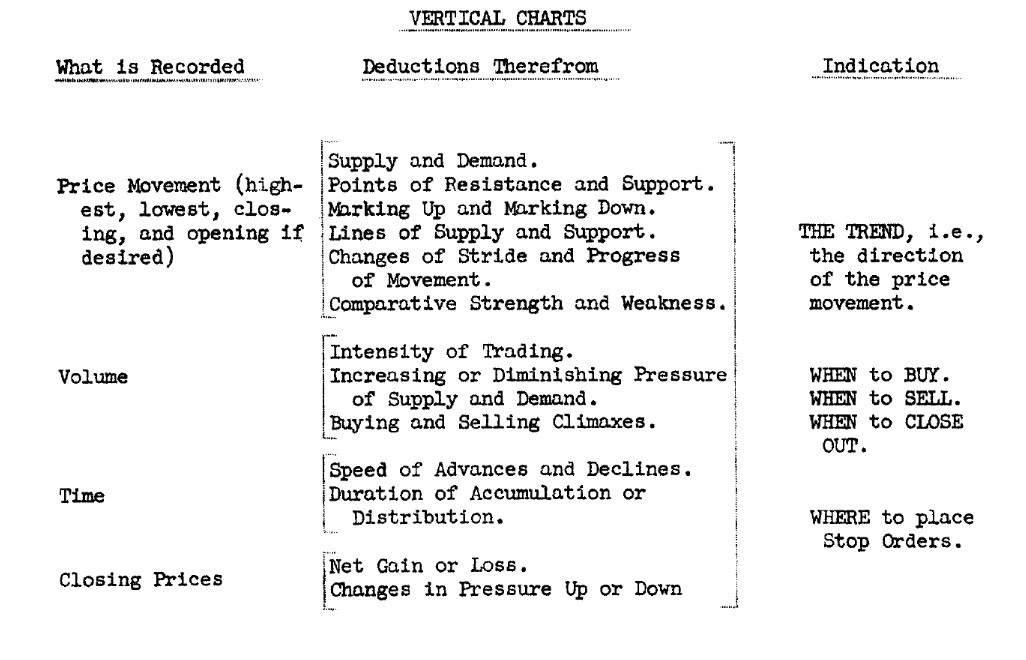
While teaching traders, Wyckoff emphasized the need to track volume data. Understanding volume helps assess trading activity, detect shifts in the supply-demand balance, and ultimately make well-informed trading decisions.
Learn more:
What Are the Most Popular Volume Indicators?
Master Volume Analysis with ATAS!
All the indicators we will cover are available on our platform. Get started right now:
✅ Download ATAS for free
✅ Install and launch the platform
✅ Open a chart and add your preferred indicator using the manager (Ctrl+I)
Start with the two most popular volume indicators:
✓ vertical;
✓ horizontal.
Vertical
The Vertical Volume Indicator, or simply Volume, appears as a bar histogram below the price chart. It shows the trading volume for each candlestick (or bar) and is a fundamental tool included by default in most trading platforms.
Example. A 5-minute chart of the E-mini Nasdaq 100 futures contract, with data provided directly by CME Group, where this futures contract is traded.
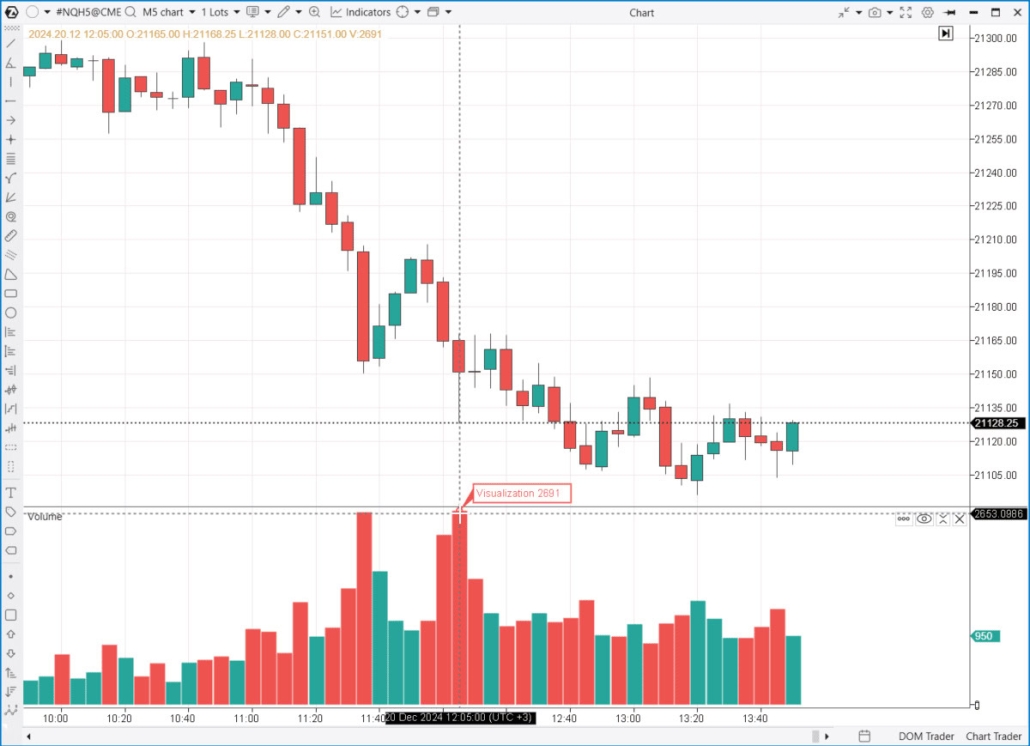
The Vertical Volume Indicator shows that 2,691 contracts were traded on the 12:05 candle.
In the Volume indicator settings, you can choose which data to display:
✓ Real volume
Learn more about using the Volume indicator in trading:
Horizontal
Horizontal volume is also displayed as a histogram, but instead of showing trading activity for each time period, it highlights trading activity at each price level over a specific period.
The use of horizontal volume and Market Profile in trading became widespread in 1985, when Peter Steidlmayer, a trader at the Chicago Mercantile Exchange (CME), introduced a new way to analyze market structure using volume. His approach was based on the idea that price tends to move around fair value, the level where the highest trading volume occurs.
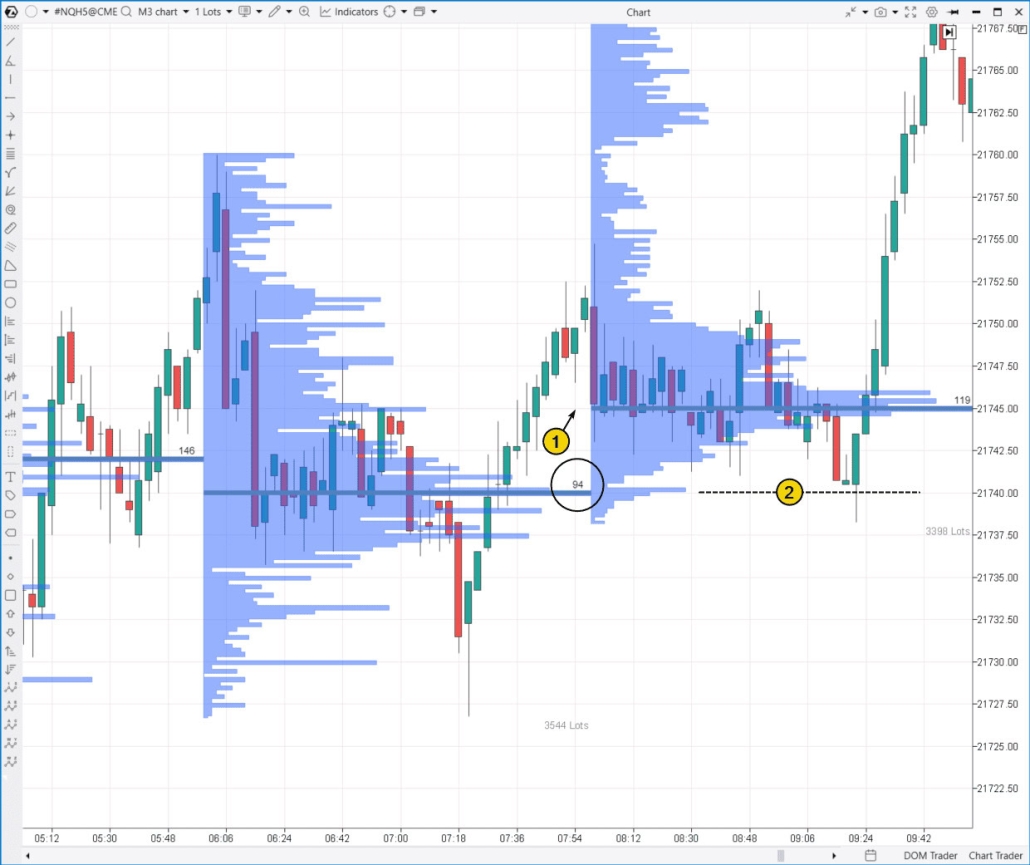
Example. The TPO and Profile indicator with a 2-hour period is applied to a 3-minute chart of E-mini NQ futures (which tracks the movement of tech stock index).
How to use the horizontal volume indicator?
Statistically speaking, the horizontal volume indicator provides insights into market activity, such as:
- a circled price level shows that 94 contracts were bought/sold over 2 hours.
- the total number of contracts (lots) traded during this period is displayed in the lower right corner of the indicator.
From an analytical standpoint, the horizontal volume indicator offers key insights into market sentiment shifts. In this example:
- Supply and demand remained balanced within the 21737-21741 range for a period, (as indicated by the bulge in the profile). A breakout to the upside followed (marked as 1).
- The previous balance zone then acted as support (2).
Learn more about analyzing charts with horizontal volume indicators:
- What Is Volume Profile Indicator?
- How Does the Profile Indicator Work?
- Market Profile Trading Signals
Advanced Volume Indicators
Beyond the commonly used horizontal and vertical volume indicators, traders use advanced tools for a deeper understanding of market activity:
✓ Delta indicator, including cumulative delta;
✓ Cluster chart (footprint);
✓ VWAP indicator;
✓ Market depth indicators & heatmaps;
✓ Order flow & speed of tape indicators.
Delta
The Delta indicator shows the difference between:
- asks – trades executed by aggressive buyers;
- bids – trades executed by aggressive sellers.
A positive delta indicates strong buying pressure, while a negative delta signals seller dominance.
If you are new to bids and asks, check out our guides on market mechanics:
Example. The chart below illustrates three types of delta:
- At the bottom – classic delta for each candlestick;
- Also there – cumulative delta, which sums up delta values across all candles and resets at the end of the day;
The blue bidirectional histogram in the price area represents the TPO and Profile indicator in delta mode. Here, positive values (buying pressure) appear on the right, while negative values (selling dominance) are shown on the left.
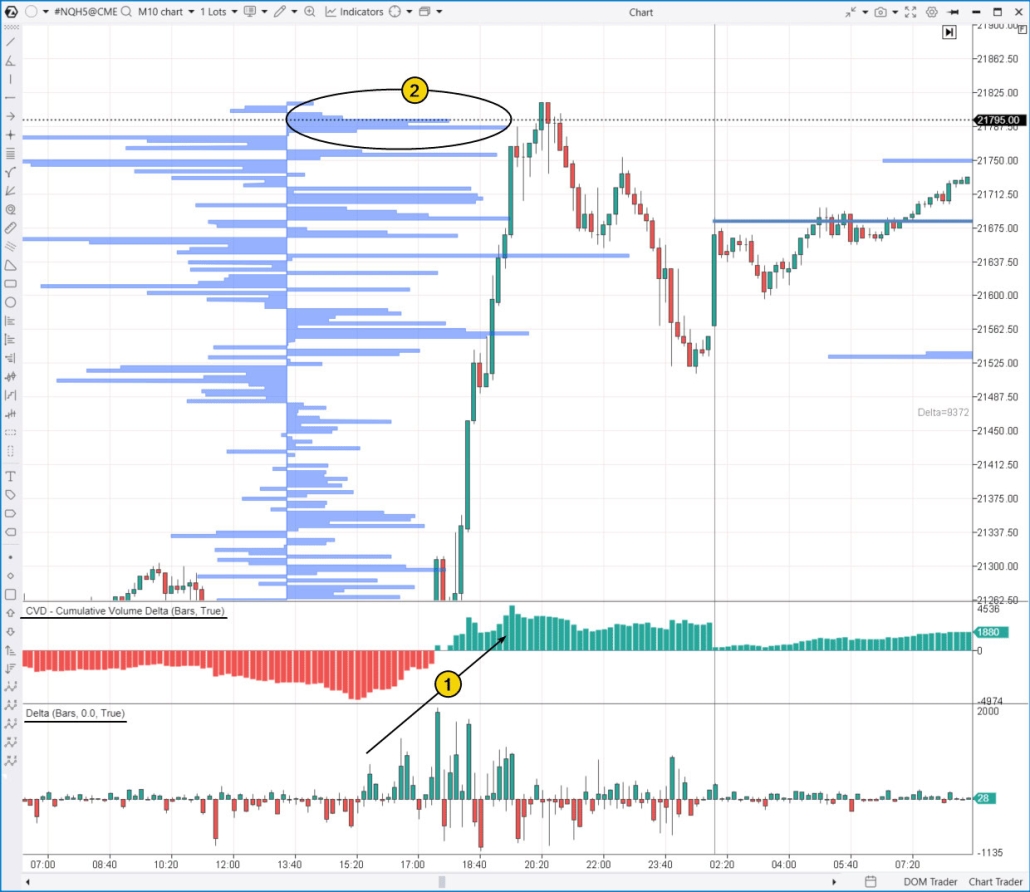
Volume indicators help tell the story of the trading day:
(1) traders started buying aggressively at market prices, fueling an intraday uptrend;
(2) late buyers got caught in a bull trap at the market’s peak.
Tip. Check out the CVD Pro (Multi) indicator—it tracks cumulative delta for traders with different capital sizes, giving you a more detailed view of market sentiment.
Learn more about using the Delta indicator for making trading decisions:
Footprint
A footprint chart (also known as a cluster chart) is not a typical indicator—it is a specialized price chart that combines horizontal and vertical volume data within each candlestick. This format provides a detailed view of volume distribution at different price levels, helping traders analyze market dynamics more effectively.
Example. A 10-minute cluster chart of the E-mini Nasdaq 100 futures:
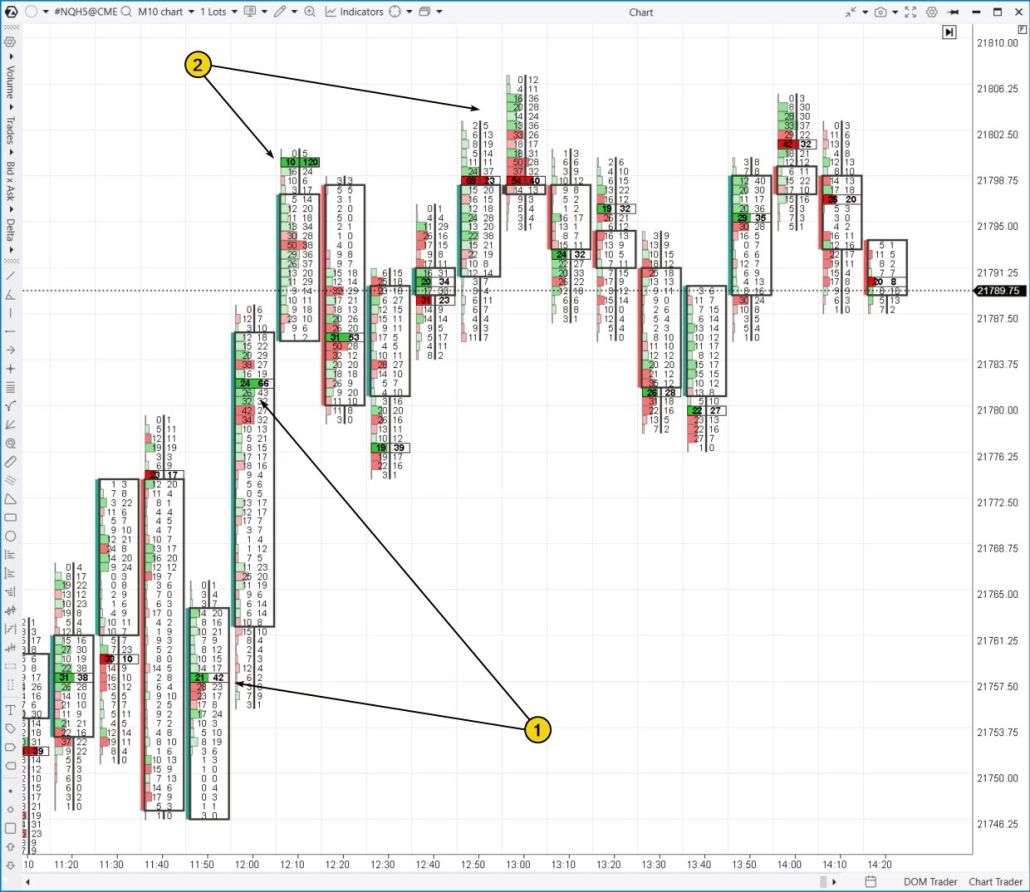
Footprint charts offer valuable insights into price action and trader behavior:
(1) Strong buyers. Market buy orders (shown in green clusters) effectively pushed prices higher. These clusters often act as support levels in the future.
(2) Weak buyers. Despite the execution of market buy orders, the price moved lower—a bearish signal.
Learn more about footprint charts:
VWAP
TWAP (Time-Weighted Average Price) and VWAP (Volume-Weighted Average Price) are two widely used indicators that help traders assess an asset’s average price over a specific period. These tools can be used to:
- Identify price deviations from the average.
- Analyze trend strength and direction (or the absence of a trend).
- Identify key support and resistance levels.
In the ATAS platform, both indicators are combined into a single VWAP/TWAP tool, making them even easier to use in trading.
Example. The screenshot below illustrates how the VWAP indicator appears on the ES (E-mini S&P 500 futures) chart.
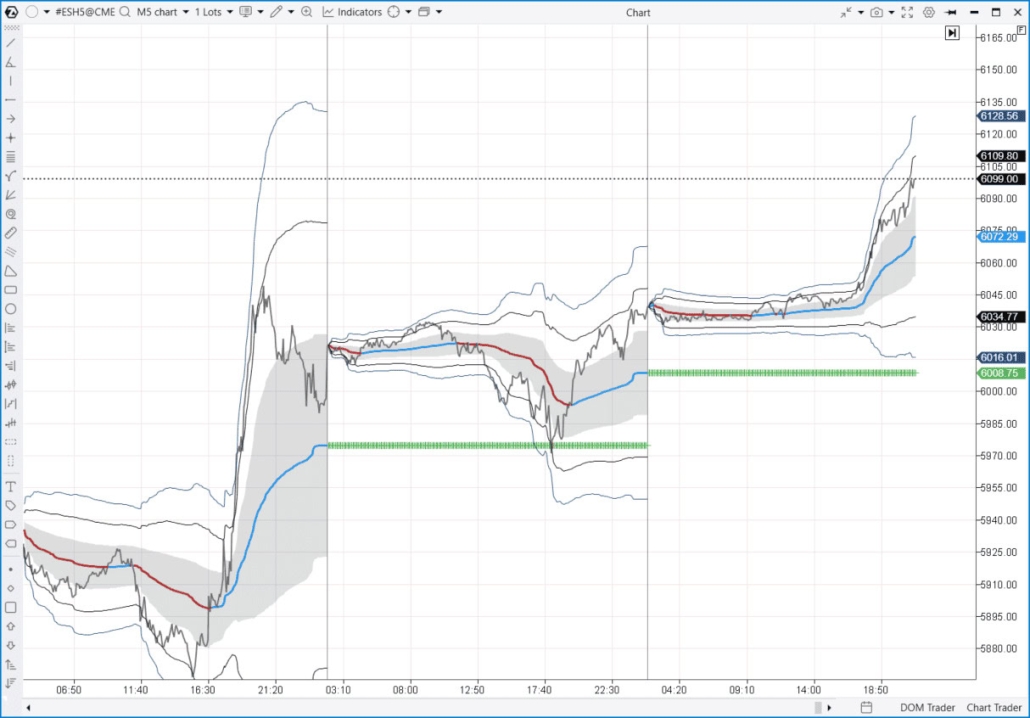
ATAS users can also customize standard deviation zones around the VWAP line, allowing for a deeper understanding of market movements and better detection of key support and resistance zones.
Learn more:
Depth of Market (DOM) and Heatmap
Depth of Market (DOM) is an indicator that displays real-time data on limit buy and sell orders placed in the order book. Traders use it to analyze liquidity and the balance between supply and demand. A live market data feed is required to use DOM.
Heatmap (DOM Levels) visualizes how limit order volumes have changed over time at different price levels. It helps traders identify patterns in price interactions with significant order levels and spot key support and resistance zones.
The example below shows how these volume indicators appear on an ES futures chart:
✓ On the right, Depth of Market is displayed as a red-green histogram. The larger the bar, the higher the total volume of limit orders at that price level.
✓ The heatmap in the price area visualizes volume changes over time. Bright “hot” colors at certain levels indicate an increase in order book volumes.
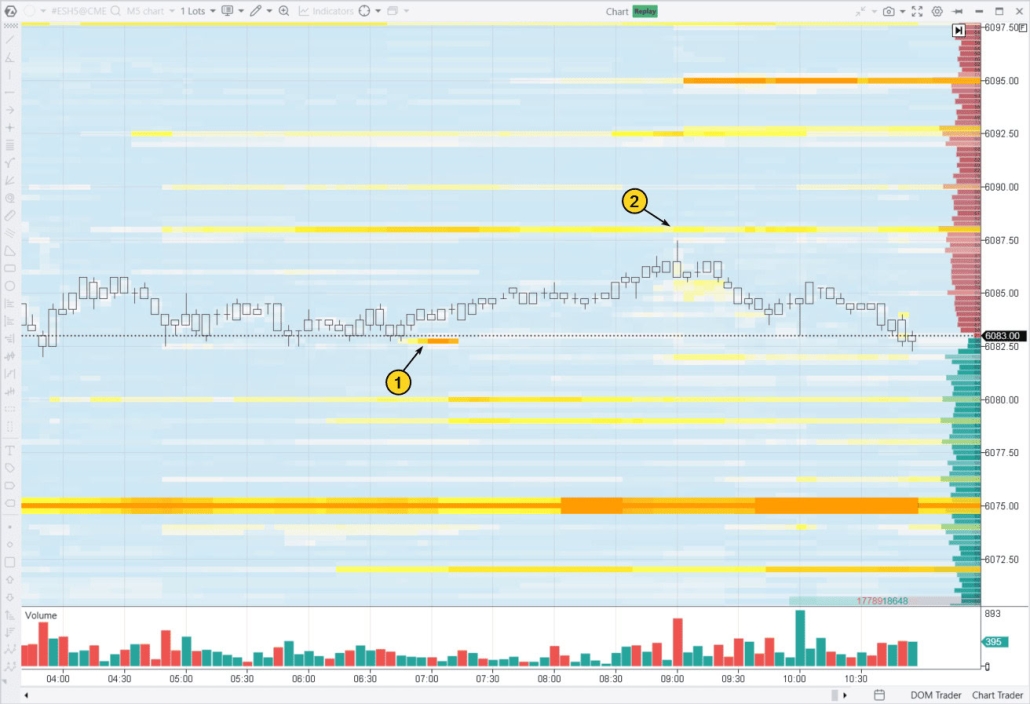
By analyzing the volume of limit orders, you can understand how liquidity in the order book influences price movement. For instance:
- the appearance of a significant volume of buy limit orders (1) gave the market a bullish push;
- after that, the price reached level (2), where there was a noticeable volume of sell limit orders. This level acted as resistance.
Tip. Take a closer look at the MBO DOM indicator, which shows the queue of limit orders at each level in the order book.
Learn more:
Order Flow and Speed of Tape Indicators
The Speed of Tape indicator shows how quickly new trades are happening.
The Order Flow indicator displays trading activity as a jagged line with circles overlaid on the candlestick chart. The size of the circles represents the volume of large trades, with green circles indicating buys and red circles showing sells.
Example. The screenshot below shows how these two volume indicators look on a 1-minute ES futures chart:
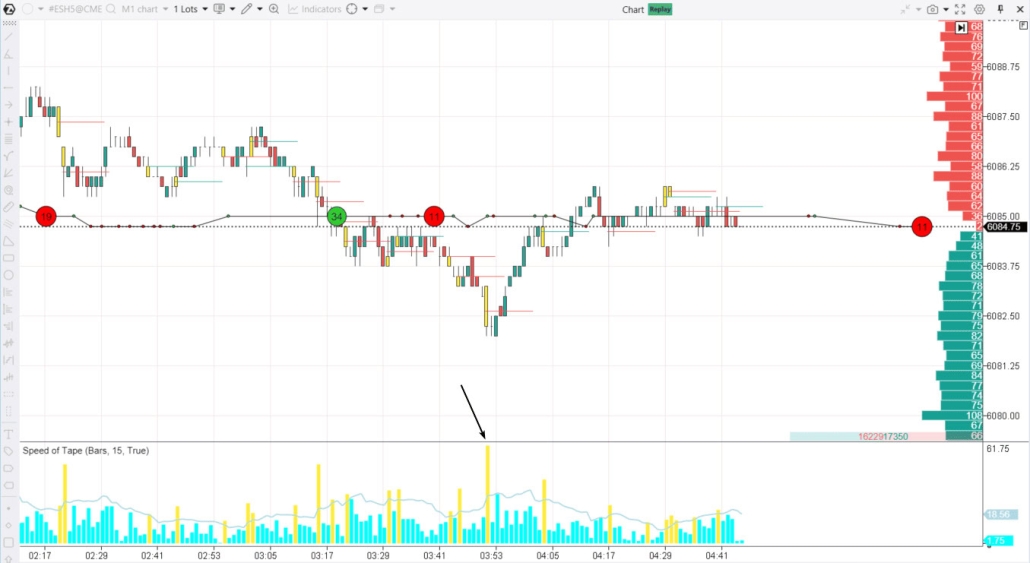
An arrow points to the acceleration of trading activity during a price reversal in the low-volatility Asian session.
Learn more:
Other Volume Indicators
The ATAS platform offers over 200 trading indicators, with volume analysis tools being some of the most valuable.
In addition to the ones mentioned earlier, you might find these indicators useful:
- Cluster Search — a volume indicator that helps locate clusters on a footprint chart that match specific criteria. For example, you can find clusters at the candle’s tail with more than 20 market-buy contracts. Learn more: here and here.
- Big trades. A volume indicator that highlights large trades on the candlestick chart, helping you analyze their impact on price. Learn more: here and here.
- Tape Patterns. This indicator analyzes the flow of trades and identifies sequences that meet specific criteria. While setting it up can be complex, it provides highly valuable insights into market activity. Learn more: here and here.
- Cluster Statistics. This indicator displays data in a table format, showing volume (including bids, asks, and delta), time, and other parameters for each candle. Learn more here.
Now, we can dive deeper into how to understand and interpret signals from these volume indicators. Before you start, we recommend downloading and installing ATAS for free. It is the best way to learn – by applying what you study to real charts of stocks, futures, and cryptocurrencies. Do not just read—practice!
What Trading Signals Can Be Provided by Volume?
Understanding volume indicators can be challenging. Their signals are not as straightforward as a simple moving average crossover. Interpreting volume requires considering market context, understanding supply and demand dynamics, and analyzing effort versus result.
Even experienced analysts, despite years of studying price and volume relationships across different assets, sometimes struggle to accurately assess the market’s current state or predict future price movements.
Example: You see a spike in volume. What does it mean? It could signal the start of a strong trend—or its end. It might also indicate that the trend is gaining momentum, especially if the price is breaking through a key level in its direction.
Does rising volume suggest institutional players stepping in, or is it just traders closing positions? If delta shows buying pressure, is it driven by large (strong market participants) or retail traders (weak participants who are often lured into traps through market manipulation)?
Traders have to find the answers to these questions on their own to understand what is behind a surge or decline in volume. Keep in mind that volume interpretation is always subjective.
To make things clearer, let’s look at two charts of popular stocks across different timeframes.
Chart 1: Apple (AAPL) on the daily timeframe.
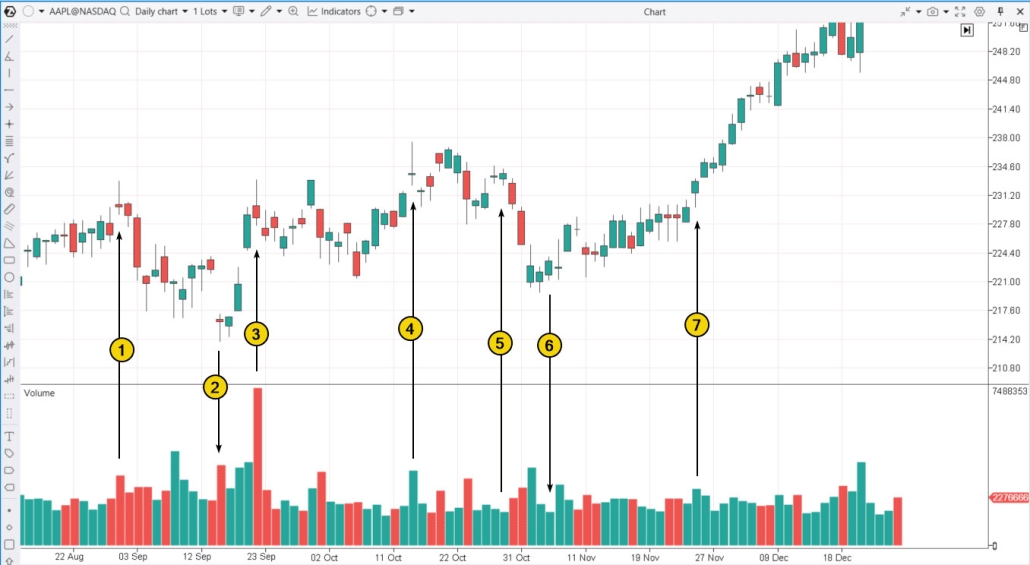
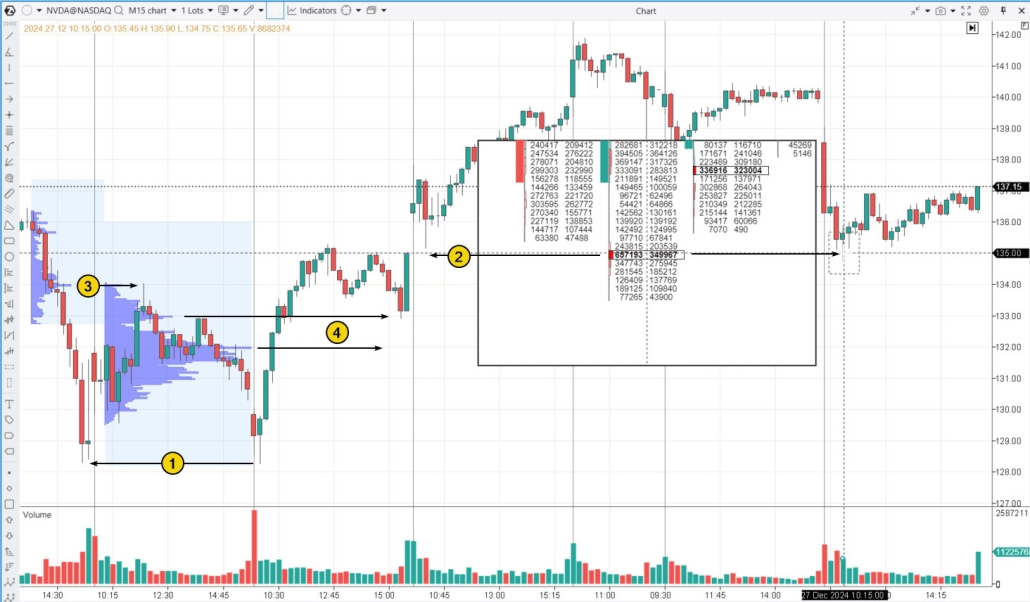
Chart 2. Nvidia (NVDA) stock on a 30-minute timeframe:
Next, we will analyze five common market scenarios and examine how volume indicators behave in each case using the charts above.
Trend Confirmation
A trend is typically confirmed by the following signals:
- Rising volume when the price moves in the direction of the main trend—for example, increased buyer activity in an uptrend;
- Declining volume when the price moves against the trend—for instance, in an uptrend, it may indicate weak selling pressure.
Example: AAPL started trading (7) on November 25 with a bullish gap, hitting its monthly high. It ended the session with a price gain and rising volume, which was a bullish sign suggesting that the long-term uptrend (spanning weeks and months) is continuing to develop.
Exhaustion Moves and Volume
A decline in vertical volumes can provide valuable insights into one side’s lack of interest at current price levels. For example:
- after a price increase, lower volumes on a bullish candle may indicate that buyers are unwilling to pay a higher price for the stock;
- a decrease in volume on a bearish candle after a downtrend could indicate that selling pressure is fading.
For a more detailed explanation of how volume indicators interact with price movements, check out the article: VSA Signals – “No Demand” and “No Supply”.
Examples: A drop in AAPL’s trading volume (5) at the end of October 2024 indicates weak demand around the $233 level. The subsequent price decline, accompanied by rising volume, confirms this interpretation.
A decrease in AAPL’s trading volume (6) in early November 2024, following several days of price decline, suggests weakening selling pressure near the $222 level. The subsequent price rebound, supported by higher volume, reinforces this view.
Bullish and Bearish Signs
Let’s have a look at how the vertical volume indicator behaves during a price uptrend (for downtrends, the opposite patterns apply):
Bullish signs:
✓ Volume rising above average → suggests strong buying activity.
It is important that:
- the candle is not narrow;
- the candle closes near the high.
Bearish signs:
✓ Volume below average during price increases → signals weak demand and a lack of buyers. Candles may form Doji patterns, showing indecision.
✓ Excessively high volume on bullish candles → could indicate a FOMO effect, where traders rush in at the peak, which might lead to a reversal.
Bullish and bearish signals on the horizontal volume indicator can be simplified into basic logic:
- Bullish signal – the price breaks above and stays above high-volume levels (POC);
- Bearish signal – the price breaks below and stays below those levels.
Examples on the NVDA chart:
The price did not manage to break through the $134 level, which acted as resistance (3). This bearish signal could have led traders to open short positions during the day.
The price climbed above the high-volume levels from the previous day (4) and held there – a bullish signal.
Volume and Price Reversals
Volume indicators often provide crucial signals about potential trend reversals, pointing to changes in price dynamics. To learn more about how volume indicators and price movements are related during such moments, check out the article: “VSA Culmination Signals.”
Examples:
- August 29, AAPL – the end of the rally (1).
- September 16, AAPL – a relatively narrow candle with a close near the top and higher volume (2) suggests that after the bearish gap, sellers became fearful and rushed to sell, but significant buying interest stepped in and prevented the price from falling further. This is a bullish signal, and the price reversed upwards afterward.
- September 20, AAPL – this situation (3) mirrors the reversal seen in the previous candle (2), but with a false breakout of the high (1).
October 15, AAPL – a narrow candle with a bullish gap and a close near the bottom on high volume (4) shows that significant selling interest is selling the stock, using a demand spike (possibly triggered by “bullish” news) and preventing the price from rising beyond the opening level.
Volume and Breakouts vs. False Breakouts
A breakout happens when the price moves beyond its previous range. It can either be a genuine signal of a strong move and a potential entry point, or a false breakout, where the price quickly returns, creating traps for bulls and bears. False breakouts are more common and often lead to sharp reversals.
You can see examples of false breakouts on the NVDA chart.
At the start of the trading session, amidst increased volatility, the price briefly dipped below the previous day’s low (1), but then closed higher, signaling a bullish outlook.
A similar situation occurred later: after another surge in volatility, the price broke below a prior day’s low (2). The ATAS Magnifier tool (press “M” to activate) helps you closely examine this moment. The candle closed above the selling level around $135, indicating a potential bear trap, which in turn is a bullish signal.
Learn more:
Volume Trading Strategies
As the examples show, analyzing volume helps traders:
✓ Assess fluctuations in market sentiment (reflected in shifts in the balance of supply and demand).
✓ Track the intentions of major market participants.
✓ Identify key levels and potential trend reversals.
Proficiency in volume indicators enables traders to develop strategies suitable for both intraday and swing trading.
Pullback Trading
This strategy is well-known among beginner traders and is based on the following principles:
- in an uptrend, enter long positions after price pullbacks;
- in a downtrend, enter short positions after temporary recoveries.
Example. The NQ futures chart demonstrates how this approach can be applied using the Range XV chart combined with the ZigZag Pro indicator, which provides volume statistics for each wave:
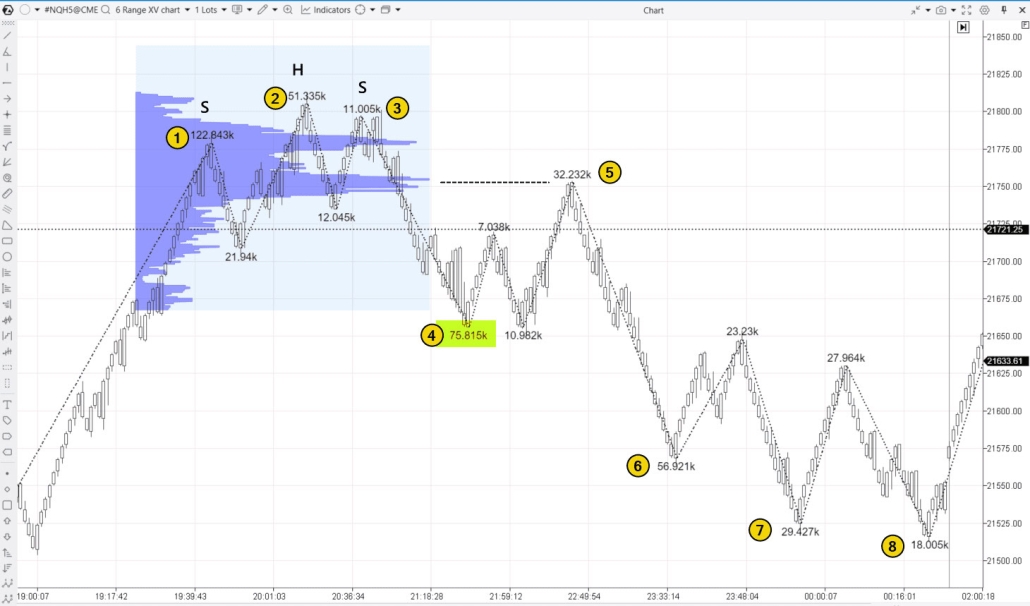
The numbers (1-2-3) highlight a steady decline in volume during upward waves, ultimately forming a Head and Shoulders (SHS) pattern—a classic sign of weakening demand. By identifying this shift in volume and price action, traders can anticipate a potential trend reversal to the downside.
Wave (4) signals incre upward waveased selling activity, as volume rises during the downward move. At this stage, it is important to wait for a temporary rebound.
This rebound occurs on the (5), reaching a high-volume level visible on the profile. The relatively low volume during this rise confirms a potential short entry with a tight stop-loss.
A potential exit signal for the short comes from the volume trends on waves (6-7-8). The gradual decline in volume suggests weakening selling pressure, which could indicate a slowdown or potential trend reversal.
Breakout Trading
Breakout trading provides an opportunity to enter strong trends, often with the potential for quick and significant gains. However, it also comes with the risk of false breakouts. Additionally, this strategy is not for everyone, as it requires quick decision-making and the ability to react swiftly to price movements.
Example. A simple triangle pattern can be an effective tool for spotting trading opportunities, as shown on the Range XV chart of Nasdaq (NQ) futures.
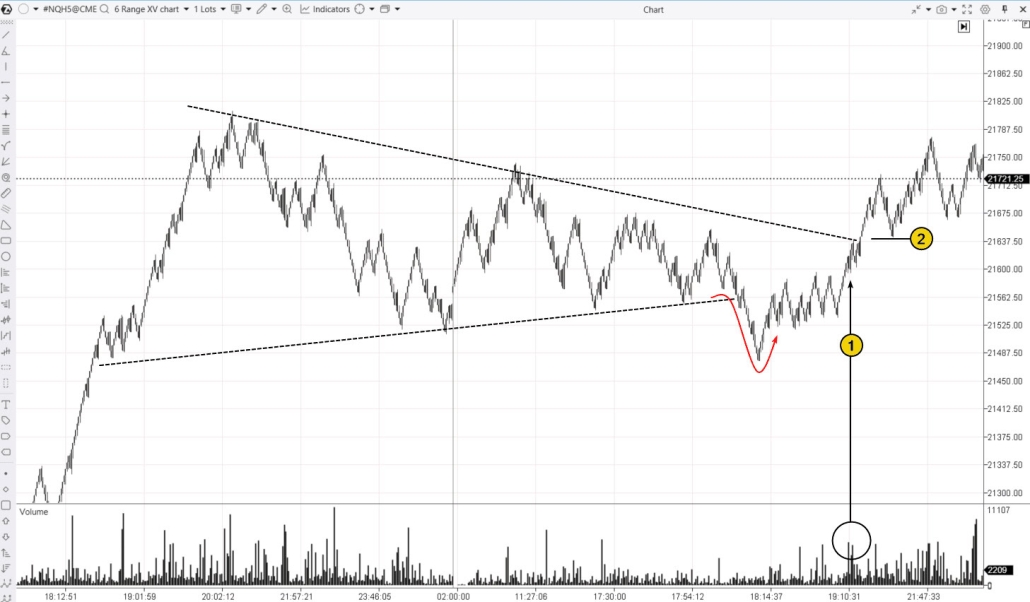
Several factors strengthen the case for a bullish breakout above the upper boundary:
- Weak selling pressure: after breaking below the lower boundary, bears failed to sustain a downtrend (marked with a red arrow).
- Rising volume on the breakout (1): an increase in volume at the breakout suggests strong buying interest, with buyers absorbing sell orders in this zone.
If buying a stock on a breakout during a price rally feels psychologically uncomfortable, a retest signal (2) of the broken level can be a good alternative for entering the trade.
Learn more:
How to Learn Trading with Volume Indicators
Volume trading is not an art that requires exceptional talent—it is a skill that can be developed. To master this approach successfully, you need analytical thinking, professional trading software, and a disciplined, persistent mindset. The ATAS platform, along with its educational resources, can help you learn how to use volume indicators effectively and achieve consistent positive results.
Step 1: Learn the basics
Download ATAS and explore key resources on volume analysis, including:
- The Duality Problem in Volume Analysis
- ATAS Indicators: Types, Functions, and Settings
- ATAS Indicators: How to Choose and Analyze Them for Better Trading
- Volume Trading Strategies
Be sure to explore the Learn tab in the main menu of the ATAS platform.
Step 2: Practice
Before trading with real money, sharpen your skills using historical data. The ATAS Market Replay simulator is an excellent tool for accelerating your learning—it helps you understand how volume behaves in different market conditions and refine your strategies.
With Market Replay, you can:
- load historical tick data for stocks, index futures, and other financial instruments;
- replay market history at different speeds and pause when needed;
- trade using the built-in Replay account and analyze your performance afterward;
- apply volume indicators mentioned in this article.
Step3. Move to Live Trading
Start with small position sizes to minimize risk.
Tips:
- Create a trading plan.
- Follow risk management rules.
- Regularly review your trades and adjust your strategy as needed.
- Increase your trade sizes gradually as you gain confidence.
By following these steps, you will develop a strong foundation in volume analysis and steadily progress from a beginner to a skilled trader.
FAQ on Volume Analysis Indicators
What is a volume indicator?
A volume indicator is a tool that tracks market activity by showing the number of contracts or shares bought and sold.
- Vertical volume represents trading activity for each candlestick, reflecting the total volume over a specific time period.
- Horizontal volume (Volume Profile) shows how volume is distributed across different price levels.
- Delta analysis reveals the balance between aggressive buyers and sellers, helping identify which side is in control.
- Cluster charts (Footprint) provide a detailed view of volume within a single candlestick.
There are also additional volume indicators (mentioned in this article) that help solve specific tasks, such as:
- Identifying large trades.
- Analyzing trade sequences and spotting patterns.
- Visualizing trading activity on the chart.
Overall, all volume indicators are designed to help traders:
- Assess the significance of price movements.
- Identify key levels of interest for major market participants.
- Understand market sentiment and the balance of power between buyers and sellers.
What is the most common time frame for measuring volume in stocks?
Volume indicators can be used effectively across all timeframes. The key is to adjust them to match your trading style and the timeframe you are analyzing.
This may involve fine-tuning both the indicator settings and the chart itself. For example, in ATAS, you can control the level of detail on the price scale using the Scale parameter.
Key points to consider:
- on higher time frames, major shifts in supply and demand become more noticeable, while lower time frames highlight smaller fluctuations;
- some volume indicators (such as Tape Patterns) are specifically designed for intraday trading (including scalping) and are not suitable for daily charts;
- market activity is not evenly distributed throughout the day. Volume tends to spike at the market open and close, often leading to extreme indicator readings. It is important to account for these surges to avoid mistaking them for typical market behavior and to interpret volume signals correctly.
What is the best volume indicator for day trading?
There is no one-size-fits-all answer when it comes to volume indicators. The best tools for day trading are those that provide the most detailed real-time insights into market activity.
Here are some top choices:
- Classic vertical volume with delta breakdown. Positive delta indicates buyers are in control during a candle’s formation, while negative delta signals seller dominance.
- Volume profile shows how volume is distributed across different price levels. In ATAS, you can select any section of the chart to build a custom profile.
- Cluster volume (Footprint charts) reveals volume distribution within a single candle, highlighting where significant trades took place.
For the best results in intraday trading, it is often useful to combine multiple indicators and enhance them with tools like Cluster Search, Big Trades, DOM Levels, and other advanced features. Traditional indicators like On-Balance Volume (OBV), Chaikin Money Flow, and Klinger Oscillator may not always meet your expectations.
Conclusion
A volume indicator is more than just a histogram below the price chart—it is a powerful tool for analyzing trading activity based on:
- Time – how volume is distributed across different periods.
- Price levels – where the most significant trading activity is concentrated.
- Trade direction – whether trades were primarily market buys or market sells.
These factors provide deeper insights into market dynamics and help identify key areas of interest for major players.
Volume analysis is a crucial part of successful trading and an essential tool for making well-informed decisions. We hope this article has helped you gain a clearer understanding of the topic and see how professional volume indicators can give you a real edge in navigating dynamic markets.
Download ATAS. Once you install the platform, you will automatically get the free START plan, which includes cryptocurrency trading and basic features. You can use this plan for as long as you like before deciding to upgrade to a more advanced plan for additional ATAS tools. You can also activate the Free Trial at any time, giving you 14 days of full access to all the platform’s features. This trial allows you to explore the benefits of higher-tier plans and make a well-informed purchasing decision.
Do not miss the next article on our blog. Subscribe to our YouTube channel, follow us on Facebook, Instagram, Telegram or X, where we publish the latest ATAS news. Share life hacks and seek advice from other traders in the Telegram group @ATAS_Discussions or on Discord.
Information in this article cannot be perceived as a call for investing or buying/selling of any asset on the exchange. All situations, discussed in the article, are provided with the purpose of getting acquainted with the functionality and advantages of the ATAS platform.


