How to conjoin analysis of three market dimensions?
Financial markets exist in 3 dimensions – price, time and volume.
If a trader/investor doesn’t take into account all 3 dimensions (for example, ignoring the volume dynamics analysis), it could lead to negative consequences, since the conclusions would not be sufficiently justified.
In other words, if you trade on the exchange and do not take into account all market dimensions, it is like driving a car, the steering wheel of which could be turned one way only. You cannot drive far in such a car.
- How to conduct a full-fledged market analysis, taking into account the data of all dimensions?
- Techniques of analysis of each dimension separately; their advantages and disadvantages.
- How to ‘complete the puzzle’ and combine information about the price, time and volume of trades in one picture?
This is what this article is about.
Price. The first market dimension
The price of any exchange instrument is the first and main thing to which attention is paid. The current price reflects a consensus between sellers and buyers.
Is it possible to make forecasts and execute trades only on the basis of the price dynamics? There is no simple answer to this question. However, we are sure that the more trustworthy information is taken into account, the more justified conclusions we make.
For the past centuries, mankind invented a lot of the exchange price behaviour analysis methods. Here are just some of them:
- candlestick analysis;
- chart analysis;
- indicator analysis.
Let’s consider each of them in brief.
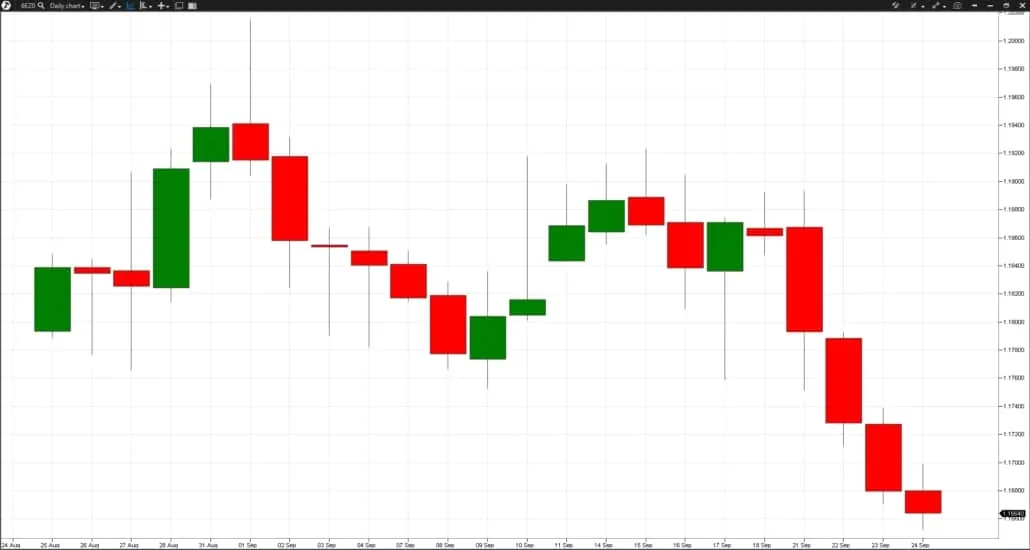
Japanese candles. This is one of the first methods of price analysis. This method presents the price dynamics in the form of Japanese candles. Then these candles are analysed, candle patterns are identified and forecasts are made.
Advantages of Japanese candles:
- visual clarity of presentation of the exchange price movement;
- possibility to analyse the psychological state of the market participants.
Disadvantages:
- some subjectivism in analysis of candlestick patterns;
- low efficiency of patterns.
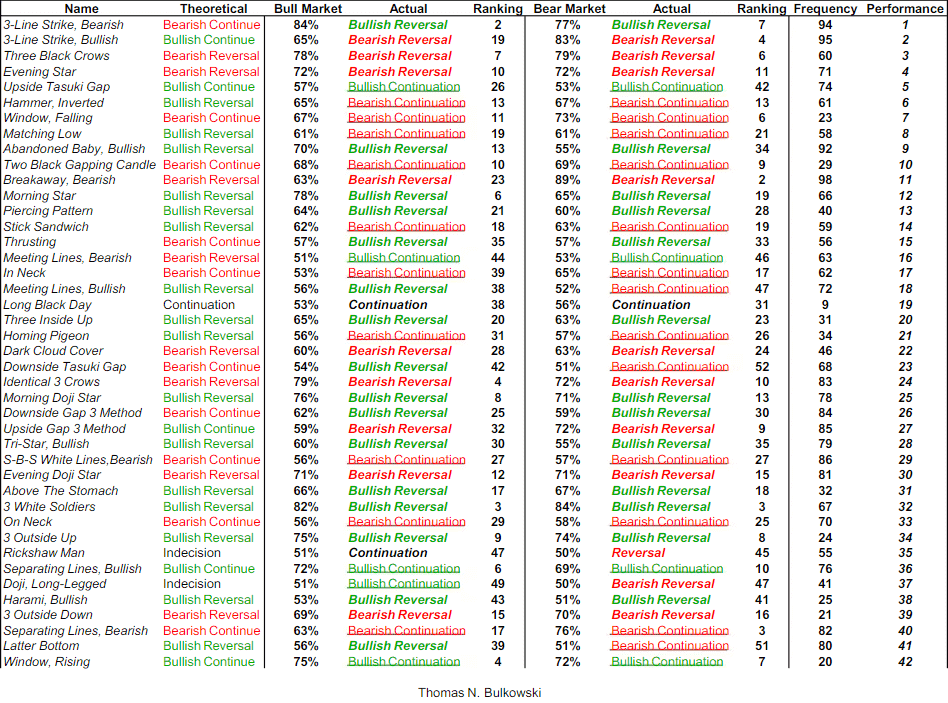
According to studies (the picture below), the Prediction Rate of candlestick patterns is around 50%.
That is why we believe that it would be expedient to apply patterns of Japanese candles for trading in the financial markets only in a combination with more advanced techniques, for example, cluster analysis or Smart Tape.
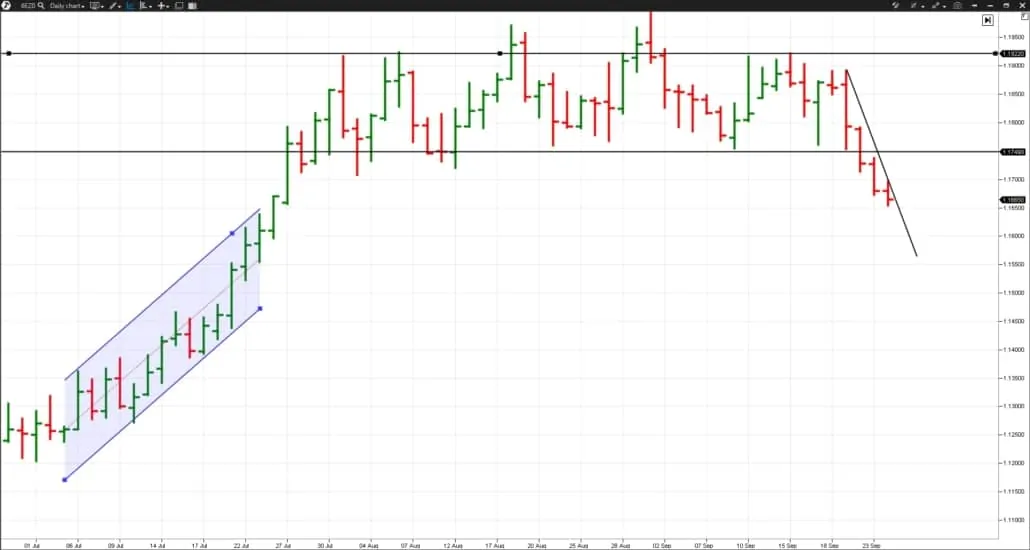
Chart analysis. This type of analysis envisages building various horizontal, inclined and vertical lines in the price chart, from which trend lines, channels, resistance and support levels and various patterns (chart analysis patterns) are built.
Advantages of this method:
- simplicity in use and clarity;
- ability to forecast significant price levels for market participants.
Disadvantages:
- some subjectivism in building lines and levels;
- complexity in correct interpretation and application of this method in trading.
We wrote in the article on reversal patterns about what chart patterns have high efficiency. Let’s check this table (built by Thomas Bulkowski) again.
Thus, we can say that some chart analysis components have grounds to be used for building a trading system on them. However, it would be better if you add methods/filters to them for increasing the resulting efficiency.
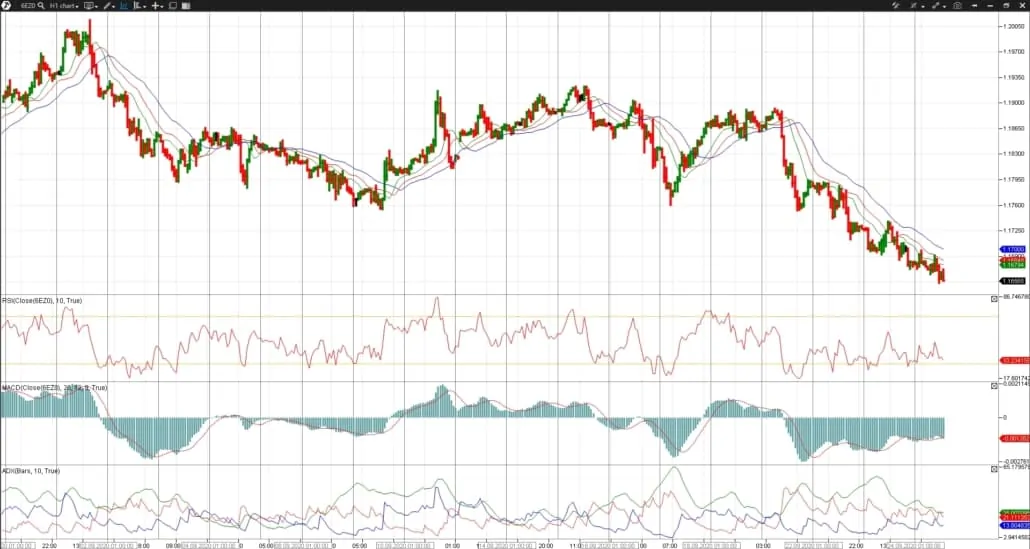
Indicator analysis. This price analysis method is based on studying values of various indicators. In fact, it is a market forecasting with the help of mathematical formulas, through which the historic price data are passed.
Advantages of this method:
- simplicity of use;
- possibility of application in algorithmic systems.
Disadvantages:
- lagging nature of many indicators;
- impossibility to describe a complex market using simple formulas.
We already wrote articles about CCI, RSI and MACD indicators and Fibonacci retracement levels. These articles present the facts that simple systems of trading by indicators could be profitable. Nevertheless, we recommend to act more rationally based on true reasons for price movement.
We should also note that many other theories were developed apart from the above mentioned price analysis methods – wave analysis, fractal analysis, Gann angles and so on. However, you should always remember in the course of a ‘naked’ price chart analysis that this is just one of the market dimensions, although the most important one.
Time. The second market dimension
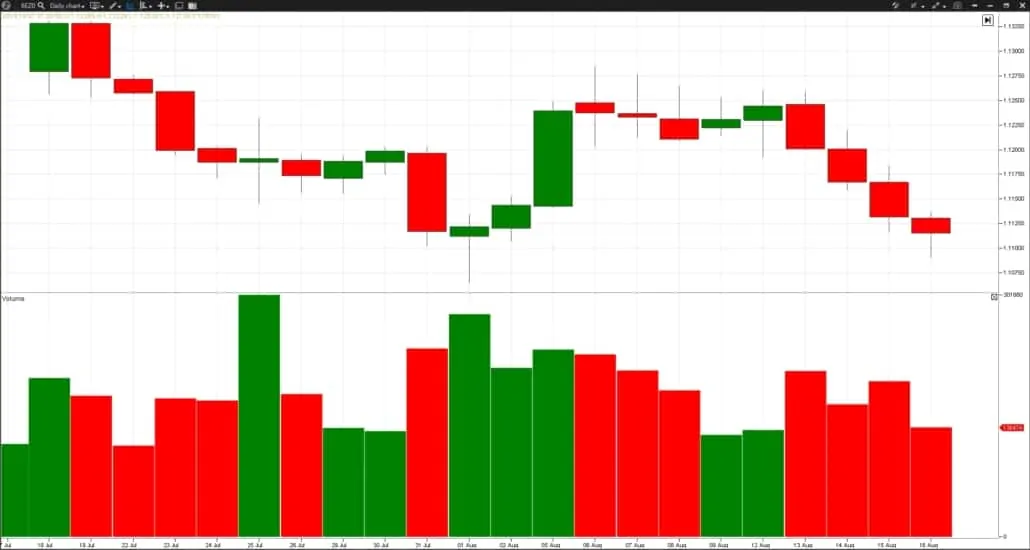
The majority of exchange charts show a price change namely in time. As a rule, the time is in the horizontal chart axis. One time scale mark is a chart period or time-frame.
Time-frame is a measure, with the help of which the second market dimension (time) is taken into account. What are the time-frame types?
- Time-frame: month and week.
This time-frame was used in the early days of the exchange industry development. It was when fundamental events (poor harvests, natural disasters, wars, etc.) had a long-term influence on the exchange asset value and a correct forecast could bring a substantial profit. As of today, monthly and weekly charts are used for realisation of investment ideas, development of which may take a long period of time.
- Time-frame: day.
Namely this time-frame was the main one before the computer era and analysis of daily exchange charts was the main type of analysis. Many instruments of the chart analysis, indicators and Japanese candles were developed for daily charts, that is why more acceptable results are shown in them. As of today, the daily chart trading style may be efficient for those traders who are ready to act conservatively and/or do not have much time for intraday trading.
- Time-frame: H4 – M1. Intraday trading became accessible for a big number of market participants relatively recently. Development of computer technology made the process of connecting to exchanges and conducting market analysis easier. However, intraday trading is not a simple enterprise, especially because trading on small periods is actively driven by algorithms.
Selection of a time-frame is an important step, which you should pay a special attention to. There are more stable trends on longer time-frames, which makes trading easier for a trader. Price changes are more chaotic on shorter time-frames and decisions should be made faster, which increases the risk of errors.
In order to get an advantage by means of selecting a time period, try to use nonstandard periods (time-frame types). This is when the chart time scale is divided in unequal parts. For example, Tick, Volume, Delta and Range charts and other periods, which allow assessing the market ‘at a different angle’, not like the majority.
One more useful article on this topic – Combining time-frames.
Volume. The third market dimension
Volume is a full-fledged but often undervalued market dimension.
Volume analysis functionality is quite limited in many trading platforms, which immediately deprives traders of very important information. Richard Wyckoff used volumes for market analysis as early as at the beginning of the 20th century. His findings were worked out further and many various volume analysis approaches have been developed.
Let’s consider some of them in brief: VSA, Market Profile analysis and Cluster analysis.
VSA (Volume Spread Analysis). This technique, the author of which is Tom Williams, studies the bars’ spread and their vertical volume. Spread is the difference between the high and low.
Based on the bar shape, closing price, vertical volume and previous bars’ dynamics, a conclusion is made regarding the further possible market direction.
Advantage of this technique is that it focuses on price behaviour in connection with trading volumes. Therewith, the cause and effect of market movements are identified correctly.
VSA technique is important for study and practical application in trading. We wrote a series of articles about it and you can start reading it here.
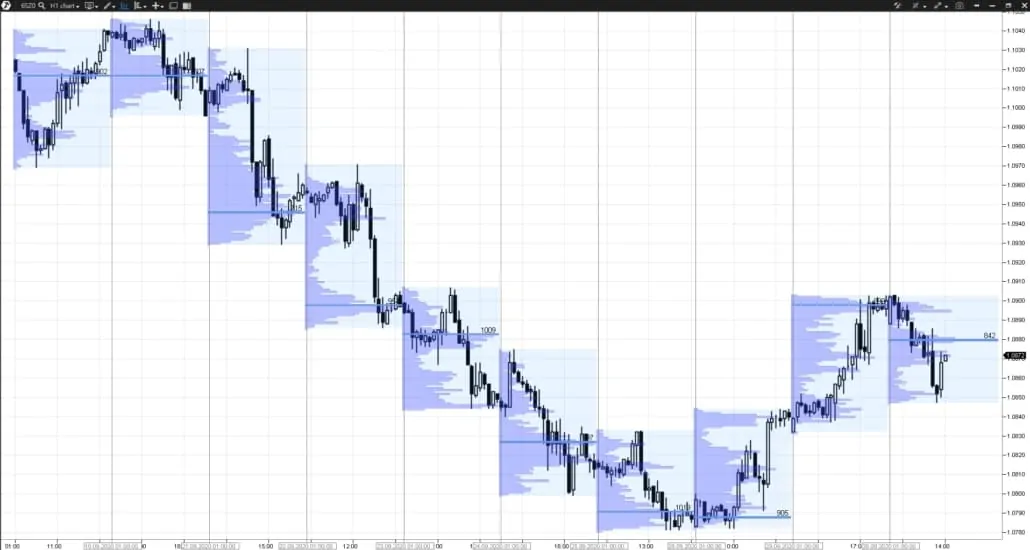
Volume Profile. Horizontal volume (Market Profile) analysis studies volume dynamics by price levels. Horizontal volume helps to see at what prices the biggest trades were executed. In other words, the profile may show at what prices the biggest position was accumulated.
Daily levels of maximum horizontal volume could serve as support and resistance levels for the price.
Advantage of this type of analysis is that it could be used for building a trading system in accordance with actions of major market participants, whose behaviour could be seen through horizontal volume analysis. Trading along with a major player is always more efficient for a private trader, since namely the managed money creates main trends in the market.
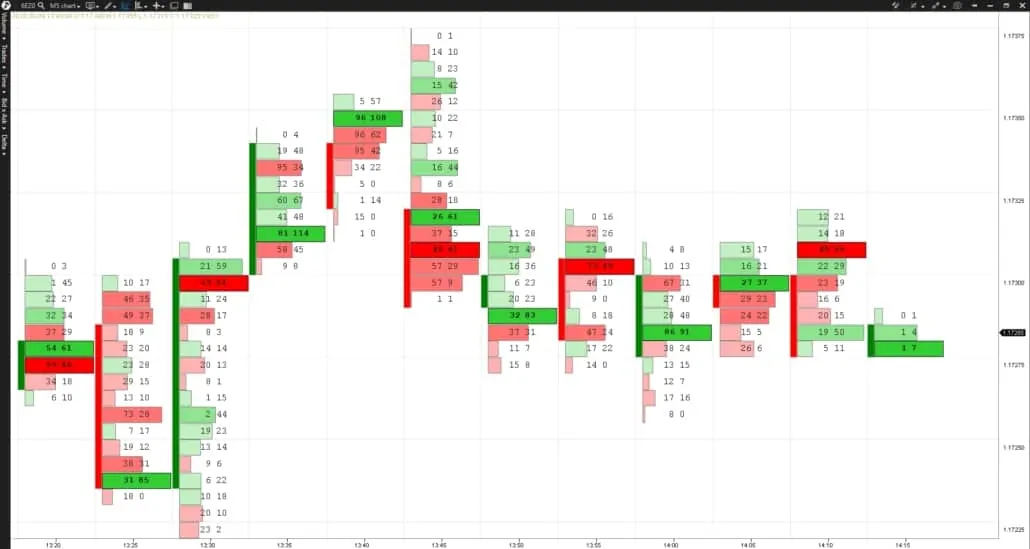
Cluster analysis. The price chart is displayed in this type of analysis in the form of clusters, which show the volume of executed trades, split into sells and buys. This chart is also called the Footprint.
A trader who works with clusters has a possibility of the most detailed analysis of interaction between the volume and price behaviour. The advantage of a maximum of important information results from it. Availability of major clusters can help a trader to find intraday market reversal points and to use them in his favour.
Apart from the above mentioned volume analysis techniques, a lot of other techniques have been developed:
The trading ATAS platform allows conducting a full-fledged analysis of exchange volumes with the help of a big number of powerful indicators. The platform users can combine various techniques, supplement them with their own developments and build unique trading strategies.
The main specific feature of the volume analysis is that it works with the prime cause of price movement. Understanding the prime cause allows a faster and more accurate reaction to price movements.
Conclusions
Study markets at different angles and use trustworthy information for decision making. The use of 3 dimensions, within which markets develop, will help you to identify the most efficient trading strategies.
It is important to remember:
- The more market dimensions we will be able to analyse, the more real and objective market picture we will have.
- Analysis of price, time and volume can give us a more accurate picture of the current market and, consequently, a better understanding of the further price change, which can be used for profitable trading.
- A profitable trading system is a puzzle, completed from various techniques of financial market analysis, which supplement each other.
Information in this article cannot be perceived as a call for investing or buying/selling of any asset on the exchange. All situations, discussed in the article, are provided with the purpose of getting acquainted with the functionality and advantages of the ATAS platform.


