А
Absorption is a scenario in which there is disproportionately high trading volume near the high or low of a bar with no or little price movement beyond that level. Selling absorption occurs when market “aggressive” selling collides with limit “passive” buying, which absorbs the selling side’s supply. A buying absorption occurs when market “aggressive” buying collides with limit “passive” selling, which absorbs the buying side’s demand. Read more in the article on absorption buys.Account Statement (Account Statistics) – a list of information about the trader’s transactions for a certain period of time and the current state of the account.
Accumulation is a market stage when a major player accumulates a long position at low prices.
Alerts are directions for executing a trade on the exchange. There could be paid-for and free signals. They are designed for beginner traders or those who have no time to monitor and analyze the market. A signal example is to buy EURUSD now with YY stop and ZZ goal.
Algo-trader is a market participant who makes (or tries to make) money using algorithms and automatic (semi-automatic) robots. How to develop a robot in detail.
Analytics – a list of analytical information that can be used as a reference when playing on the stock exchange. This block includes world macroeconomic news and expert forecasts.
Appreciation – a situation in which an increase in the value of one currency is expressed in another currency.
Arbitrage is a trading strategy for profiting from the price difference in similar markets. A classic example is when arbitrage traders on the Chicago Exchange immediately post buy orders after they learn that gold has started moving up on the New York Exchange.
Ask is the price for which a seller offers to buy currency. Asks are market orders (orders for selling) posted by sellers, which can be seen in the order book. This article discusses asks in more detail.
Automated Trading System (ATS) is an algorithm for trading on the exchange without applying subjective decisions. It is usually a clear-cut automated trading strategy developed for robots.
Averaging – adding funds to an already open position. As a rule, these are actions according to the Martingale method: for example, if you have an unprofitable purchase for 1 lot, and the price went lower – to average out, you need to buy 2 lots even cheaper and get back at the subsequent growth. And if the price goes even lower – buy 4. This strategy often leads to a deposit drain.
B
Bar Chart is a method of displaying the price dynamics for a certain period of time. Every bar is displayed as a vertical line segment with two marks. The marks mean the opening and closing prices and the low and high of an exchange asset for a selected period of time (time frame). You can see a bar example in the picture below.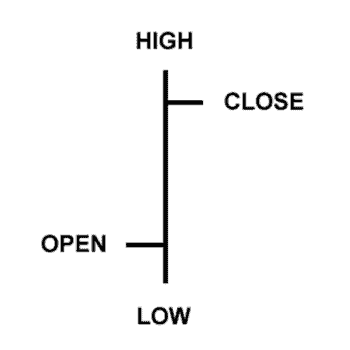
Bear is a market participant (in the wide sense—any seller) who sets his mind on the price decrease. He either has a short position (already sold) or intends to open it, planning to profit from a possible price decrease.
Bearish Market is one in which sellers dominate. Its characteristic feature is the down tendency when supply exceeds demand.
Bid is a buying order. About bids in more detail.
Blue Chips are stocks of famous companies with excellent reputations. Usually, they have a long history and regularly pay dividends. The ‘blue chip’ exchange term came from the poker card game, where the blue chip has the highest value. How to invest in Blue Chip stocks.
Bond is a debt security that is traded on the exchange. Its owner has the right to get its face value from the issuer in cash or in the form of another asset. Bonds have maturity and interest. About bonds in more detail.
Bounce is the price growth, as a rule, after touching the support level. Learn more about how to trade bounces.
Breakeven is the price level at which the available profit on an open position will equal zero. The breakeven level prevents a trade from going into negative territory. Exit strategies will help in this.
Breakout is a sharp change in the rate of a quote when the “bottom” (the lowest value of an asset) or “top” (the highest value) is broken. How to identify and trade breakouts.
Broker or Brokerage Office is an intermediary between the exchange and the customer. This intermediary is authorized to execute the orders received from customers on the exchange and take a commission for the services rendered. Before you start trading, you must choose a reliable broker whose services will best suit your needs. Read more about how to choose a broker.
Bull is a market participant who sets his mind on price increases.
Bullish market is a market with a pronounced price increase trend.
Buy is a transaction aimed at buying an exchange asset.
To be in the market (to have a position) means to have an open trade.
To be out of the market (to have no position) means to have no open trade.
C
Cash is the money in hand. Usually, it means free capital available for exchange operations.Calls are call options. You can find more details in the article What options are.
Candlestick Chart – see Japanese Candles.
Capitalization is the joint-stock company value calculated by the price of its stock. The company capitalization is the number of stocks multiplied by the current stock value.
Catching The Loss means closing a stop-loss position.
Channel is a range (or area in the chart), which is limited to two parallel lines within which the price movement (trend) takes place. They also say ‘a trend channel’. Channels could be ascending (bullish trend) and descending (bearish trend). Learn more about using channels in trading.
Chart patterns are shapes (for example, ‘triangle’, ‘wedge’, ‘flag’, etc.) formed in the price chart. They are formed with lines. Such patterns make it easier to understand the market situation and allow the building of a further action plan in different scenarios. You can find more detailed information in our Chart patterns article.
Close the position / close the trade/close is an action when the previously bought stocks are sold (long) or previously sold stocks are bought (short). When the position is closed, securities are exchanged into money (‘exit into cash’).
Cluster is a set of cells with important information. Each price level has its own cell at a certain time period. A trader can see in a cluster what took place inside a bar. It means that each cluster has data about the volume for each price level apart from 4 standard points – High, Low, Close, and Open. It is important to understand that traders see market orders executed by means of limit orders in the clusters. Read more in the article.
Cluster Analysis involves studying clusters within candles to assess the course of exchange trading in the past and forecast the future. The numbers represent volumes in trades that were made at each price while the candle was forming. Two numbers form one cluster, where the first one indicates the volume of a sell trade and the second one of a buy trade. Read more about the purpose and settings of cluster charts in the article. See Footprint.
Commission – remuneration, which the broker takes from the trader for providing intermediary services.
Composite Man is a collective name for major market players. Wyckoff used the term “composite operator.” He attracts the public to buy assets in which he has already accumulated a significant number of shares, making many transactions, creating the appearance of a “broad market”.
Confirmation means an oral or written notification by the broker to the trader that his/her trade has been completed. If the broker is electronic, confirmation is usually made by means of a pop-up window at the exact time of closing the deal.
Consolidation or sideways motion is a suspension of the trend price motion. The market ‘calms down,’ and the price forms fluctuations that stay within the range on the chart. Moreover, it is usually accompanied by a decrease in volatility and trading volume.
Convergence means ‘meeting at one point’. It is the futures contract price movement to the underlying instrument spot price as the expiration date comes nearer. It means that the futures price and underlying asset price will be nearly equal on the futures contract expiration date. Two prices should approach each other. In case there is no convergence, a prospect for arbitrage emerges.
Correction or Rollback is a price movement directed into the opposite side from the main or prevailing price movement. As a rule, rollbacks are accompanied by the volume (trading activity) reduction. Correction, as a rule, is a counter-trend of a smaller scale within the main trend of a larger scale.
Cross Rate is a currency quotation that does not contain USD, such as AUD/JPY. See Quotation.
Crowd is a term that generalizes a multitude of beginner and minor traders who are inclined to act emotionally.
D
Day Trading – see Intraday Trading.Demo Account is a special training account for beginners who do not risk playing for real currency at once. Such a demo account helps to develop a strategy and get acquainted with the interface of the electronic broker used.
Delta is the difference between the buying and selling trades. Read more in the article What is delta and cumulative delta.
Derivatives are the underlying financial instruments. For example, Apple shares (AAPL) – basic instrument, Apple shares futures (AAPL) – derivative.
Deutsche Akzien Index (DAX) is one of the most important stock indices in Europe. It reflects the state of the German economy. The DAX includes shares of the 30 largest “blue chip” companies in Germany, which form the top list of the Frankfurt Stock Exchange. Among them are Adidas, BMW, Siemens, Deutsche Bank, and others.
Distribution is a market stage when a major player closes a long position at market highs, selling out a previously bought asset to the crowd. Read more in the article Accumulation and Distribution in VSA.
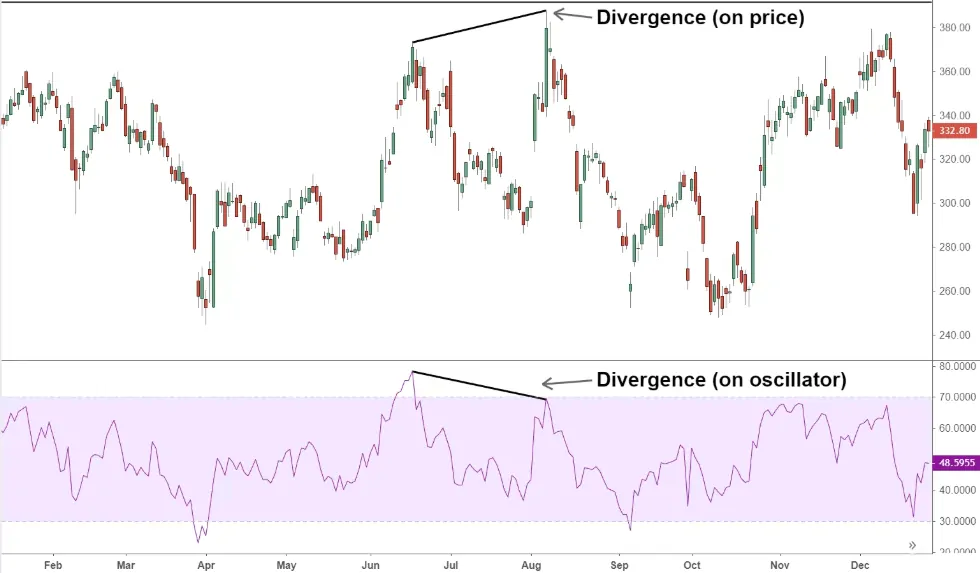
Divergence is a difference between the price and an oscillator (indicator). A divergence is formed if the price forms a new extremum, but the indicator does not show it. It means that the trend is weakening. Learn more about the types of divergence.
Dividend (something that should be divided) is a part of a company’s profit, distributed among stockholders in accordance with the number and types of stocks. A stockholder’s meeting identifies the amount and order of payment of dividends. As a rule, news about a company’s dividends is succeeded by a leap in the respective stock price.
Dealing Center is a legal person and a non-bank office that provides services for executing trades in the international currency (Forex) and Contracts For Difference (CFD) markets. The customers of such offices are, as a rule, beginner speculators with a small trading capital. They work under conditions of margin trading and use leverage. Trades executed through a dealing center do not, as a rule, reach the official exchange. Customers of such centers trade either against other customers or the center itself.
Drawdown is a paper loss formed when the price moves against the existing position.
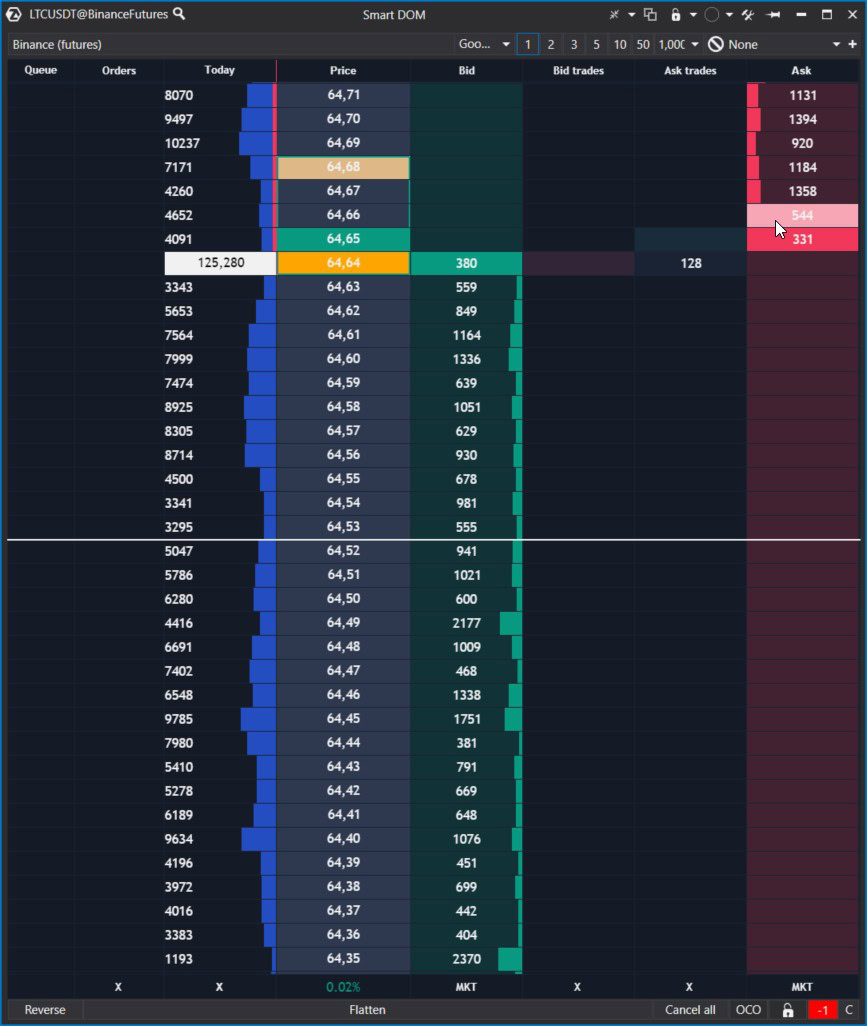
DOM/Depth of Market/Order Book is a queue of orders in the stock exchange terminal, where existing, placed orders from exchange traders are visible. Read more about the stock exchange stack in this article. An example of a stock exchange stack is shown in the picture below.
Downtrend is a stable price decrease.
E
Entering The Market means opening a position or executing a trade.Equity Manager – a professional financier, a legal or natural person whose job it is to manage a portfolio of stocks.
Eurobond is a bond that is issued in a foreign currency. In fact, it is a debt liability, which has maturity. Long-term eurobonds are issued for a period of 40 years or more. There are also middle-term eurobonds – more than 10 years, and short-term – from 1 to 5 years. You can find more detailed information about bonds in our article.
Exit Strategies in trading involve a range of actions traders take to protect their capital from losses. Since losses are inherent to the profession, developing an exit strategy involves finding, achieving, and maintaining an optimal balance where losses are offset by profits. This article will explore the tools for implementing exit strategies available in the ATAS platform.
Expert Adviser (EA) / Trading Robot is software for automatic trading that works independently in accordance with the previously set algorithm. Other names: expert, bot, and automatic trading system.
Expiration is the contract maturity date. It usually concerns a futures contract. On that date, obligations, settlement payments, and/or asset delivery must be executed.
F
Fair Price is the estimated value of a stock aimed at understanding its intrinsic real value. Various fundamental approaches and volume analyses are used to calculate the fair price.Fibo/Fibonacci is a tech analysis tool and indicator based on Leonardo Fibonacci’s numbers. The article explains Fibonacci numbers in more detail.
Flat is a price movement without a clearly expressed trend. The chart forms a so-called corridor. Also see Consolidation.
Floating Profit / Floating Loss is the same as paper profit or loss. These are not yet registered results of the trading activity.
Following Manager allows you to automate the work with accounts more efficiently and clearly. Trade on the main account, and all your actions will be automatically transferred to other accounts – just activate the order and position copying module. Following Manager ATAS works in 2 modes:
- Order copying: place an order on the main account, and all actions will be transferred to other follower accounts without synchronization of positions.
- Position copying: positions on the provider account are synchronized with positions on the follower accounts.
Footprint – cluster chart. A modern format of the exchange chart displays the most accurate information about the transactions made, including time, price, volume of purchases, and sales.
Forecast is a judgment about the probable future price movement. It is based on technical analysis and fundamental factors.
Forex is an over-the-counter transaction market where currency trades are made.
Forward Market is the market of derivative financial instruments. It trades futures, options, and swaps.
Fundamental Analysis is an approach to assess the market, industry, and economy. It includes a set of methods of analytical research of macro and microeconomic data, their comparison with each other, as well as financial analysis. Read more about fundamental analysis.
Futures / Futures Contract is a derivative financial instrument. Learn more about what a futures contract is.
G
Gap is a price change that creates a ‘disruption’ between the bars in the chart. Gaps are very common for opening a session in the stock market. They are less frequent in the Forex and futures markets since they are open for a longer period of time. There could be a gap up or a gap down. The picture below shows the two most pronounced gaps up in the AAPL stock market.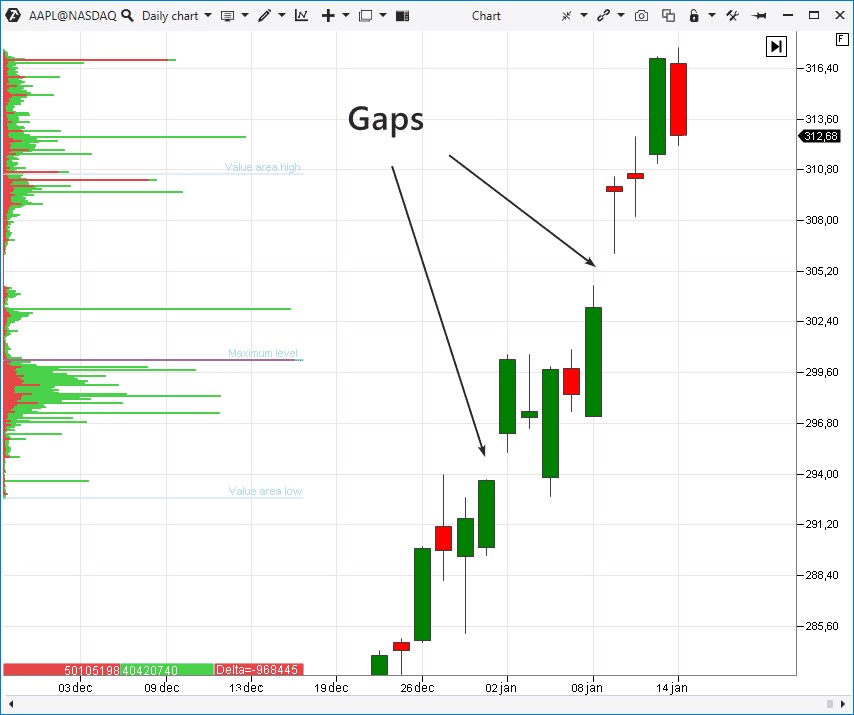
H
Head is the figure of technical analysis “head and shoulders” pattern (SHS).Heatmap – a way of displaying the activity in the DOM over time. The brighter the level on the price chart – the larger the volume of limit orders placed at this level in the stock exchange stack. The improved heatmap provides more useful opportunities for ATAS platform users when working with Scalping DOM and DOM Levels indicators. Read more in the article.
Hedging is a way to hedge against an unfavorable scenario. Read more about what hedging is.
High – maximum price. For example, the daily high is the maximum price for the day at which the deal was concluded. To catch the high – to conclude a deal at the maximum price.
High-frequency trading (HFT) is a type of trading in which the period between opening and closing a trade lasts for a fraction of a second. This type of trading is generally carried out using trading robots.
I
Index is a financial indicator. It is the generalized and averaged (by a special formula) price of all financial instruments included in its calculation base. The index reflects the dynamics of the market (stock market, bond market, and so on). You can find more details in our article about stock indices.Indicator is one of the tools for working with a chart. Indicators recalculate data and transform it into a convenient form. There are fundamental indicators (predicting based on macroeconomic indicators), technical indicators (predicting based on previous chart movements), and indicators designed to analyze volumes. The purpose of indicators is to help analyze the market and find entry and exit points. Read more about the types of indicators and their purpose and customization in the article. Also, in ATAS, you can add a unique custom indicator yourself or order it from professional developers.
Inflation is a measure of the cumulative increase in the cost of all goods and services in an economy. Over the course of a year, some goods may become slightly cheaper, while others may become slightly more expensive. Therefore, the aggregate value of some set of goods and services is important for measuring inflation. Moderate inflation is considered a good thing for the economy, while high inflation and deflation (falling prices) are extremely dangerous phenomena.
Intraday trading is a type of trading in which all operations on the exchange take place within one trading session. Positions could be held for several minutes to several hours; as a rule, they are never rolled overnight. Traders who trade within this strategy are called intraday or day traders.
Insiders are market participants who have real information that is unaccessible to the majority. This information (inside) can influence the prices of exchange instruments. That is why inside knowledge (for example, information about unpublished reports) gives insiders a competitive advantage in the market.
Investment is an activity directed at conserving and augmenting capital. Usually, investments mean inputs into stock markets (buying stocks, bonds, etc.). Investment inputs are performed for a long period, starting from 1 year and longer.
Issuer – an organization that issued securities. For example, the company AAPL issued shares for XXX dollars. The issuer can also be the state.
J
Japanese Candles – a chart type, which is very popular among traders. You can find more information in the article about candlestick analysis.L
Leverage is the ratio between the amount needed to bet and the amount in the trader’s account, also called “leverage.” It helps to make large trades with minimal risk of loss.Limit Order is an order that is executed at the price specified in it. It may be executed at the best price but not at the worst price. A limit order could be for buying or selling. It could be set higher or lower than the current rate. You can find more information about limit orders in our article about matching orders on the exchange.
Line Chart is a price movement chart built as a curved line.
Liquidation is a forced position closing. This unpleasant event occurs when a trader has no money to support his position. Sometimes, it means that the trader lost his capital completely, and sometimes, it means that he lost it partially. It depends on the exchange, broker, and trading conditions.
Liquidity implies the popularity of the market. The more operations in the market are, the more traders there are and the less difference between counter-orders is – the higher the market liquidity is. More detailed information about what liquidity is.
Liquidity Seizure is position building by means of a flow of counter-orders. For example, a major player uses a splash of panic to sell orders and accumulate a long position.
Locking is an opening of a position that is opposite to the already existing one and has the same volume. It is allowed in the Forex if a trader has an open buy and he opens a sell. It is a kind of hedging. Locking (lock up) is usually applied for registering a floating loss. Locking is not allowed for regular traders in the stock market. If you bought an asset on the official exchange, you can only sell it and register the operation result.
Log (Trader’s log) is a trader’s electronic or paper journal. It records stock exchange operations with prices, reasons for making them, important events, thoughts, ideas, and many other things. A diary helps a trader to keep discipline, find and eliminate mistakes, and better understand his psychology and his actions on the stock market. Why you should keep a trader’s diary.
Long or Long Position is the availability of previously bought securities with the purpose of further broking at a higher price.
Loss – loss on the deal.
Lot – a unit of transaction measurement.
Low is the minimum of the price.
M
Majority Stakeholders are influential owners of the company stock, who, as a rule, are members of its Board of Directors. They can participate in making important decisions, they have access to inside information, and their votes have special weight at the stockholder meetings.Manipulator/Puppeteer – a major player in the stock (currency, futures, or other) market who is often suspected of price manipulation.
Margin Call takes place when the value of an investor’s margin account (the account to which the securities bought for the borrowed money are deposited) falls below the required broker’s amount. The margin call is a broker’s requirement for an investor to deposit funds immediately to support the investor’s position.
Margin Lending is a method of buying more on the exchange than you can afford and possibly selling the securities you do not have. Due to the margin lending service, a broker (or exchange) provides you with, you can trade for the amount of USD 1,000 while having only USD 200-300 on the account. This allows increasing the yield but also bears the risk of loss.
Market Analysis – a list of analytical information that can be used to guide you when playing on the stock exchange. This block includes world macroeconomic news and expert forecasts.
Market Maker is a person who provides services to the exchange to maintain prices and/or trading volume on various financial markets. Read more about who a market maker is and how he works.
Market Order is an order to immediately buy/sell an exchange instrument at the best current market price. It is an aggressive type of trading on the more decisive and dominant market side.
Market Profile is an important tool for analyzing volumes. Read more in this article.
Market Replay (Replay) is a stock exchange simulator that uses historical data to recreate the course of trades from the past to the present. Figuratively speaking, it is a “time machine” in the trading platform with Play, Pause, and Stop buttons. Replay allows you to practice your chart-reading skills, and create new strategies and/or improve existing ones without risking real capital.
Minority Shareholders are stakeholders who own small amounts of company stock. They are not included in the company’s Board of Directors and own stock for investing or speculative purposes.
Money Management is a system of capital management. It includes a correct calculation of the working volume, a number of simultaneously opened positions, acceptable risks (drawdowns), guides for goals, etc.
Moving Average is an indicator. It is the average price value for a selected period of time. There are several types of moving average calculations: simple, exponential, and others.
O
Offer is the same as Ask. For example, the ‘to buy offers’ phrase means an aggressive buyer acts in the market.Open Interest is the value of mutually open positions of buyers and sellers. The value of open interest is broadcast only for crypto exchanges. There is a variation margin, for the provision of which it is necessary to keep records of open positions between buyers and sellers. Mutual obligations between buyers and sellers are secured thanks to the guaranteed collateral. Clearing houses use margin funds to distribute variation margins between losing and gaining traders. Other exchanges offer this information only in their weekly reports.
Order is an instruction a trader sends to his broker for execution on the exchange. An example of an order is ‘to buy immediately’ or ‘to sell YY contracts when the price is at the level of USD XX’. All exchange orders are standardized. Every order contains all the necessary information, such as period of validity, money amount, price levels, conditions of execution, etc.
Oscillator is a modification of the technical analysis indicators that show the overbought/oversold areas. They are usually displayed in the form of a bar chart or curve and placed under the price chart.
Option is a contract by which a potential buyer or potential seller of an asset (commodity, security, etc.) obtains the right, but not the obligation, to buy or sell at a previously specified price. You can read in more detail what the options are.
Overbought means the market is overheated, and prices are too high. The probability of their reduction is growing.
Oversold means the market is panicking: prices are too low. The probability of their increase is growing.
P
Paper Profit or Floating Profit is an amount that would become an actual (registered) profit if a trader closes his position. The paper profit fluctuates (it may either go up or down) while a position is open.Pattern is a repeated model in the price dynamics.
Pending Order is an order to execute a trade under certain conditions. For example, after posting a pending (limit) buy order when reaching the price level of XX, a trader may switch off the monitor since the trade will be executed automatically.
Point, Pip – minimum step of change in the price of the exchange asset.
Portfolio is a set of exchange assets, such as open positions in various markets and free funds on the account.
Position is an open trade.
Position Trader is a trader who holds his position for a long period of time. It is the investment style. The trade duration is one year or more.
Professional Market Participants are organizations that help make the securities market function. The article about professional participants provides more detailed information.
Protective Orders are limit exchange orders used, as a rule, to protect an open position against undesirable losses in the event of unfavorable situation development. More commonly known as stop losses. They are also used to protect paper profits (see Trading Stop). Learn more about setting stop-losses and take-profits in ATAS.
Q
Quote is the current price of an exchange instrument. It is based on the price of the last concluded deal. A more specialized term. The term “rate” may be used commonly. Quotes are also sometimes used to refer to historical data on price changes.Quotation is the current price of an exchange instrument. The price of the most recently executed trade is taken as the basis. It is a more specialized term. The simpler term “rate” is used more often in everyday language. Also, quotations sometimes refer to the historical price change data.
Quotation currency (counter currency) is the currency in second place in a price quotation. This is a Forex term. For example, the quotation currency in USDJPY is JPY.
R
Range – the difference over a certain period of time between the maximum and minimum levels of the asset price.Reaction is usually a temporary drop in price after an up-trend.
Register (Trading Register) contains detailed statistics of trading operations. A similar term is a trader’s log. It contains information about how much was bought/sold, at what prices, and what the result was. It helps to conduct analysis of trading actions and detect and correct mistakes in strategy and psychology. ATAS has trading statistics, which are registered automatically (see the picture below).
Register profit (Loss) means to close the current position (trade). Besides, the paper profit (loss) becomes actual.
Regulatory Structures – governmental organizations that provide control and management over the activities of brokers, exchanges, issuers, traders, and investors, i.e. all those involved in professional securities trading.
Resistance/Resistance Level is a significant level at which the price usually slows down its growth and starts falling. More detailed information about support and resistance.
Re-Quote is a situation when a broker offers another quotation at the moment of the order execution. Re-quotes often occur during periods of accelerated motion in the vigorous market. Sometimes, re-quotes bring even a higher profit.
Reverse means to change a position to an opposite one. Buys became sells and vice versa.
Risk Management is a set of measures directed at limiting losses, keeping them under control, and preserving capital. Mathematical models are used to achieve this goal. A more general term — capital management — is also used.
Rollback — see the Correction.
S
Short Position – a selling operation. If you see that the price is ready to fall, you can even sell assets you don’t own (borrowed from a broker). You short the market with the goal of buying back the stock later at a lower price and capitalizing on the difference. A downside play. Read more about how to make money when the market goes down.Short Squeeze – closing short positions in a bull market at any price. This process strengthens the upward momentum even more.
Sideways Motion – see the Consolidation.
Size is the volume of an order, position, or market in general.
Slippage is the difference between the price at the moment of order posting and the price at which this order will be executed. Slippage is most common for vigorous markets when sharp price increases and an order flow from traders occurs on the exchange. Usually, orders are executed longer and not so much as wished.
Spike is a price quotation that stands out from the current general context. It may form a significant break in the price with a further return to the previous level. As a rule, spikes are the consequence of a technical malfunction.
Spot is the market that trades physical commodities with their further delivery.
Spread is the difference between the best buying price and the best selling price. In other words, the distance between the nearest Ask and Bid. Small spreads are characteristic of popular liquid markets. You can find more details in this article.
Stochastic is a tech analysis indicator, a stochastic oscillator.
Stock Market is an exchange market where transactions with securities are made: stocks, bonds, and shares.
Stocks are securities that indicate that their owner has contributed to the capital of the company. For example, Apple stock. There could be ordinary and registered stocks. A stock gives its owner the right to receive some benefit from owning it, such as dividends, voting at shareholder meetings, and claiming an interest in the company’s property. This article provides detailed information about companies’ stocks and how to profit from them.
Stockholder is a stock owner.
Stop Loss is a protective order designed to help prevent capital losses. It is used to severely limit possible capital losses in case the market has gone the wrong way.
Stopping out is a price movement, the purpose of which is seen as activating protective stop orders.
Support or Support Level is a significant level at which the price usually slows down its fall and starts to grow. Read more about support and resistance levels.
Swap is a value that influences open trader positions, which are rolled overnight. If a trader leaves a trade open the next day, a swap is charged for rolling over and holding the position. This payment is justified by the high risk the broker takes holding the trader’s position. It is used both on the stock exchange and in the Forex market.
System Tading uses a strategy that strictly observes a trading plan.
T
Take A Position means to enter the market. Buy or sell shares, futures or other exchange-traded asset.Take Profit – the price value at which the planned profit fixing takes place. It is used for capital management.
Target is the price movement goal and a reference point for a take profit.
Technical Analysis is a stock exchange science, a set of methods for analyzing price movement. It aims to determine the price movement that is more likely to occur.
Tick/Tick Chart represents the quantitative price change within a time frame unit. One tick is equal to one price fluctuation. This is how the tick volume indicator operates in MetaTrader 4, a widely used trading terminal for forex trading. More about tick chart settings in the article.
In the ATAS platform, a tick can represent:
- One trade. Hence, the Tick Chart (1000) – a chart where one candle corresponds to 1000 trades. The price does not necessarily have to change. If there are 3 trades made at the same price, there will be 3 ticks.
- The minimum possible change in the instrument’s price, i.e. the increment on the price scale. For example, in the oil market, 1 tick is equal to 1 cent per barrel.
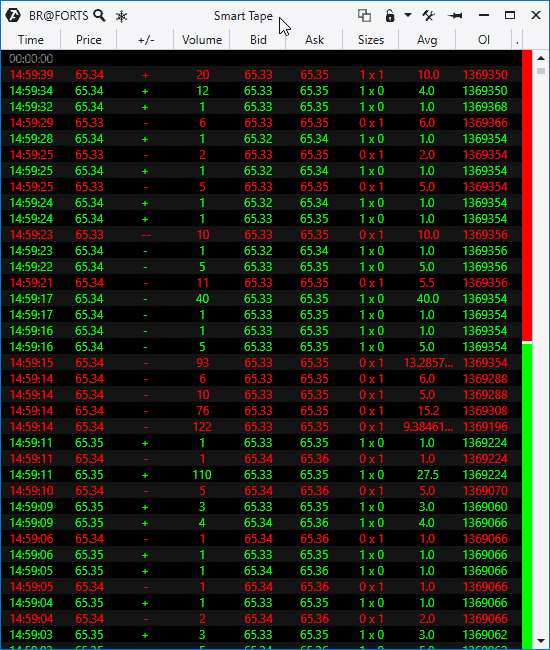
Time and Sales Tape is an instrument for analyzing just-executed trades. It allows monitoring of what takes place ‘now and here’. An example is the Smart Tape from the ATAS trading platform (see the picture below).
Trader is a specialist who trades financial instruments on the exchange. He can buy and sell securities on behalf of his customers or on his own behalf. As a rule, a trader acts based on a developed strategy.
Trading is a commercial activity on the exchange. Trading as such is an analysis of the current market situation, the execution of trades, and the observation of risk management rules.
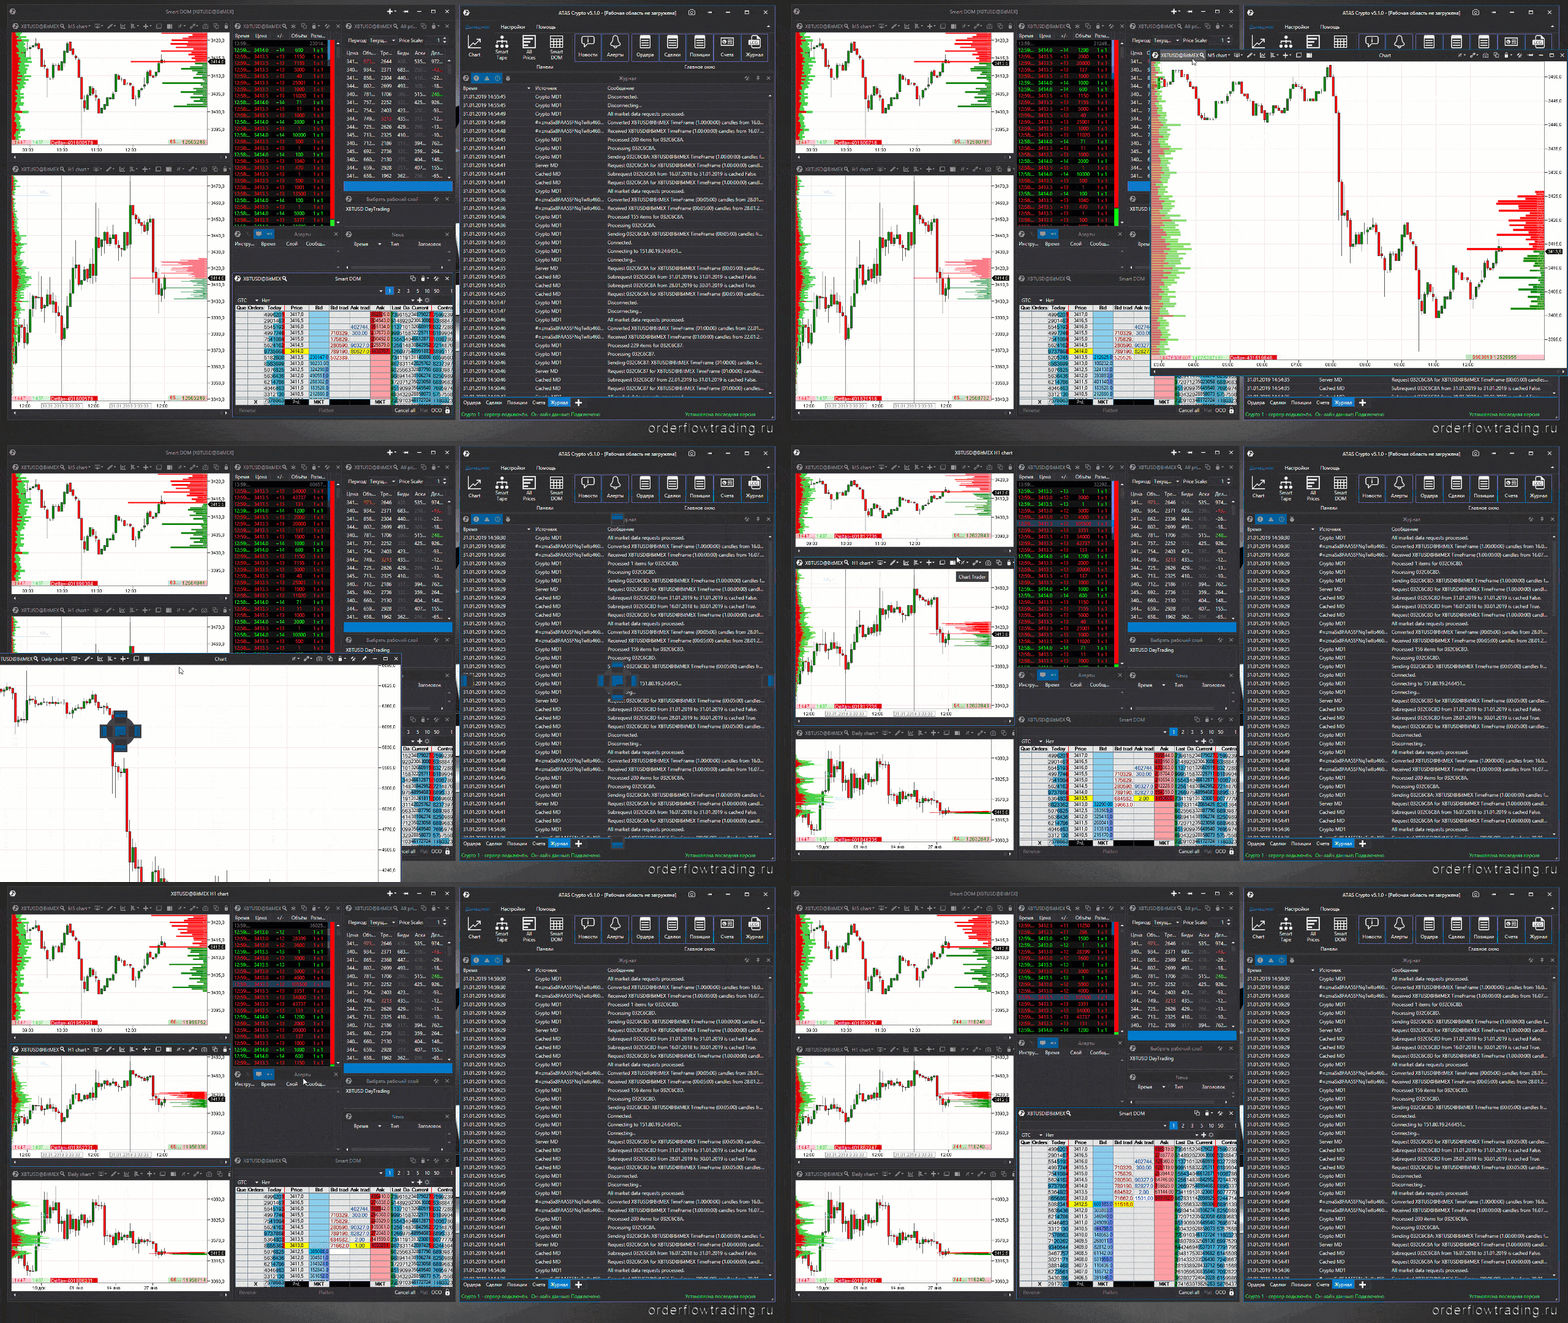
Trading Platform is software for analyzing the market and executing trades. An advanced platform (for example, ATAS — see the picture below) gives a competitive advantage in exchange trading.alysis.
Trailing Stop-Loss is a type of stop-loss, an order for sequential automatic fixation of growing profit on an open position in case of a favorable price movement. The desired level of restriction is set, and the program moves it independently. The trailing stop is set for an open position and works only when the terminal is enabled.
Trend is a stable price movement with a focused character. There could be an up (bullish) trend or a down (bearish) trend. How to identify a trend day. Read more in the article.
Trend Line is a line segment, half line, or continuous line built through the price extreme points in the chart. The trend line is an important level of resistance or support. It helps to find the position opening/closing moments and judge about the market strength/weakness and mood change. It is one of the keystone concepts of technical analysis.
U
Unit Investment Fund (UIF) is an investment method in which the fund participants’ money funds are accumulated and invested in valuable exchange assets.Up-bar is a bar, the price of closing which is higher than the price of closing the previous bar (or than the price of its opening).
Uptrend is an ascending trend and consistently growing price.
V
Volatility is a property (ability) of the price to change or deviate from its established value easily. A volatile market is one where significant expanded price fluctuations are observed. About volatility in more detail.Volume is a trading activity indicator. It can be calculated in contracts, money, or ticks. It can also be calculated for a unit of time (for example, a volume for 1 hour) and used for non-standard chart types. An increase in the volume in the direction of price movement usually shows the strength of this movement. Volume analysis is an important piece of knowledge for traders.
Volume analysis is a type of technical analysis that focuses on the interaction between the price of a financial asset and the volume of concluded transactions. It is an effective approach to forecasting price movements. Volume analysis is based on studying supply and demand forces, which are the drivers (reasons) for quotation growth and decline.

