Getting acquainted with ATAS: Indicators
In the previous three articles of the ‘Getting acquainted with ATAS’ series we carried out:
- General review of the platform functionality
- Review of functions and advantages of working with charts
- Review of the cluster chart functionality
This article is the next one in the series, prepared for those who are interested in volume analysis and studies the professional ATAS platform functionality for this purpose.
Subject of the fourth article – Working with indicators
The ATAS arsenal includes nearly 100 indicators and this number is constantly growing.
The goal of this article is to provide a review of available indicators. We hope that, while you process this information, you will get ideas about how to apply ATAS indicators in order to build a strategy and/or improve your results in real-life trading.
Contents of the text part:
- how to get access to indicators;
- indicator manager structure;
- how to set up alerts;
- Bid Ask, Bar’s Volume Filter, Volume, Delta and Cumulative Delta indicators;
- Cluster Search, Cluster Statistic, TPO and Profile, Maximum Levels and Dynamic Levels indicators;
- Big Trades, Multimarket Powers, Order Flow Indicator, Speed of Tape and Tape Patterns indicators;
- Dom Levels, Depth of Market, DOM Power and Stacked Imbalance indicators;
- how to combine indicators;
- useful links.
There is a form for comments after the article. Leave your comments if you have questions – we will be glad to help you.
How to open a new indicator
First, you need to open the chart. Then use one of 3 ways to open the indicator manager:
- Press Indicators icon in the chart upper panel.
- Mouse over the chart, click the right mouse button and select Indicators in the context menu.
- Press Ctrl+I.
The indicator manager will be opened on top of the chart.
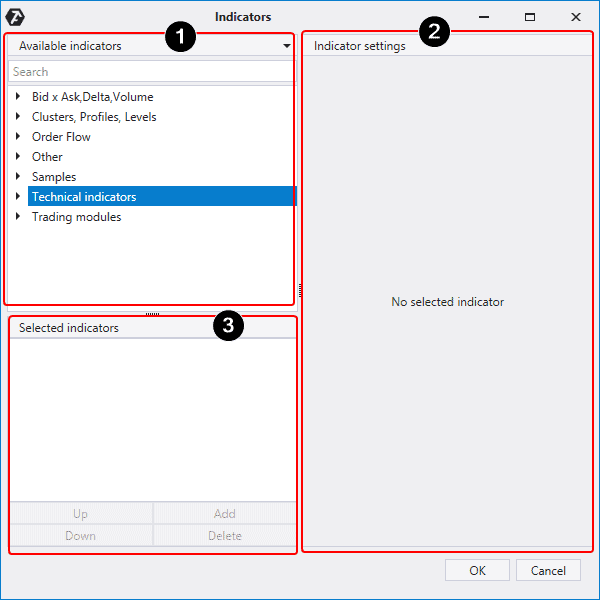
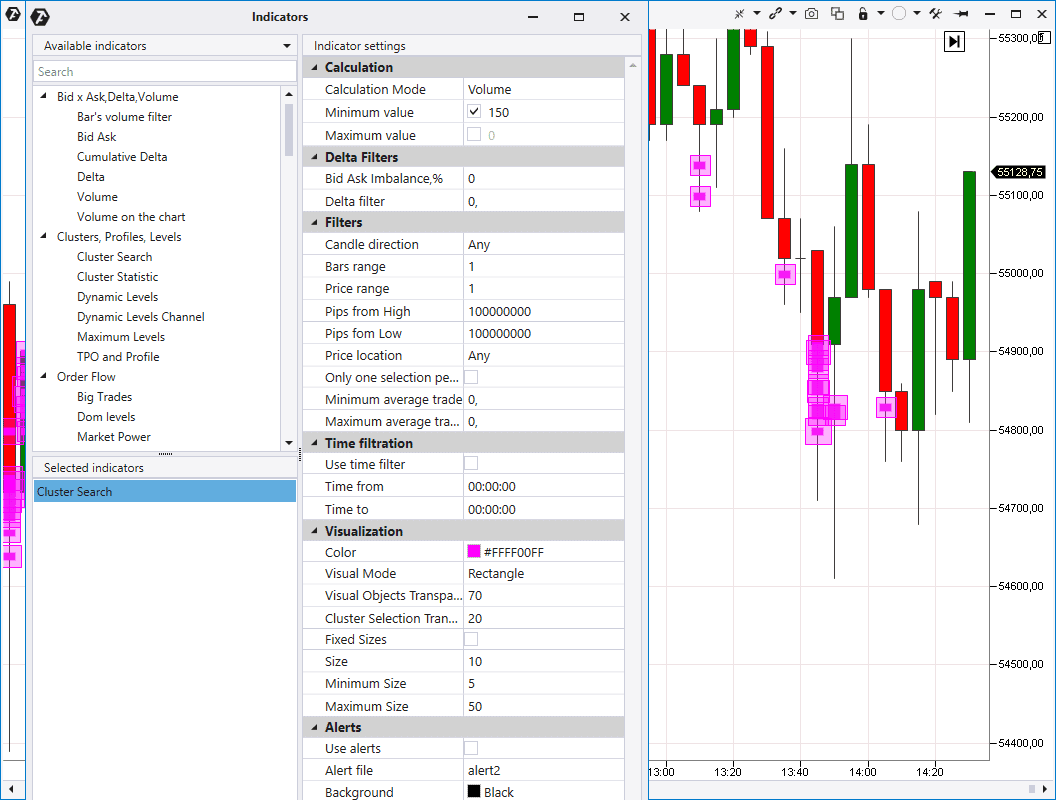
The indicator manager window is divided into 3 sections:
- The top left one contains a catalogue of all available indicators, which consists of 7 categories. Use the Search field to find a specific indicator.
- After you select some indicator in the catalogue, its default settings will be opened in the right section. Press the Add button to add an indicator to the chart.
- After you have done it, the selected indicator will appear in the chart and in the bottom left list. All indicators, which were added to the chart, will be shown here. Using Up / Down buttons you can move an indicator and place it on top of or under other indicators. Use the Delete button to remove an indicator from the chart.
Before we consider the categories in detail, we want to show you an important function, which is available for many indicators. This function is Alerts.
What Alerts are and how to set them up
Alerts are indicator signals, which traders may receive by means of:
- playback of an audio file;
- sending a message to an email address;
- sending a message to a Telegram account.
For example, you can check the Alerts item in the Big Trades indicator settings in order not to miss big volume trades in the chart.
Audio files are set in the indicator settings.
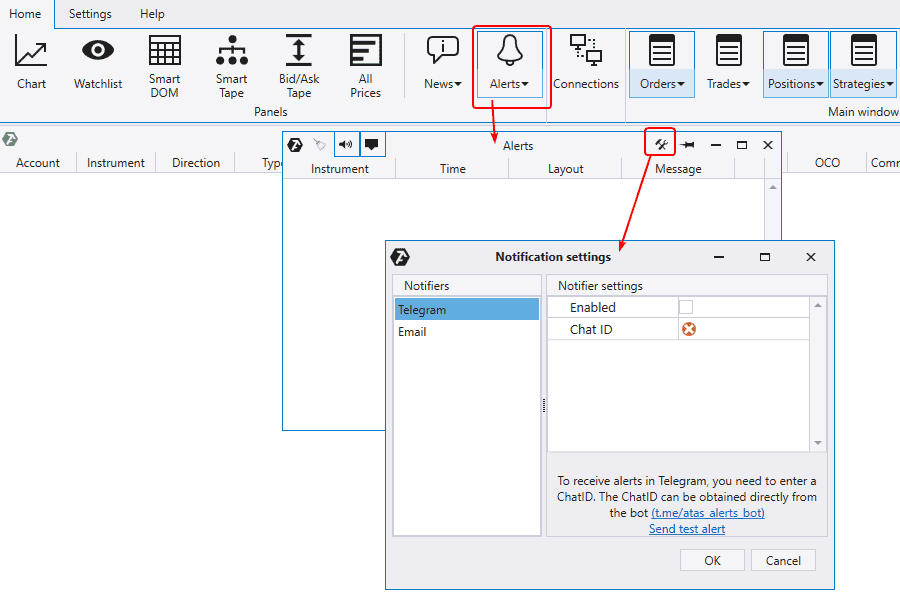
In order to set up receipt of notifications and messages, you need to press the Alerts button in the main window. The list of all activated Alerts will be saved here. The window has the settings button. If you click it, you can set details for sending Alerts to an email address and Telegram account.
Useful links:
- Instruction. How to set up alerts
- Blog articles with the Indicators tag
Now we start reviewing individual indicators.
Bar’s Volume Filter indicator
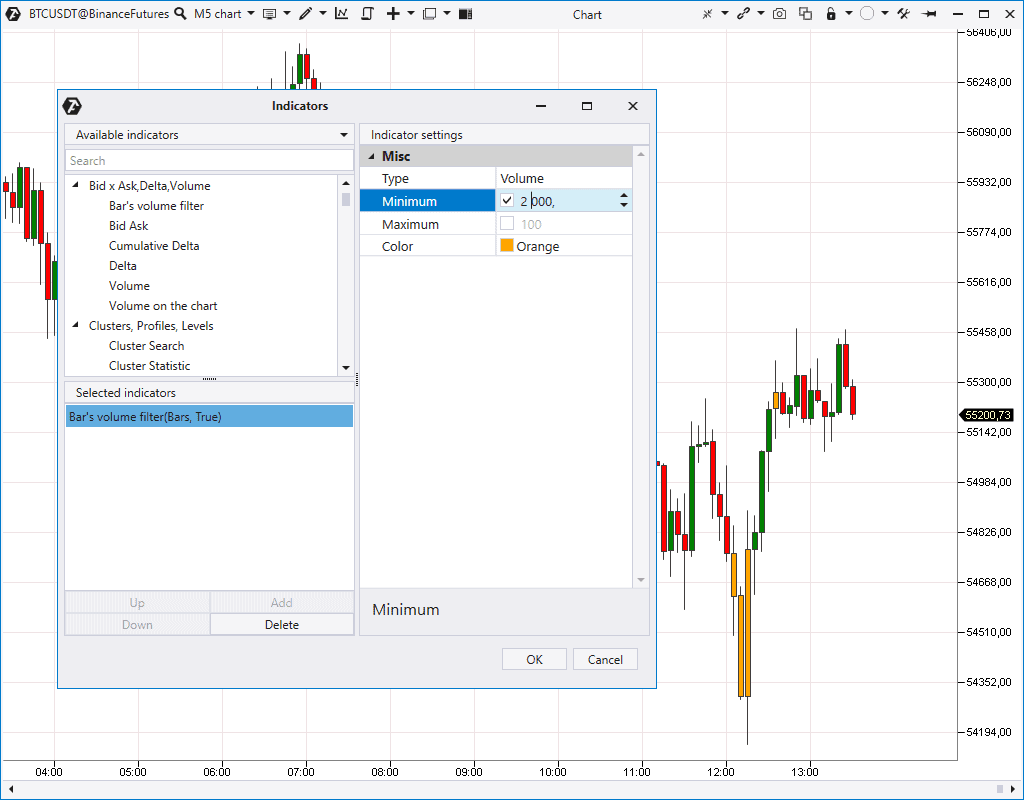
The Bar’s Volume Filter indicator highlights (the default colour is orange) a candle in the chart when the volume / delta / number of trades in this candle reaches the set value.
We can set the low and high of the range, within which the indicator searches for signal candles. The search will not be restricted if you do not check the maximum value item.
This indicator will save space in the chart since you do not need to load the Volume indicator and take space in some strategies.
Useful link:
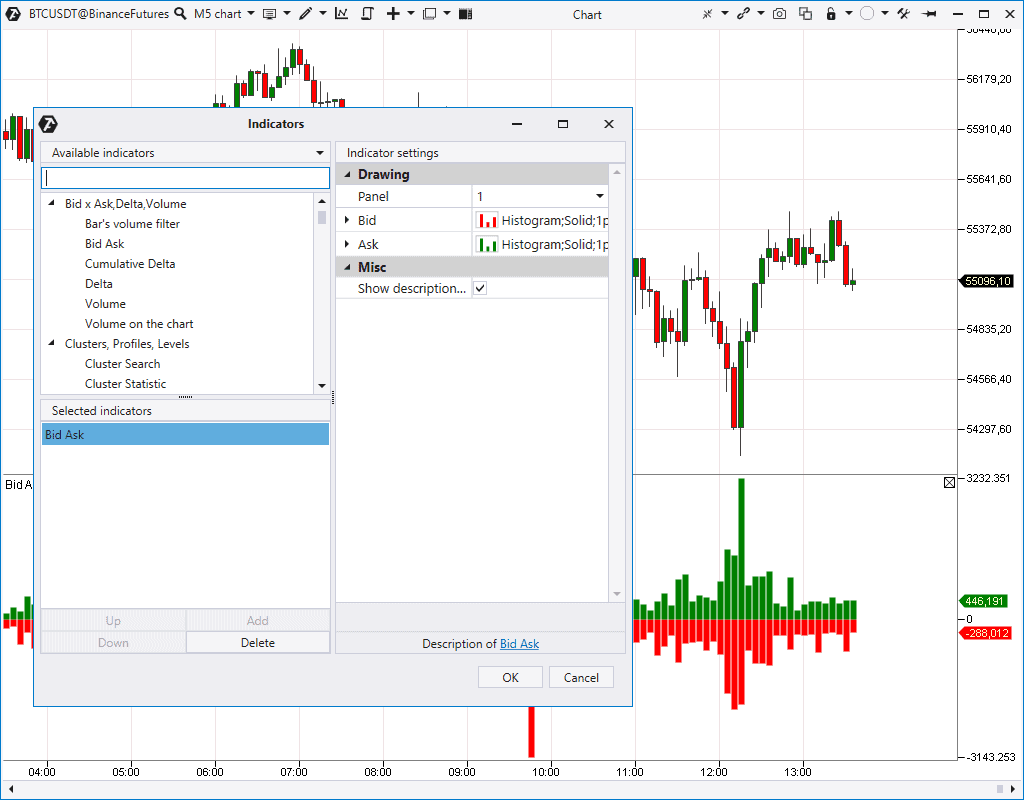
Bid Ask indicator
Bid Ask indicator shows market buy and sell trades separately in the form of a two-sided histogram.
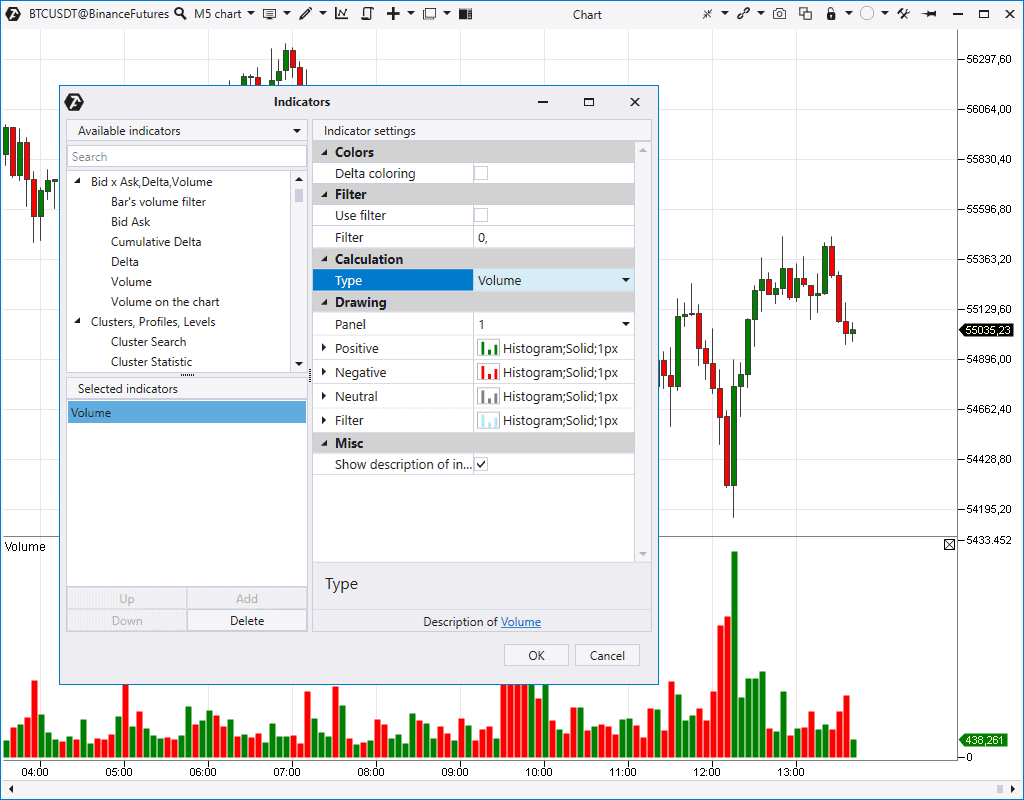
Volume indicator
The Volume indicator shows the total volume (real or tick one) in every candle in the form of a vertical histogram under the price chart.
It is the basic and, perhaps, the most popular volume analysis indicator.
You can use a filter and change the histogram colour display:
- by the bearish or bullish candle;
- or by the candlestick Delta (Delta Coloring). The positive Delta is green and the negative Delta is red.
We want to mention the Volume on the Chart indicator. It is the same Volume but it is displayed in the chart area and doesn’t take a separate panel. Volume on the Chart also has several modes and colour settings.
Useful links:
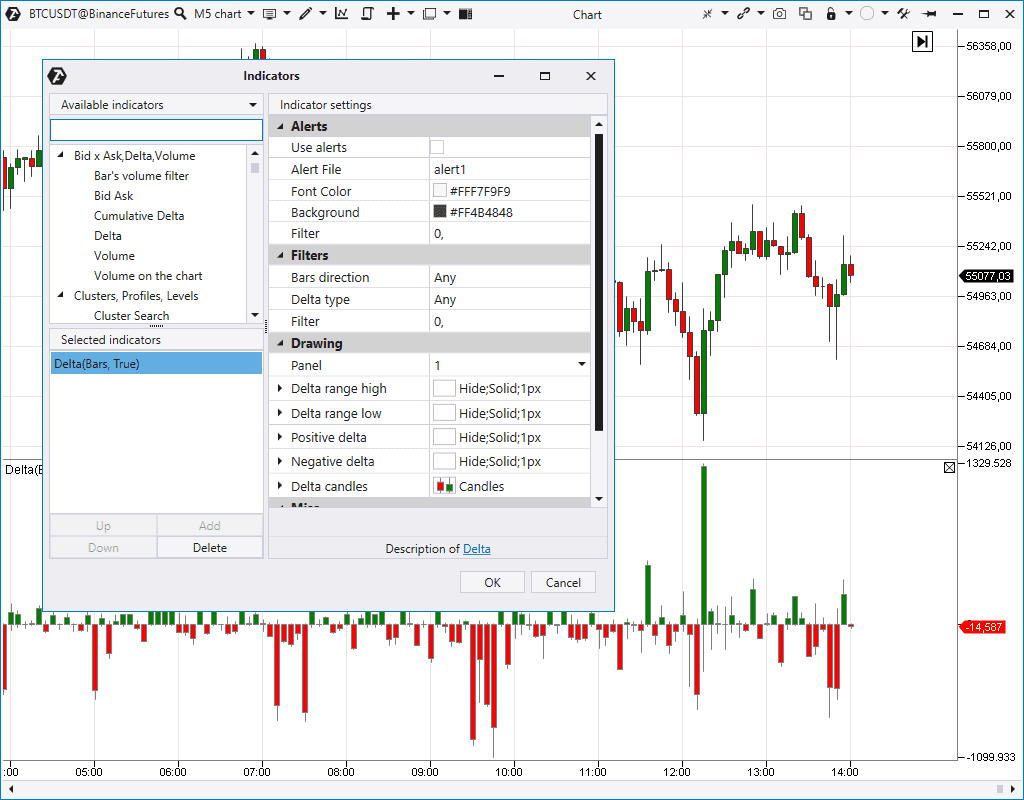
Delta indicator
The Delta indicator shows predominance of market buyers over sellers or vice versa. The indicator settings give you a possibility to:
- Transform the histogram into the unidirectional state.
- Change the histogram display mode.
- Set the search for the positive / negative Delta in bullish or bearish candles separately – for example, the positive Delta in bearish candles or negative Delta in all candles in a row…
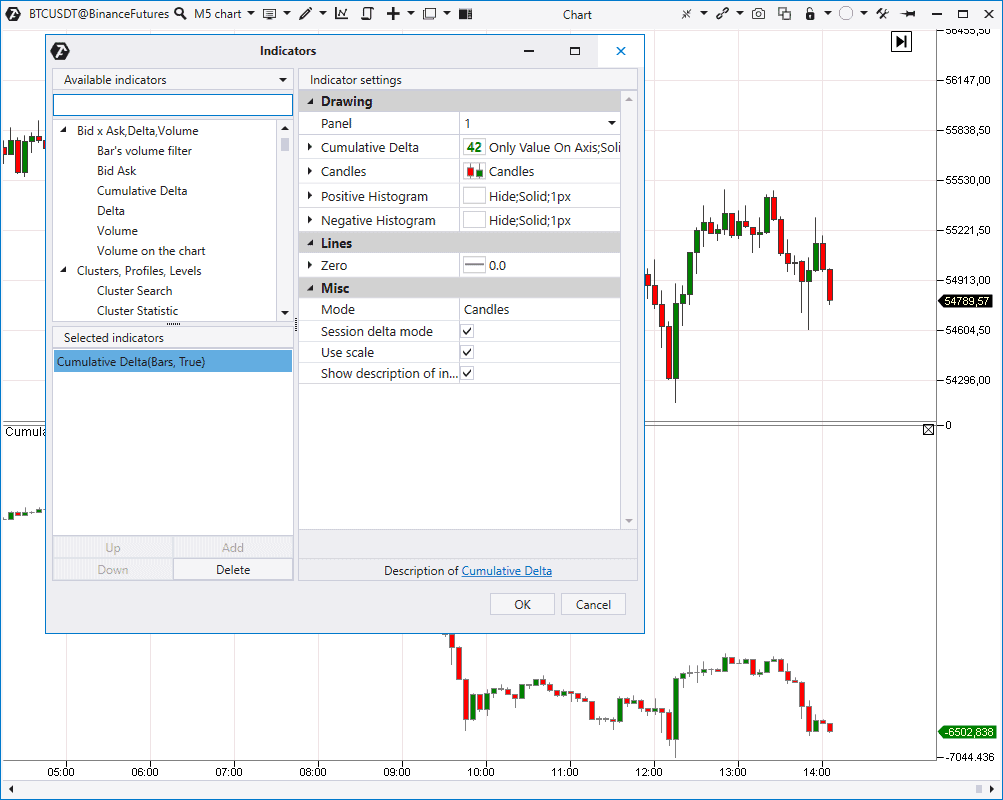
Cumulative Delta indicator
Cumulative Delta contains ‘combined candles’ of the Delta. It means that it shows the Delta change in dynamics, every next value takes into account the sum of previous values, which is reflected in the indicator name.
Cumulative Delta could be:
- The session one – it is reset at the beginning of every new session.
- Continuous.
Useful links:
Now we will speak about indicators of clusters, volume profile and its derivatives.
Cluster Search indicator
Cluster Search is one of the most powerful indicators in the platform. It provides a possibility to:
- look for clusters in the volume, delta, time, trade and other modes;
- set percentage predominance between clusters by Bids and Asks;
- set a filter by the Delta;
- look for clusters in certain places of a candle;
- look for clusters in specific candles, for example, bearish or bullish.
You can set alerts and shapes and colours of the indicator signal display in the chart (pink squares by default).
Useful links:
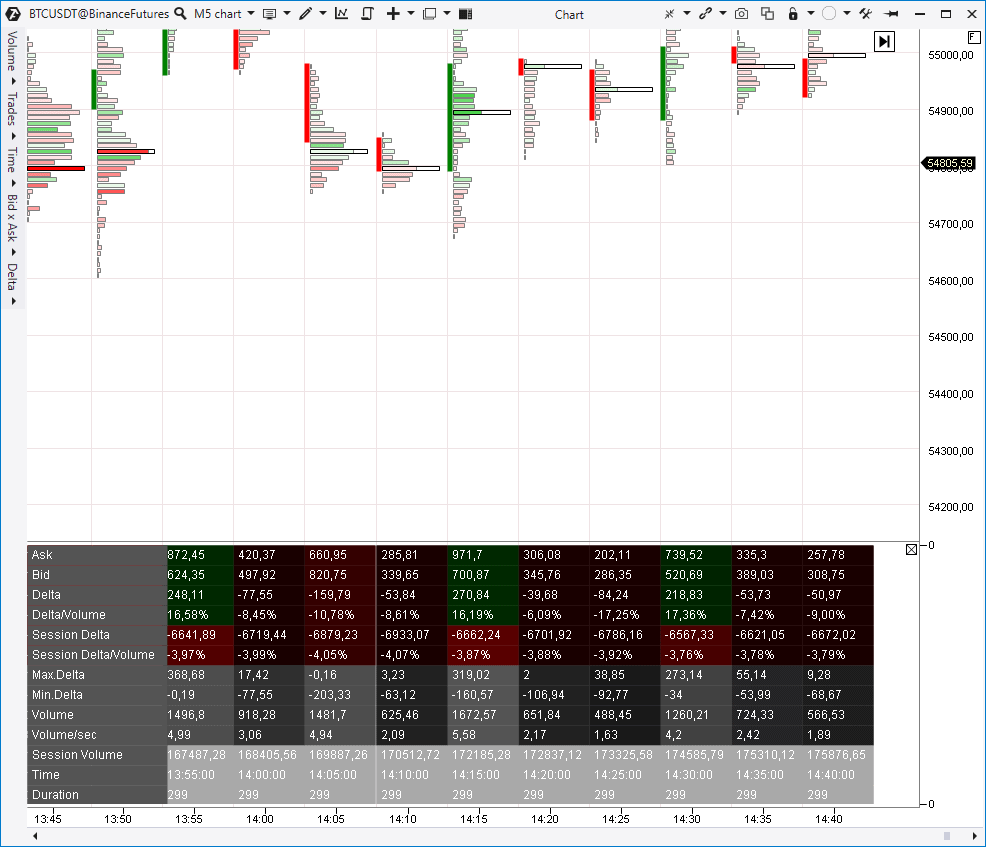
Cluster Statistic indicator
The Cluster Statistic indicator provides statistical information about every candle, for example:
- session volume in percentage and in contracts;
- Bid and Ask separately;
- session Delta;
- maximum and minimum Delta and so on.
Important! The indicator works only when candles are transformed into the cluster mode. The gradient highlight clearly shows where extreme values were registered.
Useful link:
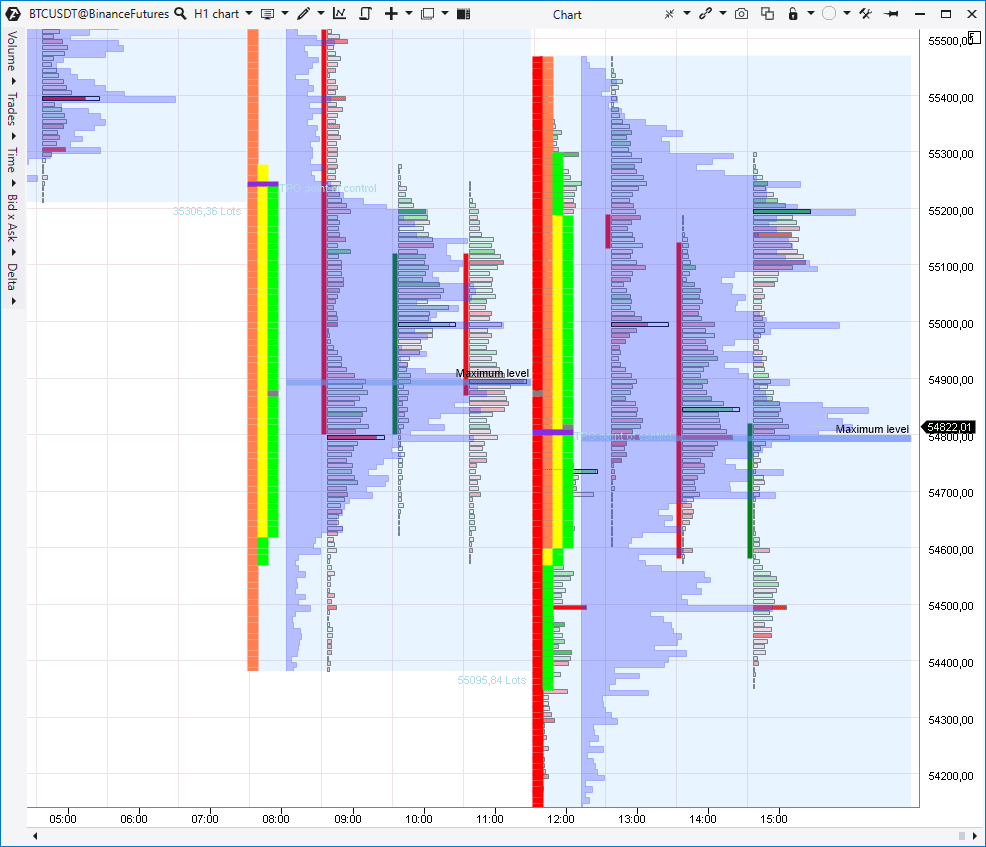
TPO and Profile indicator
TPO and Profile is a universal instrument, which combines:
- volume profile with advanced settings;
- classical market profile.
The TPO and Profile indicator may display them in 4 modes:
- only the volume profile;
- only TPO;
- TPO and volume profile simultaneously (see the screenshot below);
- laying the profile over TPO.
Each mode can be set up by periods.
Being in the volume profile mode you can:
- change the profile type (for example, by Delta, Volume, Time and other criteria);
- specify the maximum level mode;
- activate the Value Area.
TPO (Time Price Opportunity) shows the profile in the form of letter symbols (rainbow-hued), which belong to their trading period. Being in the TPO mode you can also set up:
- Value Area;
- Initial Balance;
- additional filters.
In the event you are not yet acquainted with the classical market profile, we recommend you to read books by James Dalton and Peter Steidlmayer. We also have a number of articles on this topic and patterns in our blog.
Useful links:
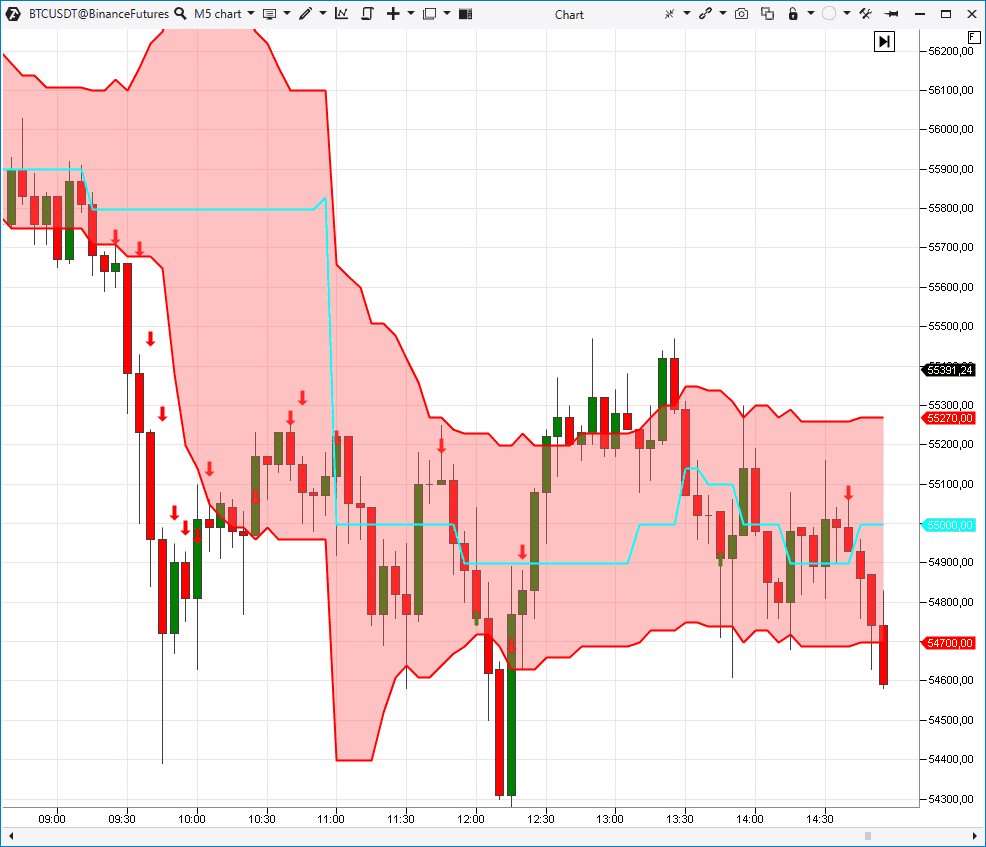
Dynamic Levels indicator
This Volume Profile derivative indicator reflects dynamic change of the VAH, VAL and POC levels in the chart. There are various types of settings, for example, Delta, Time, trades and so on. You can consider channel building within an hour, day or week.
Maximum Levels indicator
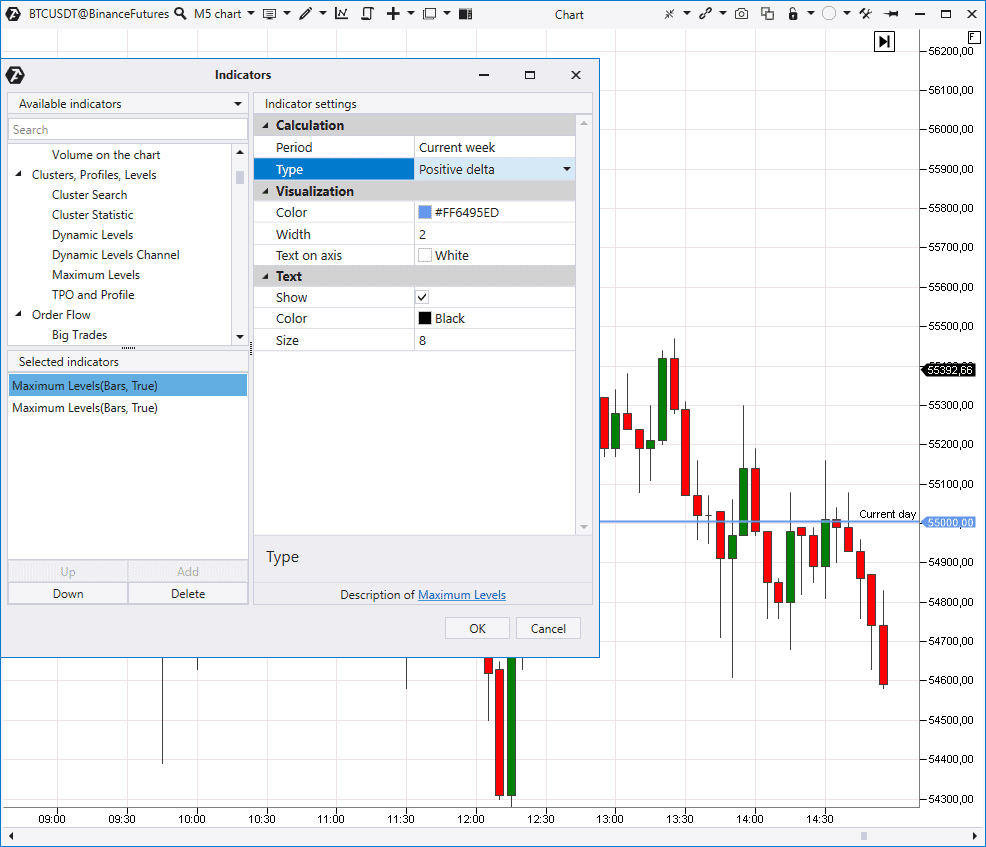
This indicator marks levels with the maximum Volume, Delta, Time, trades and so forth on the price scale.
You can look for maximum levels in various periods: for the current/previous day, week, month and also for the whole contract. It is a simple but rather useful indicator if you focus on strong volume levels in trading and analysis.
Useful links:
The next ATAS indicator category is Order Flow. It contains the Big Trades indicator.
Big Trades indicator
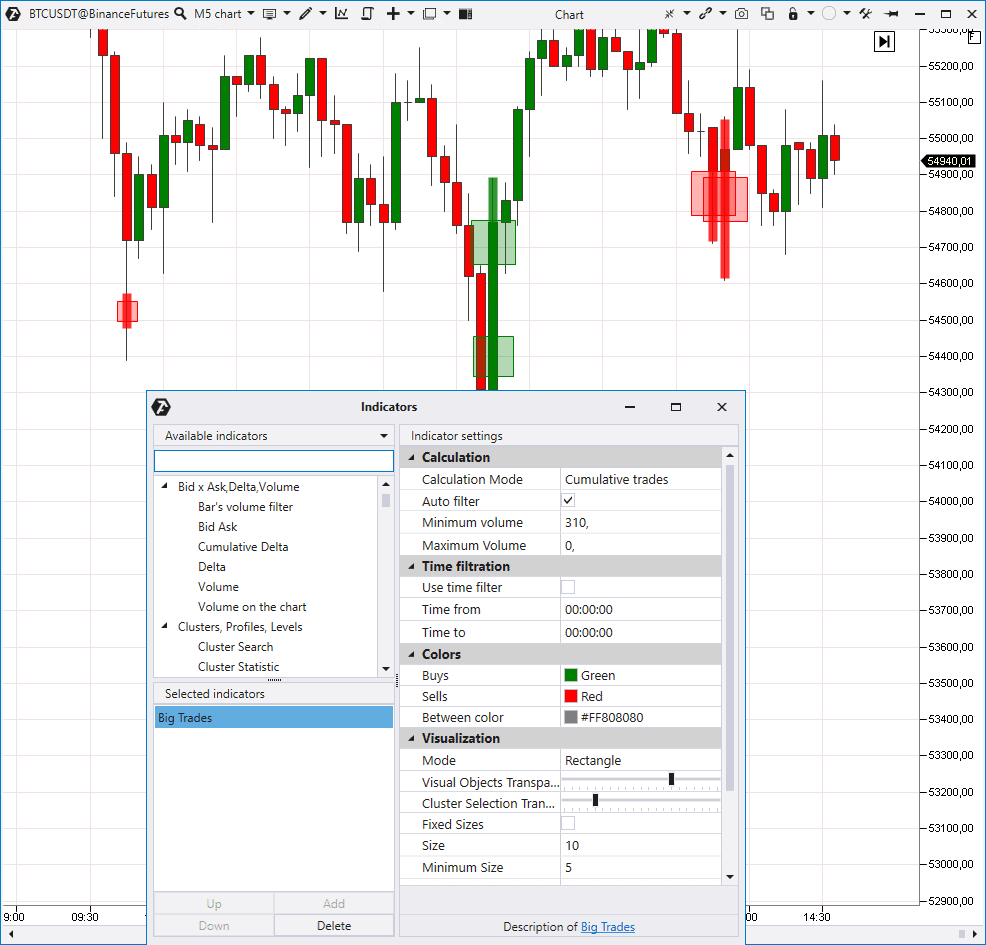
It ‘pulls out’ trades from the tape and shows these places in the chart. You can look for single or aggregated prints (trades). Aggregation (combining single trades into one print) is carried out in accordance with ATAS algorithms, which are not disclosed.
An autofilter, which will independently select the volume level for displaying the biggest trades, is turned on by default. If you turn the autofilter off, you can set the trade volume value by yourself.
The Big Trades indicator is often confused with Cluster Search. The difference between them is that Big Trades ‘pulls out’ big trades of various sizes from the Time & Sales and Cluster Search looks at the total volume in a candlestick cluster.
Useful links:
Multi Market powers and Market power indicators
The next indicators for analysis of trades from the Time & Sales are Multi Market Powers (on top) and Market Power (in the bottom).
They are capable of displaying various trade groups, distributed by volume, in the lower chart panel. These indicators are similar to Cumulative Delta and allow seeing dynamics of various trade groups.
For example, you want to see dynamics of small trades from 1 to 2 contracts. You set the filter and can see places where:
- there was growth, which means predominance of aggressive buys;
- there was reduction, which means predominance of aggressive sellers.
You can create several filters of this type in Multimarket Power.
Useful links:
Order flow indicator
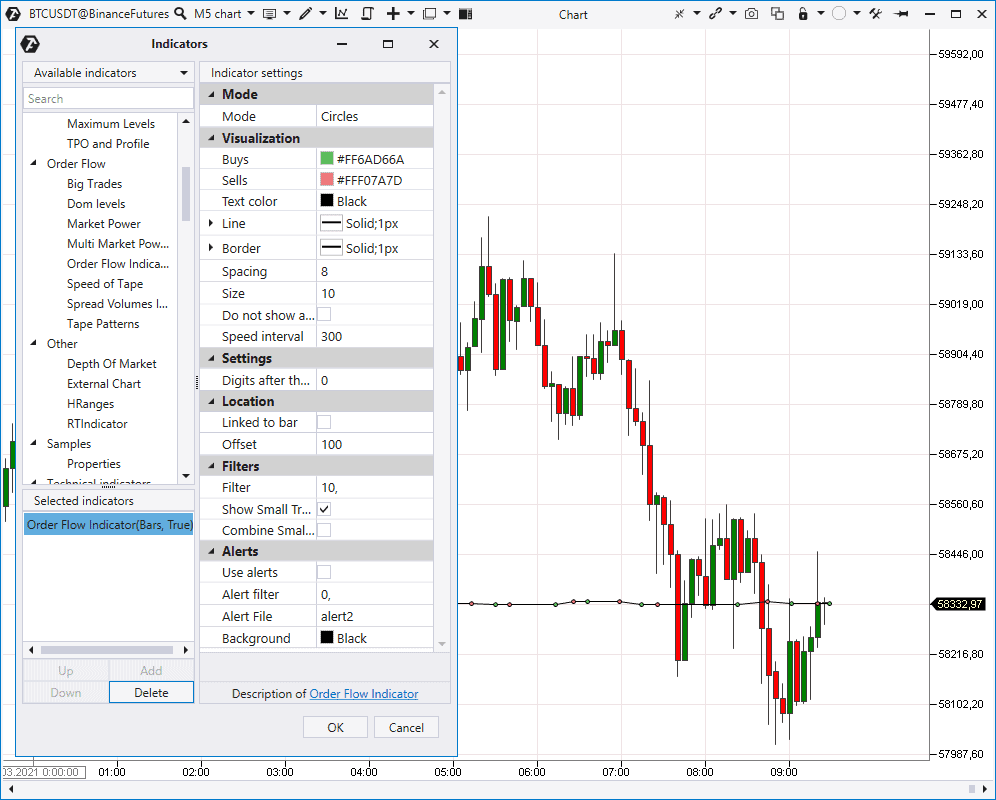
Now we proceed to the Order Flow indicator, which visualizes trades from the Time & Sales.
You can set the big trades filter in settings and these big trades will be displayed in the form of big blocks with numbers and small trades – in the form of small dots. You can also combine small trades so that they do not take much space. If you need to see the real-time order flow, but it is not convenient to read it in the form of a table, use this indicator.
Useful links:
Speed of Tape indicator
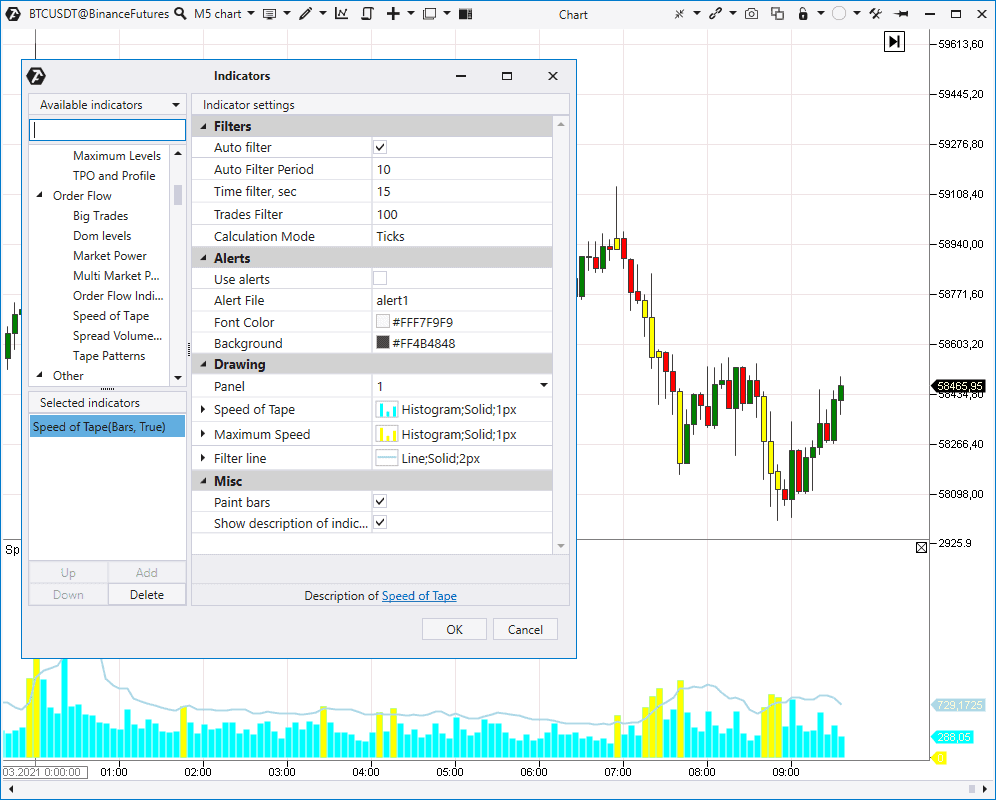
Now we move to the Speed of Tape indicator. It changes the Time & Sales speed:
- separately by the trades on selling and buying;
- or in general by the trade execution speed (shown in the screenshot).
The indicator has an autofilter, which draws the moving average in the histogram below and colours places of splashes, including in the chart (by default with yellow colour). The indicator will be more useful for day traders that work on small time-frames, such as 1 minute or 10 seconds.
Useful links:
Spread Volumes indicator
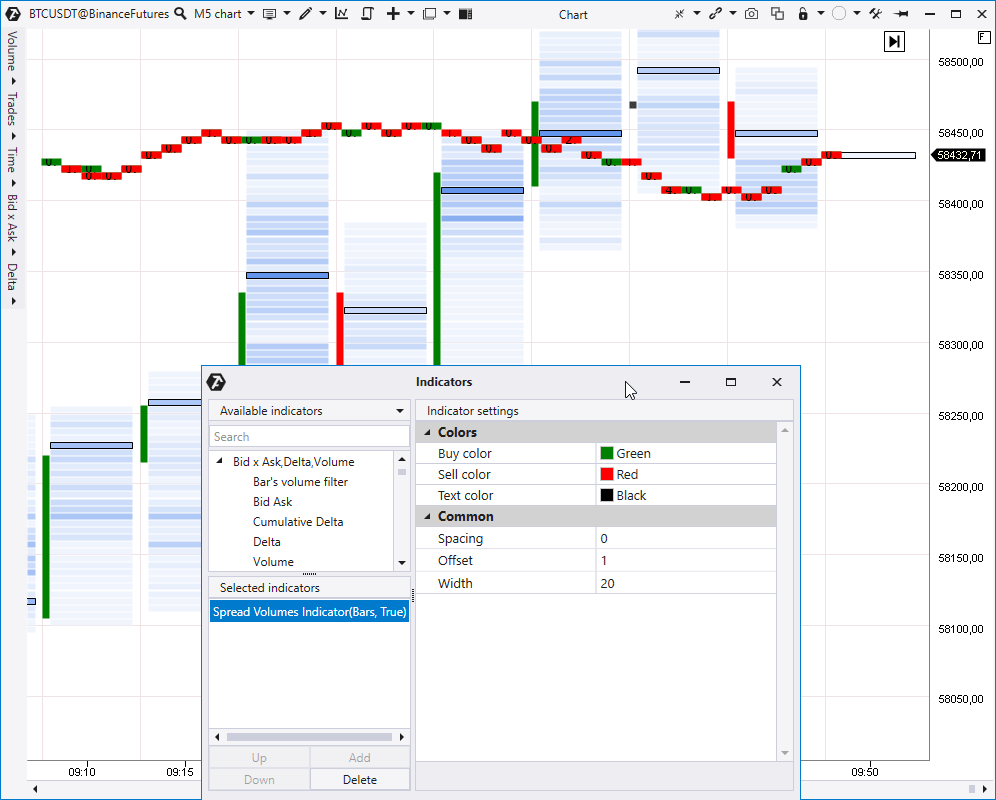
Spread Volumes Indicator shows market buy and sell trades in the chart.
Trades are included into one block while the spread is not changed, in other words the Best Ask and Best Bid prices are at specific levels. As soon as the spread changes, for example, it becomes 1 tick higher or lower, trades start to be included into the next block.
Useful link:
Tape Patterns indicator
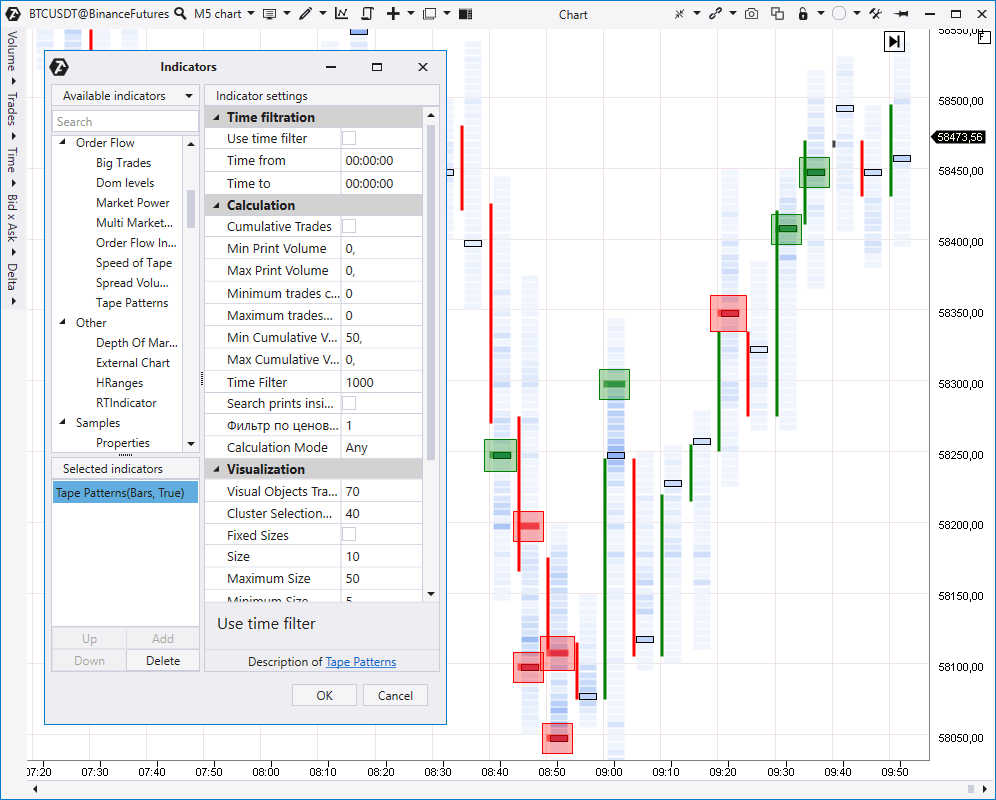
Tape Patterns is an indicator with a big number of Time & Sales filters. You can use it to:
- analyse aggregated or fragmented trades;
- set filters by maximum and minimum values of the tick volume, number of trades and total volume;
- carry out search inside a time range, for example, inside 1 second and by the tick range. All found patterns will be visually highlighted.
Depth Of Market indicator
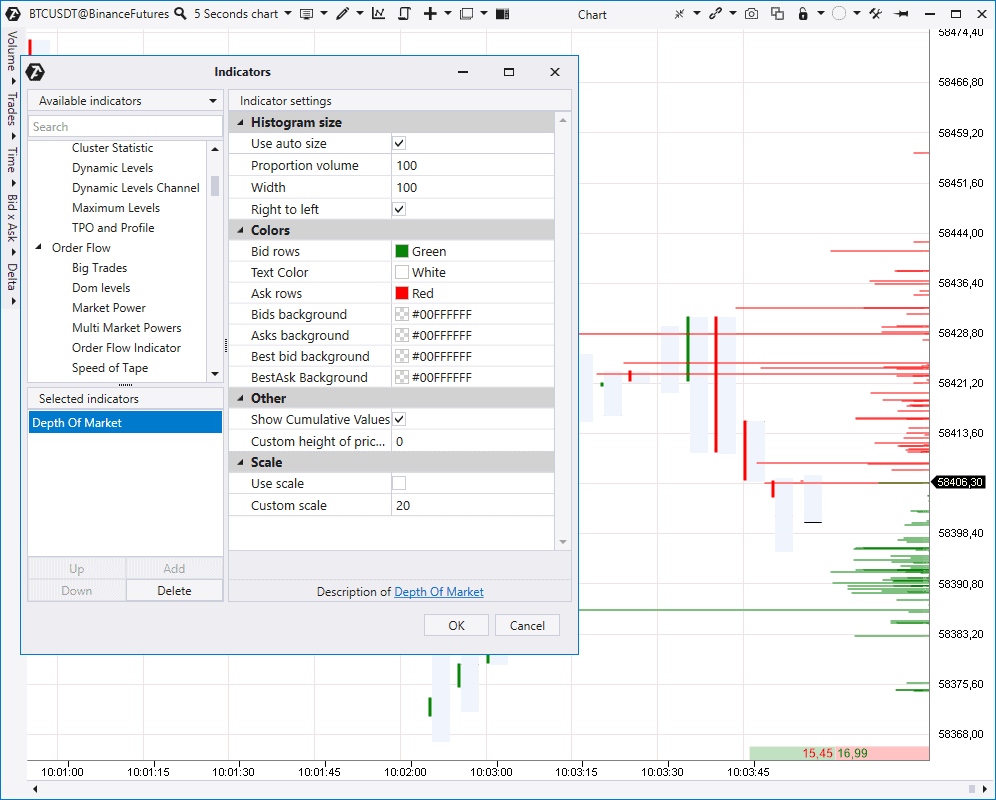
Let’s move to the order book analysis indicators. The Depth Of Market (DOM) indicator shows limit sell and buy orders in the right part of the chart.
Here you can set visual settings and scaling.
Useful link:
DOM Levels indicator
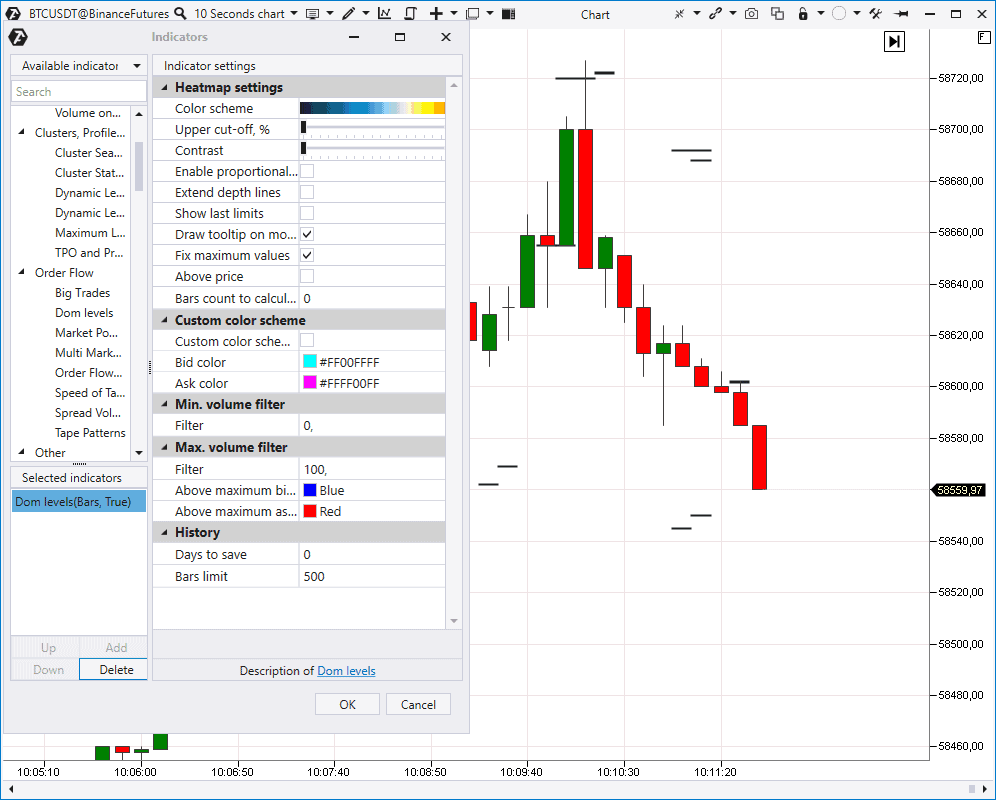
The DOM Levels indicator draws significant order book levels, where big limit orders were noticed, directly in the chart.
You can set up proportionality in order to see wide and narrow levels, in other words where there was a big or small volume of limit orders. A big selection of colour preferences in the form of a ‘heat map’ and filters of minimum and maximum values will help to fine tune the indicator for every exchange instrument.
Useful links:
DOM power indicator
DOM Power shows changes of Bids and Asks in the order book.
It helps to see when there was predominance of buyers and when – of sellers and how the price reacts to these predominances.
Useful link:
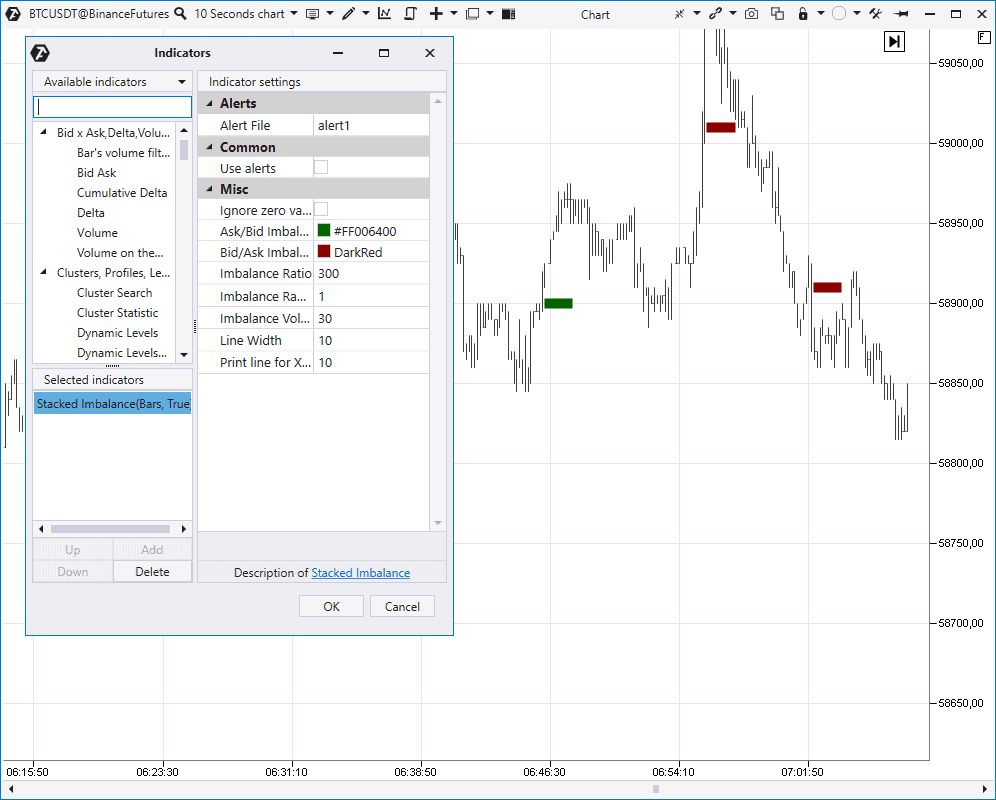
Stacked Imbalance indicator
It looks for imbalances in market buys or sells and highlights these places by levels.
You can set the following in the settings:
- a necessary imbalance in percentage;
- a range, in which this predominance should be looked for. For example, at 3 neighbouring price levels as it is set by default;
- a minimum volume as an additional filter.
It is an excellent instrument for automatic building intraday support and resistance areas, from which a bounce could be expected.
Useful links:
Combining indicators
ATAS also provides a possibility to combine some indicators.
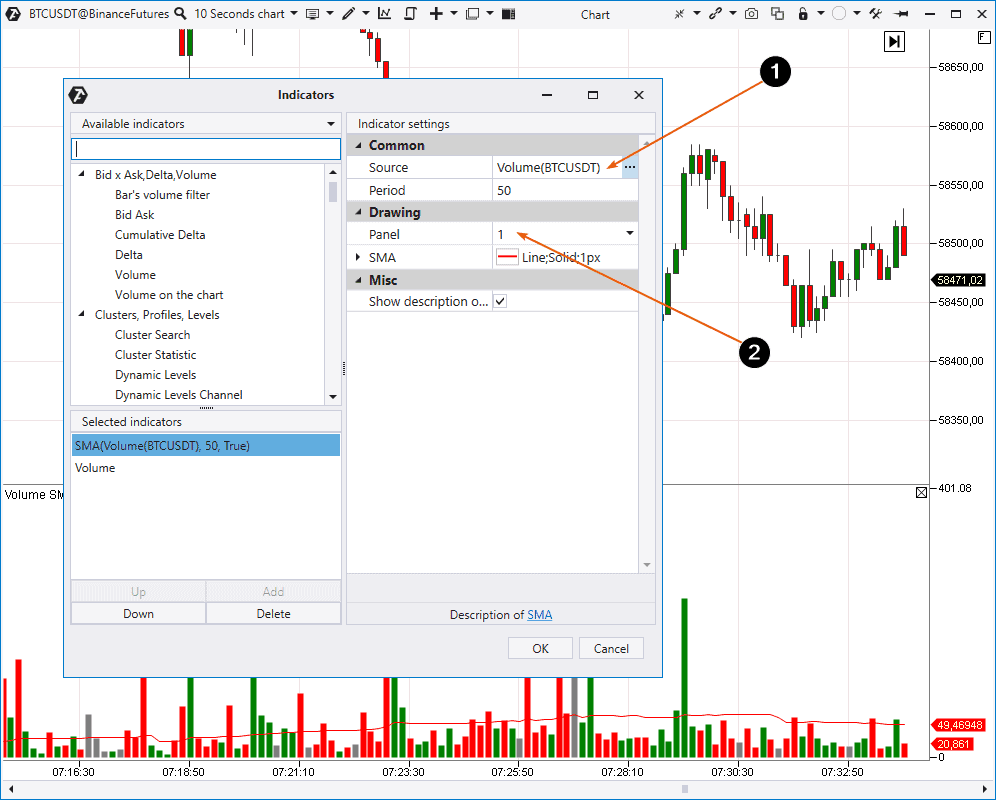
Example: You want to combine the volume indicator and Simple Moving Average (SMA) in order to assess the volume dynamics in comparison. To do it:
- add SMA;
- set Volume as the Source (1);
- show the Panel (2), on which SMA will be built.
This article explains how to ‘run’ the Cumulative Delta data through the RSI (Relative Strength Index) indicator. Perhaps, it will be acceptable to say that in such a way you receive a ‘2 in 1’ indicator.
Technical indicators
The platform also has a big number of other indicators, including about 50 technical ones. You can find instructions on how to use them in our Knowledge Base.
Useful links:
Conclusions of the fourth article from the ‘Getting acquainted with ATAS’ series
You have just read a review about indicators, which are available in the ATAS platform. As you understand, it is practically impossible to consider every available indicator in detail in the article format. If you got interested in some specific indicator, use links to relevant articles.
We recommend you to download the ATAS demo version to reinforce the material you have got acquainted with and check how indicators work in the markets, which are interesting for you.
You can find ideas for trading strategies on our YouTube channel and also in our blog (use the Indicators tag).
Information in this article cannot be perceived as a call for investing or buying/selling of any asset on the exchange. All situations, discussed in the article, are provided with the purpose of getting acquainted with the functionality and advantages of the ATAS platform.

